- Page 1 and 2: ITM-rapport 105PROVNINGSJÄMFÖRELS
- Page 3 and 4: PROVNINGSJÄMFÖRELSE2002 - 3Jonbal
- Page 5 and 6: InnehållFörord ..................
- Page 7 and 8: FörordStatens Naturvårdsverk har
- Page 9 and 10: NP5=0.0103±0.0085) och NP4 ger sig
- Page 11 and 12: Prov 3: Fördelningen är signifika
- Page 13 and 14: On monday the 16th of september 200
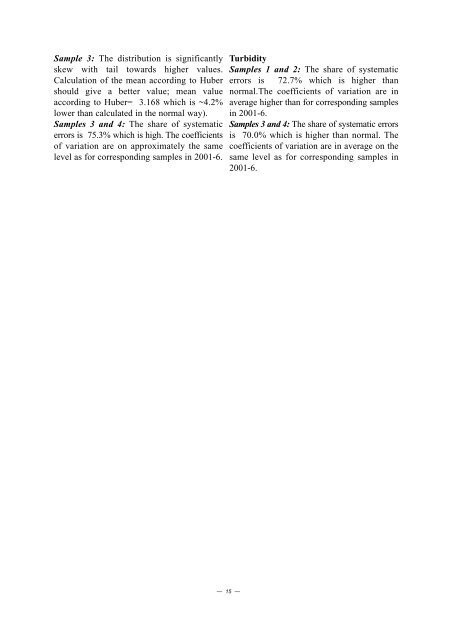
- Page 15: K (potassium)Samples 1 and 2: The s
- Page 19 and 20: Sammanfattningstabell 2Summary tabl
- Page 21 and 22: Sammanfattning av denna och tidigar
- Page 23 and 24: ALKProv2mmol/lMetod XBAR Median Std
- Page 25 and 26: ALKProv3mmol/lMetod XBAR Median Std
- Page 27 and 28: ALKYoudendiagramprov3och4mmol/lProv
- Page 29 and 30: Sammanfattning av denna och tidigar
- Page 31 and 32: CaProv2mg/lMetod XBAR Median Stdev
- Page 33 and 34: CaProv3mg/lMetod XBAR Median Stdev
- Page 35 and 36: CaYoudendiagramprov3och4mg/lProv410
- Page 37 and 38: Sammanfattning av denna och tidigar
- Page 39 and 40: CaMgYoudendiagramprov1och2mg/lProv2
- Page 41 and 42: CaMgYoudendiagramprov3och4mg/l1095%
- Page 43 and 44: Sammanfattning av denna och tidigar
- Page 45 and 46: ClProv2mg/lMetod XBAR Median Stdev
- Page 47 and 48: ClProv3mg/lMetod XBAR Median Stdev
- Page 49 and 50: ClYoudendiagramprov3och4mg/l495%kon
- Page 51 and 52: Sammanfattning av denna och tidigar
- Page 53 and 54: CODMnYoudendiagramprov1och2mg/l30Pr
- Page 55 and 56: CODMnYoudendiagramprov3och4mg/lProv
- Page 57 and 58: Sammanfattning av denna och tidigar
- Page 59 and 60: CORGYoudendiagramprov1och2mg/lProv2
- Page 61 and 62: CORGYoudendiagramprov3och4mg/lProv4
- Page 63 and 64: Sammanfattning av denna och tidigar
- Page 65 and 66: FYoudendiagramprov1och2mg/l0.5Prov2
- Page 67 and 68:
FYoudendiagramprov3och4mg/l0.25Prov
- Page 69 and 70:
Sammanfattning av denna och tidigar
- Page 71 and 72:
FÄRGProv2mgPt/lMetod XBAR Median S
- Page 73 and 74:
FÄRGProv3mgPt/lMetod XBAR Median S
- Page 75 and 76:
FÄRGYoudendiagramprov3och4mgPt/l35
- Page 77 and 78:
Sammanfattning av denna och tidigar
- Page 79 and 80:
KProv2mg/lMetod XBAR Median Stdev R
- Page 81 and 82:
KProv3mg/lMetod XBAR Median Stdev R
- Page 83 and 84:
KYoudendiagramprov3och4mg/l0.895%ko
- Page 85 and 86:
Sammanfattning av denna och tidigar
- Page 87 and 88:
KONDProv2mS/mMetod XBAR Median Stde
- Page 89 and 90:
KONDProv3mS/mMetod XBAR Median Stde
- Page 91 and 92:
KONDYoudendiagramprov3och4mS/mProv4
- Page 93 and 94:
Sammanfattning av denna och tidigar
- Page 96 and 97:
MgYoudendiagramprov1och2mg/l595%kon
- Page 98 and 99:
MgProv4mg/lMetod XBAR Median Stdev
- Page 100 and 101:
Prov 1: Fördelningen är signifika
- Page 102 and 103:
NaProv1mg/lMetod XBAR Median Stdev
- Page 104 and 105:
NaYoudendiagramprov1och2mg/l10995%k
- Page 106 and 107:
NaProv4mg/lMetod XBAR Median Stdev
- Page 108 and 109:
Prov 1 och 2: Andelen systematiska
- Page 110 and 111:
pHProv1Metod XBAR Median Stdev Rang
- Page 112 and 113:
pHYoudendiagramprov1och28.5Prov28.2
- Page 114 and 115:
pHProv4Metod XBAR Median Stdev Rang
- Page 116 and 117:
Prov 1: Fördelningen är spetsigar
- Page 118 and 119:
ΣANJONERYoudendiagramprov1och2mekv
- Page 120 and 121:
ΣANJONERYoudendiagramprov3och4mekv
- Page 122 and 123:
ΣKATJONERProv1mekv/lMetod XBAR Med
- Page 124 and 125:
ΣKATJONERProv3mekv/lMetod XBAR Med
- Page 126 and 127:
Prov 1: NN ger signifikant högre m
- Page 128 and 129:
SO4Prov1mg/lMetod XBAR Median Stdev
- Page 130 and 131:
SO4Youdendiagramprov1och2mg/lProv22
- Page 132 and 133:
SO4Prov4mg/lMetod XBAR Median Stdev
- Page 134 and 135:
Prov 1 och 2: Andelen systematiska
- Page 136 and 137:
TURBYoudendiagramprov1och28Prov2642
- Page 138 and 139:
TURBYoudendiagramprov3och4Prov421.8
- Page 140 and 141:
Grundläggande definitioner samt ut
- Page 142 and 143:
Beräkningar vars resultat endast k
- Page 144 and 145:
CEMENTARESEARCHAB CENOX DOMSJÖFABR
- Page 146 and 147:
MILJÖLAB.IKARLSHAMNSKOMMUNMOTALAKO
- Page 148:
TEKNISKAFÖRVALTNINGEN TEKNISKAKONT


