PROVNINGSJÃMFÃRELSE 2002 - 3 - ITM
PROVNINGSJÃMFÃRELSE 2002 - 3 - ITM
PROVNINGSJÃMFÃRELSE 2002 - 3 - ITM
You also want an ePaper? Increase the reach of your titles
YUMPU automatically turns print PDFs into web optimized ePapers that Google loves.
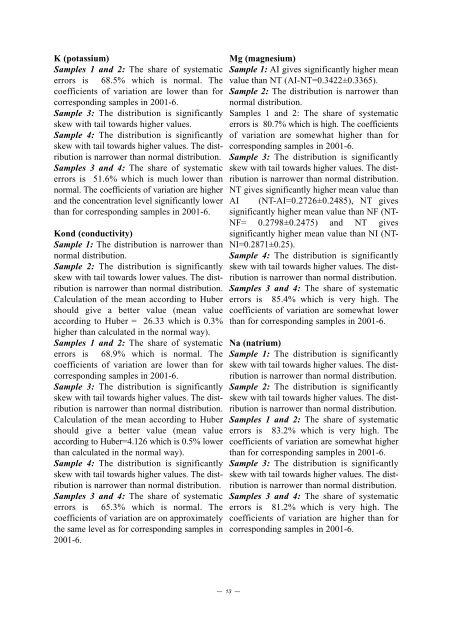
K (potassium)Samples 1 and 2: The share of systematicerrors is 68.5% which is normal. Thecoefficients of variation are lower than forcorresponding samples in 2001-6.Sample 3: The distribution is significantlyskew with tail towards higher values.Sample 4: The distribution is significantlyskew with tail towards higher values. The distributionis narrower than normal distribution.Samples 3 and 4: The share of systematicerrors is 51.6% which is much lower thannormal. The coefficients of variation are higherand the concentration level significantly lowerthan for corresponding samples in 2001-6.Kond (conductivity)Sample 1: The distribution is narrower thannormal distribution.Sample 2: The distribution is significantlyskew with tail towards lower values. The distributionis narrower than normal distribution.Calculation of the mean according to Hubershould give a better value (mean valueaccording to Huber = 26.33 which is 0.3%higher than calculated in the normal way).Samples 1 and 2: The share of systematicerrors is 68.9% which is normal. Thecoefficients of variation are lower than forcorresponding samples in 2001-6.Sample 3: The distribution is significantlyskew with tail towards higher values. The distributionis narrower than normal distribution.Calculation of the mean according to Hubershould give a better value (mean valueaccording to Huber=4.126 which is 0.5% lowerthan calculated in the normal way).Sample 4: The distribution is significantlyskew with tail towards higher values. The distributionis narrower than normal distribution.Samples 3 and 4: The share of systematicerrors is 65.3% which is normal. Thecoefficients of variation are on approximatelythe same level as for corresponding samples in2001-6.Mg (magnesium)Sample 1: AI gives significantly higher meanvalue than NT (AI-NT=0.3422±0.3365).Sample 2: The distribution is narrower thannormal distribution.Samples 1 and 2: The share of systematicerrors is 80.7% which is high. The coefficientsof variation are somewhat higher than forcorresponding samples in 2001-6.Sample 3: The distribution is significantlyskew with tail towards higher values. The distributionis narrower than normal distribution.NT gives significantly higher mean value thanAI (NT-AI=0.2726±0.2485), NT givessignificantly higher mean value than NF (NT-NF= 0.2798±0.2475) and NT givessignificantly higher mean value than NI (NT-NI=0.2871±0.25).Sample 4: The distribution is significantlyskew with tail towards higher values. The distributionis narrower than normal distribution.Samples 3 and 4: The share of systematicerrors is 85.4% which is very high. Thecoefficients of variation are somewhat lowerthan for corresponding samples in 2001-6.Na (natrium)Sample 1: The distribution is significantlyskew with tail towards higher values. The distributionis narrower than normal distribution.Sample 2: The distribution is significantlyskew with tail towards higher values. The distributionis narrower than normal distribution.Samples 1 and 2: The share of systematicerrors is 83.2% which is very high. Thecoefficients of variation are somewhat higherthan for corresponding samples in 2001-6.Sample 3: The distribution is significantlyskew with tail towards higher values. The distributionis narrower than normal distribution.Samples 3 and 4: The share of systematicerrors is 81.2% which is very high. Thecoefficients of variation are higher than forcorresponding samples in 2001-6.— 13 —


