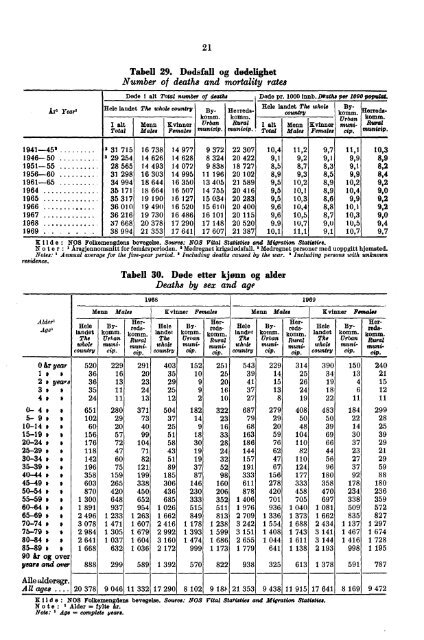
21 År1 Year' Tabell 29. Dødsfall og dødelighet Number of death8 and mortality rates Døde i alt Total number of deaths Hele landet The whole country B y- I alt Total Menn Males Kvinner Females komm. Urban municiP. Herredskomm. Rural municiP• Døde pr. 1000 innb. .Deaths per 1000 populat. Hele landet The whole country By- I alt Total Menn Males Kvinner Females komm. Urban municip. Herreds- komm- Rural municiP. 1941-451 a 31 715 16 738 14 977 9 372 22 307 10,4 11,2 9,7 11,1 10,3 1946-50 a 29 254 14 626 14 628 8 324 20 422 9,1 9,2 9,1 9,9 8,9 1951-55 28 565 14 493 14 072 9 838 18 727 8,5 8,7 8,3 9,1 8,2 1956-60 31 298 16 303 14 995 11 196 20 102 8,9 9,3 8,5 9,9 8,4 1961-65 34 994 18 644 16 350 13 405 21 589 9,5 10,2 8,9 10,2 9,2 1964 35 171 18 664 16 507 14 755 20 416 9,5 10,1 8,9 10,4 9,C 1965 35 317 19 190 16 127 15 034 20 283 9,5 10,3 8,6 9,9 9,2 1966 36 010 19 490 16 520 15 610 20 400 9,6 10,4 8,8 10,1 9,2 1967 36 216 19 730 16 486 16 101 20 115 9,6 10,5 8,7 10,3 9,C 1968 37 668 20 378 17 290 17 148 20 520 9,9 10,7 9,0 10,5 9,4 1969 . . . . . . . 38 994 21 353 17 641 17 607 21 387 10,1 11,1 9,1 10,7 9,7 I lde: NOS Folkemengdens bevegelse. Source: NOS Vital Statistics and Migration Statistics. Not er : Årsgjennomsnitt for femårsperioden. 2 Medregnet krigsdødsfall. Medregnet personer med uoppgitt hjemsted. Notes: i Annual average for the five-year period. Including deaths caused by the war. a Including persons with unknown residence. Alder' Ag ei Hele landet The whole country Menn Tabell 30. Døde etter kjønn og alder Death,8 by 8ex and age Males i;-r redskomm. Rural muni. cip. 1968 1969 Hele landet The whole country Kvinner Females Menn Males Kvinner Females Bykomm. Urban municep. Bykomm. Urban municip. Herredskomm. Rural muni. cip. Hele landet The whole country Bykomm. Urban municip. -Herredskomm. Rural muni. di,. Hele landet The whole country Bykomm. Urban municip. Herreds. komm. Rural muni. di, 0 år year 520 229 291 403 152 251 543 229 314 390 150 240 1 * * 36 16 20 35 10 25 39 14 25 34 13 21 2 e years 36 13 23 29 9 20 41 15 26 19 4 15 3, 1 35 11 24 25 9 16 37 13 24 18 6 12 4 e * 24 11 13 12 2 10 27 8 19 22 11 11 0- 4 * * 651 280 371 504 182 322 687 279 408 483 184 299 5- 9 ii * 102 29 73 37 14 23 79 29 50 50 22 28 10-14 e * 60 20 40 25 9 16 68 20 48 39 14 25 15-19 * * 156 57 99 51 18 33 163 59 104 69 30 39 20-24 * * 176 72 104 58 30 28 186 76 110 66 37 29 25-29 e i 118 47 71 43 19 24 144 62 82 44 23 21 30-34 • * 142 60 82 51 19 32 157 47 110 56 27 29 35-39 e * 196 75 121 89 37 52 191 67 124 96 37 59 40-44 • * 358 159 199 185 87 98 333 156 177 180 92 88 45-49 / * 603 265 338 306 146 160 611 278 333 358 178 180 50-54 * * 870 420 450 436 230 206 878 420 458 470 234 236 55-59 * * 1 300 648 652 685 333 352 1 406 701 705 697 338 359 60-64 / * 1 891 937 954 1 026 515 511 1 976 936 1 040 1 081 509 572 65-69 * * 2 496 1 233 1 263 1 662 849 813 2 709 1 336 1 373 1 662 835 827 70-74 * i 3 078 1 471 1 607 2 416 1 178 1 238 3 242 1 554 1 688 2 434 1 137 1 297 75-79 i * 2 984 1 305 1 679 2 992 1 393 1 599 3 151 1 408 1 743 3 141 1 467 1 674 80-84 s * 2 641 1 037 1 604 3 160 1 474 1 686 2 655 1 044 1 611 3 144 1 416 1 728 85-89 * * 1 668 632 1 036 2 172 999 1 173 1 779 641 1 138 2 193 998 1 195 90 år og over year, and over 888 299 589 1 392 570 822 938 325 613 1 378 591 787 Alle aldersgr. All ages . . . . 20 378 9 046 11 332 17 290 8 102 9 1 8l• 21 353 9 438 11 915 17 641 8 169 9 472 Hilde: NOS Folkemengdens bevegelse. Source: NOS Vital Statistics and Migration Statistics. Note : 1 Alder fylte år. Note: Age = complete years.
22 Krematorium Crematory 1970 Halden Sarpsborg Fredrikstad Moss Borge Askim Asker Bærum (Haslum) Skedsmo Oslo Vest Oslo Ost Hamar Drammen Horten Tønsberg Sandefjord Larvik Skien Tinn (Rjukan) Arendal Kristiansand Tabell 31. Dødelighet etter fylke Mortality rate by county Døde pr. 1 000 innbyggere Deaths by 1 000 population Fylke County 1916- I 1920 1 1925 1 1 1926-1 1931- 1936--1 1941- 1946- 1951- I 1956- 1961- 1930 1 1935 1940 1 1945' 1950 1955 1 1980 1965 Hele landet The whole country 14,2 11,5 11,0 10,4 10,4 10,6 9,1 8,5 8,9 9,5 Bykommuner Urban municipalities 14,4 11,7 11,1 10,6 10,7 11,1 9,9 9,1 9,9 10,2 Herredskommuner Rural municipalities 13,9 11,4 10,9 10,3 10,2 10,3 8,9 8,2 8,4 9,2 Østfold 13,5 10,8 10,5 10,3 10,6 10,2 9,3 8,5 9,1 9,8 Akershus 10,9 9,5 9,1 8,8 8,6 8,9 7,8 7,6 7,8 7,6 Oslo 12,7 11,4 11,3 10,7 10,7 10,8 10,2 9,0 9,9 11,0 Hedmark 13,4 11,2 10,8 10,0 10,0 9,7 8,9 8,3 9,0 10,1 Oppland 13,0 11,2 10,7 10,2 10,3 9,9 8,5 8,4 8,8 9,6 Buskerud 13,6 10,9 10,4 9,9 10,0 9,9 8,8 8,8 9,3 10,3 Vestfold 14,1 11,4 10,5 10,8 11,2 11,2 9,4 8,6 9,1 9,8 Telemark 13,2 11,0 10,5 10,3 10,4 10,4 9,2 9,0 9,3 10,4 Aust -Agder 15,5 12,8 13,0 12,3 11,6 12,0 11,0 10,2 10,4 11,9 Vest-Agder 14,1 12,7 12,6 11,6 12,2 11,7 10,0 9,2 9,1 9,5 Rogaland 13,8 11,3 11,0 10,4 10,3 10,2 8,7 7,7 8,2 8,7 Hordaland 14,3 11,6 11,1 10,6 10,2 10,4 8,6 7,7 8,1 8,3 Bergen 14,1 11,7 10,8 9,9 10,1 11,0 9,1 9,1 10,3 10,9 Sogn og Fjordane 15,0 12,6 12,3 11,8 11,4 11,4 10,3 9,4 9,6 10,3 Møre og Romsdal 14,6 11,9 11,4 10,6 9,8 10,8 9,3 8,5 8,3 8,9 Sør-Trøndelag 15,6 12,3 11,7 10,8 10,7 11,0 9,7 8,8 9,3 9,5 Nord-Trøndelag 15,0 12,8 11,7 10,6 10,8 10,4 9,1 8,1 8,2 9,2 Nordland 14,2 11,4 10,7 9,7 10,1 10,4 9,0 8,1 8,0 8,8 Troms 15,9 11,9 11,1 10,3 10,5 11,3 9,2 8,0 8,0 8,5 Finnmark 20,5 15,3 12,8 11.5 10,7 14,4 8,6 7,8 7,7 8,1 Kilde: NOS Folkemengdens bevegelse. Source: NOS Vital Statistics and Migration Statistics. Note: Medregnet krigsdødsfall. Note: 1 Including deaths caused by the war. Åpnet Opened Tabell 32. Kremasjoner Cremations Tallet på kremerte Cremations I alt Total H jemmehørende i kommunen Residents 1957 58 37 1961 116 88 1965 95 70 1938 233 175 1964 13 11 1965 24 9 1961 107 97 1966 331 300 1958 128 61 1909 2 473 2 317 1961 2 071 2 001 1938 330 126 1927 697 447 1940 120 90 1939 196 69 1960 105 101 1956 152 95 Krematorium Crematory Stavanger Haugesund Odda Bergen Ålesund Kristiansund Trondheim » Lade Orkanger Steinkjer Verdal Vestvågøy (Stamsund) Narvik Tromso Åpnet Opened Tallet på kremerte Cremations 1 alt Total Hjemmehørende i kommunen Residents 1941 224 204 1967 29 26 1958 18 17 1907 1 142 900 1956 49 46 1939 136 130 1919 405 382 1962 286 266 1967 11 8 1953 51 33 1969 7 1 1939 6 1 1958 45 34 1957 19 18 Pr. 100 døde Per 100 deaths 1936 104 69 I alt T otal 1970.... 26 1954 36 36 1969.... 9 605 25 1929 1938 119 52 1968.... 1967.... 9 246 8 601 25 24 Kilde Norsk Kremasjons Forenina. Source: Norwegian Cremation Association. Note: 1. Kremato let var ute av drift i 1970. Note: The crematory was not in function in 1970.
- Page 2 and 3:
PUBLIKASJONER FRA STATISTISK SENTRA
- Page 4 and 5: Standardtegn Tall kan ikke forekomm
- Page 6 and 7: Preface The Statistical Yearbook of
- Page 8 and 9: ir6 Tabell Side 9. Hjemmehørende f
- Page 10 and 11: *8 Tabell Side 82. Offentlig forval
- Page 12 and 13: * 10 Tabell Side 1 46. Produksjon a
- Page 14 and 15: *12 Tabell Side 216. Statsbanenes b
- Page 16 and 17: * 1 4 Tabell Elide 290. Forsikrings
- Page 18 and 19: *16 Tabell Side 356. Kommunale tryg
- Page 20 and 21: *18 Tabell XIX. Valg. Side 424. Sto
- Page 22 and 23: *20 Side Bær, avkasting 84 -busker
- Page 24 and 25: *22 Side frakter 171 industriprod.
- Page 26 and 27: * 24 Side Obligasjoner, emisjon . 2
- Page 28 and 29: *26 Side Trafikkulykker 34, 36, 187
- Page 30 and 31: *28 Page Consumption, alcohol . 297
- Page 32 and 33: Page National accounts 52-61 Nation
- Page 34 and 35: 1 Tabell 1. Geografiske forhold' Ge
- Page 36 and 37: 3 Stasjon Station I Aret Year Tabel
- Page 38 and 39: 5 Tabell 4. Hjemmehørende folkemen
- Page 40 and 41: 7 Tabell 8. Hjemmehørende folkemen
- Page 42 and 43: 9 Tabell 8 (forts.). Hjemmehørende
- Page 44 and 45: 11 rabell 12. Hjemmehørende folkem
- Page 46 and 47: 1 3 Ekteskapets varighet Duration o
- Page 48 and 49: 15 Fylke County Tabell 16. Folkemen
- Page 50 and 51: Alder Age 15-19 år years 1,0 20-24
- Page 52 and 53: 19 Tabell 25. Levendefødte etter b
- Page 56 and 57: 23 Tabell 33. Dødelighet etter kj
- Page 58 and 59: 25 Tabell 35. Middellevetiden' Expe
- Page 60 and 61: 27 Tabell 39. Sykehus, kur- og plei
- Page 62 and 63: 29 As Year Fylke County Tabell 43.
- Page 64 and 65: Kjønn og alder Sex and age Menn Ma
- Page 66 and 67: Deaths by age and cause. 1969 Age (
- Page 68 and 69: 35 Tabell 51. Dødelighet av hjerte
- Page 70 and 71: 37 Tabell 54. Middelhoyde for verne
- Page 72 and 73: 39 Tabell 58. Arbeidsformidlingl La
- Page 74 and 75: 41 Salaried employees and wage earn
- Page 76 and 77: 43 Tabell 62. Befal og mannskap i h
- Page 78 and 79: 45 Nr.' No.' 6 60 61 7-8 70 71 72 7
- Page 80 and 81: 47 Konflikter Work stoppages Av dis
- Page 82 and 83: 41) Tabell 72. Arbeidstakersammensl
- Page 84 and 85: 51 Tabell 73 (forts.). Arbeidsgiver
- Page 86 and 87: 53 Tabell 75. Privat konsum. Mill.
- Page 88 and 89: Privat konsum Private consumption O
- Page 90 and 91: 57 Tabell 84. Utenriksregnskap. Mil
- Page 92 and 93: 59 Tabell 84 (forts.). Utenriksregn
- Page 94 and 95: 61 Tabell 85. Realkapital ved utgan
- Page 96 and 97: 63 Tabell 89. Husdyr Livestock År
- Page 98 and 99: Holdings cultivating various crops.
- Page 100 and 101: 67 Fruit trees and berry-bearing sh
- Page 102 and 103: 69 Holdings by livestock of differe
- Page 104 and 105:
71 Tabell 96. Leide bruk etter leie
- Page 106 and 107:
73 Tabell 98. Mannlige brukere og m
- Page 108 and 109:
75 Tabell 100. Utført arbeid på o
- Page 110 and 111:
Farm buildings. Ensilage. Holdings
- Page 112 and 113:
79 Agricultural area by county. 197
- Page 114 and 115:
8 1 Livestock by county. 20 June 19
- Page 116 and 117:
83 Tabell 107. Avling i jordbruket.
- Page 118 and 119:
85 Ar Year I alt Total Tabell 110.
- Page 120 and 121:
87 Tabell 114. Jordbrukets totalreg
- Page 122 and 123:
S9 Tabell 116. Bøndenes inntekt, f
- Page 124 and 125:
91 Tabell 119. Priser på faste eie
- Page 126 and 127:
93 Tabell 122. Skogeiendommers land
- Page 128 and 129:
95 Tabell 125. Skogtaksering. Produ
- Page 130 and 131:
97 Tabell 128. Skogavgift.' 1000 kr
- Page 132 and 133:
99 Ar og fylke m .v. Year and count
- Page 134 and 135:
101 År Year Tabell 137. Utbytte av
- Page 136 and 137:
103 Landings and landed value of fi
- Page 138 and 139:
105 Az Year 1966... 1967... 1968...
- Page 140 and 141:
107 1953 1954 1955 1956 1957 1958 1
- Page 142 and 143:
1 09 Tabell 150. Bruken av fangsten
- Page 144 and 145:
Tabell 154. Bergverksdrift og indus
- Page 146 and 147:
113 Mining and manufacturing by maj
- Page 148 and 149:
115 Tabell 158. Bergverksdrift og i
- Page 150 and 151:
117 Tabell 158 (forts.). Bergverksd
- Page 152 and 153:
119 Tabell 158 (forts.). Bergverksd
- Page 154 and 155:
121 Tabell 160. Aft produksjonsinde
- Page 156 and 157:
123 Tabell 162. Månedlig produksjo
- Page 158 and 159:
125 Tabell 166. Vannkraft etter fyl
- Page 160 and 161:
127 Tabell 170. Elektrisitetsforsyn
- Page 162 and 163:
129 Tabell 173. Bygge- og anleggsvi
- Page 164 and 165:
131 År Year Tabell 177. Innførsel
- Page 166 and 167:
133 Tabell 178 (forts.). Innførsel
- Page 168 and 169:
1 35 Tabell 178 (forts.). Innforsel
- Page 170 and 171:
137 Tabell 178 (forts.). Innførsel
- Page 172 and 173:
139 Vare Commodity 22. Oljefrø, -n
- Page 174 and 175:
141 Tabell 179 (forts.). Utførsel
- Page 176 and 177:
143 Tabell 180. Indekser for utenri
- Page 178 and 179:
145 Tabell 181. Innførsel til kons
- Page 180 and 181:
147 Tabell 181 (forts.). Innførsel
- Page 182 and 183:
140 Tabell 182. Innforsels- og utfo
- Page 184 and 185:
151 Tabell 183 (forts.). Innforsels
- Page 186 and 187:
- 153 Tabell 183 (forts.). Innforse
- Page 188 and 189:
155 Imports and exports by principa
- Page 190 and 191:
157 Imports and exports by principa
- Page 192 and 193:
159 Imports and exports by principa
- Page 194 and 195:
Fylke County I alt Total Østfold A
- Page 196 and 197:
163 Tabell 189. Forbrukssamvirket'
- Page 198 and 199:
1 65 Tabell 191. Lager av viktigere
- Page 200 and 201:
167 Ved utgangen av året At the en
- Page 202 and 203:
1 69 Tabell 199. Handelsflåten' et
- Page 204 and 205:
171 ir Year Tabell 202. Opptjente b
- Page 206 and 207:
1 73 Tabell 207. Skipsfarten mellom
- Page 208 and 209:
1 75 Tabell 208 (forts.). Norske sk
- Page 210 and 211:
177 Tabell 208 (forts.). Norske ski
- Page 212 and 213:
179 ...._. Tabell 211. Statsbanene:
- Page 214 and 215:
181 Tabell 216. Statsbanenes bildri
- Page 216 and 217:
183 Tabell 220. Motorkjøretøyer o
- Page 218 and 219:
185 Tabell 224. Nye førerkort og f
- Page 220 and 221:
187 Tabell 227. Veitrafikkulykker m
- Page 222 and 223:
189 Tabell 230. Veitrafikkulykker h
- Page 224 and 225:
191 Tabell 234. Hotelier." 1.970 Ho
- Page 226 and 227:
193 Tabell 238. Poststpder, syssels
- Page 228 and 229:
195 Tabell 242. Televerket. Stasjon
- Page 230 and 231:
197 Tabell 246. Televerkets driftsr
- Page 232 and 233:
199 Tabell 251. Radio og fjernsyn,
- Page 234 and 235:
201 Tabell 254. Den ordinære kommu
- Page 236 and 237:
Skatter Taxes 203 Tabell 256. Etter
- Page 238 and 239:
205 Tabell 258 (forts.). Forskottsp
- Page 240 and 241:
207 Tabell 259 (forts.). Personlige
- Page 242 and 243:
209 Tabell 260 (forts.). Personlige
- Page 244 and 245:
211 Tabell 262. Kommunenes kontantb
- Page 246 and 247:
213 Tabell 263 (forts.). Kommunenes
- Page 248 and 249:
215 Net expenditure and tax revenue
- Page 250 and 251:
2 1 7 Central government balance sh
- Page 252 and 253:
219 Tabell 266 (forts.). Stat8gjeld
- Page 254 and 255:
221 Tabell 267 (forts.). Statskasse
- Page 256 and 257:
223 Tabell 267 (forts.). Statskasse
- Page 258 and 259:
- 225 Tabell 267 (forts.). Statskas
- Page 260 and 261:
227 Tabell 267 (forts.). Statskasse
- Page 262 and 263:
229 Tabell 270. Trygdeforvaltningen
- Page 264 and 265:
231 Tabell 273. Norges Bank. Balans
- Page 266 and 267:
233 Tabell 276. Statsbanker. Balans
- Page 268 and 269:
235 Tabell 279. Forretningsbanker.
- Page 270 and 271:
Banker ved årets utgang Banks at e
- Page 272 and 273:
239 - Tabell 285. Forretnings- og s
- Page 274 and 275:
241 Tabell 287. Innskott i banker o
- Page 276 and 277:
243 Tabell 289. Private finansierin
- Page 278 and 279:
Forsikringsart Type of insurance 24
- Page 280 and 281:
— 247 Tabell 296. Branner og bran
- Page 282 and 283:
249 Tabell 300. Ihendehaverobligasj
- Page 284 and 285:
251 Tabell 302. Øking i kjent kapi
- Page 286 and 287:
253 Loans by industry.' 31 December
- Page 288 and 289:
255 Foreign a88et8 and liabilitie8.
- Page 290 and 291:
257 Credit market. Financial balanc
- Page 292 and 293:
259 Credit market. Financial balanc
- Page 294 and 295:
261 Tabell 310. Aksjekursindeks.' K
- Page 296 and 297:
263 Driftsår Felling season Tabell
- Page 298 and 299:
i 265 Tabell 320. Engrosprisindeks'
- Page 300 and 301:
267 Tabell 324. Detaljpriser på vi
- Page 302 and 303:
269 Tabell 326. Utgift til 9 vare-
- Page 304 and 305:
271 Tabell 329. Gjennomsnittsfortje
- Page 306 and 307:
273 Tabell 330 (forts.). Timefortje
- Page 308 and 309:
275 Tabell 331. Timefortjeneste i N
- Page 310 and 311:
277 Tabell 335. Månedsfortjeneste
- Page 312 and 313:
279 Tabell 337. Månedsfortjeneste
- Page 314 and 315:
Kjonn Sex Forsikringsselskapenes st
- Page 316 and 317:
283 Tabell 342. Syketrygden. Utgift
- Page 318 and 319:
285 Tabell 344. Syketrygden. Erstat
- Page 320 and 321:
........ 287 Tabell 347. Folketrygd
- Page 322 and 323:
Hele landet The whole country 289 T
- Page 324 and 325:
291 Tabell 355. Yrkesskadetrygden.
- Page 326 and 327:
293 Tabell 357. Sosialhjelp Social
- Page 328 and 329:
295 Tabell 360. Daginstitusjoner fo
- Page 330 and 331:
297 Tabell 366. Edruskapsnemndene.
- Page 332 and 333:
Lovbrudd Off e nee 299 Tabell 372.
- Page 334 and 335:
301 Tabell 376. Alkohollovforseelse
- Page 336 and 337:
1 Anstalter/Reaksjoner Institutions
- Page 338 and 339:
305 Tabell 385. Apnede konkurser og
- Page 340 and 341:
307 Skole og Ar School and year Tab
- Page 342 and 343:
309 Klassetrinn Grade 1. klassetrin
- Page 344 and 345:
311 Tabell 398. Fag- og yrkesskoler
- Page 346 and 347:
Fag Profession 313 Tabell 401. Sven
- Page 348 and 349:
315 Tabell 403. Universiteter og ho
- Page 350 and 351:
317 Tabell 405. Utgifter til norsk
- Page 352 and 353:
319 Tabell 409. Utgifter til forskn
- Page 354 and 355:
321 Tabell 412. Spesialbibliotek 19
- Page 356 and 357:
323 Tabell 412 (forts.). Spesialbib
- Page 358 and 359:
År Year 325 Tabell 416. Utgitte sk
- Page 360 and 361:
Fylke County Bykomm. Urban municip
- Page 362 and 363:
329 Tabell 424. Stortingsvalg. Pers
- Page 364 and 365:
331 Tabell 426. Personer som ikke s
- Page 366 and 367:
333 etter fylke Municipal elections
- Page 368 and 369:
335 Municipal elections. Votes and
- Page 370 and 371:
337 INTERNASJONALE OVERSIKTER Tabel
- Page 372 and 373:
339 Tabell 432 (forts.). Areal, fol
- Page 374 and 375:
341 Tabell 432 (forts.). Areal, fol
- Page 376 and 377:
343 Ar Land og byer log dag Europa
- Page 378 and 379:
345 Land og byer Tabell 433 (forts.
- Page 380 and 381:
347 Tabell 434 (forts.). Folkemengd
- Page 382 and 383:
349 Tabell 435. Yrkesbefolkningen e
- Page 384 and 385:
351 Tabell 436 (forts.). Giftermål
- Page 386 and 387:
353 Tabell 438. Middellevetideni La
- Page 388 and 389:
355 etter kjønn og alder 85-89 år
- Page 390 and 391:
357 etter kjønn og alder 33-39 i 4
- Page 392 and 393:
359 innbyggere etter dødsårsak Ne
- Page 394 and 395:
361 Tabell 442. Netto og brutto nas
- Page 396 and 397:
363 ... Tabell 444. Husdyrholdet 19
- Page 398 and 399:
365 bruksareal og avling. 1969 bruk
- Page 400 and 401:
367 Land ir I alt Tabell 446 (forts
- Page 402 and 403:
369 Tabell 449. Produksjon av noen
- Page 404 and 405:
371 Tabell 449 (forts.). Produksjon
- Page 406 and 407:
373 Tabell 449 (forts.). Produksjon
- Page 408 and 409:
375 Tabell 449 (forts.). Produksjon
- Page 410 and 411:
377 Tabell 449 (forts.). Produksjon
- Page 412 and 413:
379 Tabell 452. Verdien av utenriks
- Page 414 and 415:
381 lands innforsel, etter land.' M
- Page 416 and 417:
383 Varesort og land K jott 2 . (01
- Page 418 and 419:
385 Tabell 457 (forts.). Innførsel
- Page 420 and 421:
387 Tabell 457 (forts.). Innforsel
- Page 422 and 423:
14. 389 Tabell 457 (forts.). Innfø
- Page 424 and 425:
1 391 Tabell 459. Registrerte skip
- Page 426 and 427:
:393 Norge2 Danmark' Finland Sverig
- Page 428 and 429:
395 Tabell 464. Automobiler' 1967 1
- Page 430 and 431:
397 Tabell 466. Personer innreist t
- Page 432 and 433:
399 Tabell 469. Postvesenet' Land 1
- Page 434 and 435:
Land Norge (81/12): Innenlandsk jFa
- Page 436 and 437:
Land I it; 403 Tabell 473. Dollarku
- Page 438 and 439:
405 Tabell 477. Konsumprisindeks. 1
- Page 440 and 441:
407 Tabell 479. Forbruket av avispa
- Page 442 and 443:
409 Tabell 481. Offentlige utgifter
- Page 444 and 445:
411 1,411(1 Tabell 483. Kringkastin
- Page 446 and 447:
413 Vedlegg 1 Appendix 1 Publikasjo
- Page 448 and 449:
415 Rekke A Offsettrykk 1971 (forts
- Page 450 and 451:
Andre publikasjoner Veiviser i nors