Estudo da qualidade do ar numa estação de Braga (Circular Sul) e ...
Estudo da qualidade do ar numa estação de Braga (Circular Sul) e ...
Estudo da qualidade do ar numa estação de Braga (Circular Sul) e ...

You also want an ePaper? Increase the reach of your titles
YUMPU automatically turns print PDFs into web optimized ePapers that Google loves.
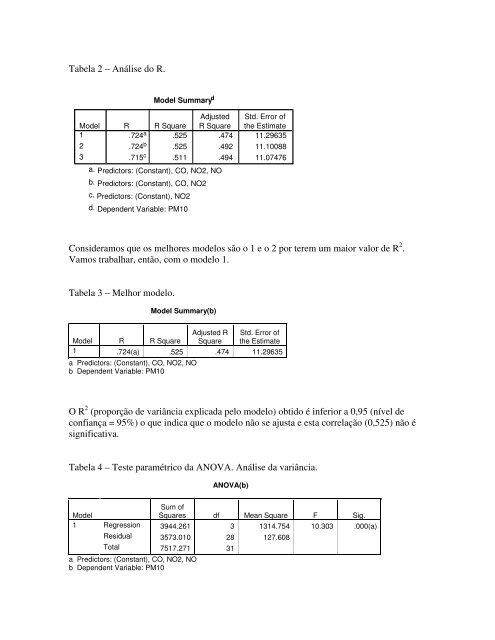
Tabela 2 – Análise <strong>do</strong> R.<br />
Mo<strong>de</strong>l<br />
1<br />
2<br />
3<br />
Mo<strong>de</strong>l Summ<strong>ar</strong>y d<br />
.724a Adjusted Std. Error of<br />
R R Squ<strong>ar</strong>e R Squ<strong>ar</strong>e the Estimate<br />
.525 .474 11.29635<br />
.724 b .525 .492 11.10088<br />
.715 c .511 .494 11.07476<br />
a. Predictors: (Constant), CO, NO2, NO<br />
b. Predictors: (Constant), CO, NO2<br />
c. Predictors: (Constant), NO2<br />
d. Depen<strong>de</strong>nt V<strong>ar</strong>iable: PM10<br />
Consi<strong>de</strong>ramos que os melhores mo<strong>de</strong>los são o 1 e o 2 por terem um maior valor <strong>de</strong> R 2 .<br />
Vamos trabalh<strong>ar</strong>, então, com o mo<strong>de</strong>lo 1.<br />
Tabela 3 – Melhor mo<strong>de</strong>lo.<br />
Mo<strong>de</strong>l Summ<strong>ar</strong>y(b)<br />
Adjusted R Std. Error of<br />
Mo<strong>de</strong>l R R Squ<strong>ar</strong>e Squ<strong>ar</strong>e the Estimate<br />
1 .724(a) .525 .474 11.29635<br />
a Predictors: (Constant), CO, NO2, NO<br />
b Depen<strong>de</strong>nt V<strong>ar</strong>iable: PM10<br />
O R 2 (proporção <strong>de</strong> v<strong>ar</strong>iância explica<strong>da</strong> pelo mo<strong>de</strong>lo) obti<strong>do</strong> é inferior a 0,95 (nível <strong>de</strong><br />
confiança = 95%) o que indica que o mo<strong>de</strong>lo não se ajusta e esta correlação (0,525) não é<br />
significativa.<br />
Tabela 4 – Teste p<strong>ar</strong>amétrico <strong>da</strong> ANOVA. Análise <strong>da</strong> v<strong>ar</strong>iância.<br />
Mo<strong>de</strong>l<br />
1<br />
ANOVA(b)<br />
Sum of<br />
Squ<strong>ar</strong>es df Mean Squ<strong>ar</strong>e F Sig.<br />
Regression 3944.261 3 1314.754 10.303 .000(a)<br />
Residual 3573.010 28 127.608<br />
Total 7517.271 31<br />
a Predictors: (Constant), CO, NO2, NO<br />
b Depen<strong>de</strong>nt V<strong>ar</strong>iable: PM10