Índice | Index - Grupo CCR
Índice | Index - Grupo CCR
Índice | Index - Grupo CCR

You also want an ePaper? Increase the reach of your titles
YUMPU automatically turns print PDFs into web optimized ePapers that Google loves.
Relatório Social 2005 Social Report<br />
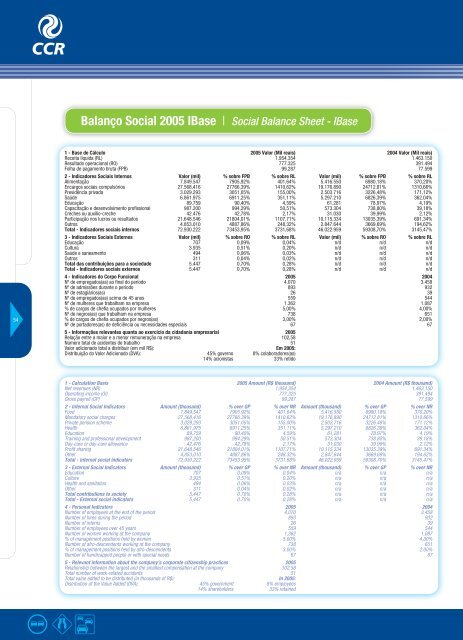
Balanço Social 2005 IBase | Social Balance Sheet - IBase<br />
54<br />
1 - Base de Cálculo 2005 Valor (Mil reais) 2004 Valor (Mil reais)<br />
Receita líquida (RL) 1.954.354 1.463.150<br />
Resultado operacional (RO) 777.325 391.494<br />
Folha de pagamento bruta (FPB) 99.287 77.599<br />
2 - Indicadores Sociais Internos Valor (mil) % sobre FPB % sobre RL Valor (mil) % sobre FPB % sobre RL<br />
Alimentação 7.849.547 7905,92% 401,64% 5.416.550 6980,18% 370,20%<br />
Encargos sociais compulsórios 27.568.416 27766,39% 1410,62% 19.176.890 24712,81% 1310,66%<br />
Previdência privada 3.029.293 3051,05% 155,00% 2.503.716 3226,48% 171,12%<br />
Saúde 6.861.975 6911,25% 351,11% 5.297.210 6826,39% 362,04%<br />
Educação 89.759 90,40% 4,59% 61.281 78,97% 4,19%<br />
Capacitação e desenvolvimento profi ssional 987.200 994,29% 50,51% 573.304 738,80% 39,18%<br />
Creches ou auxílio-creche 42.476 42,78% 2,17% 31.030 39,99% 2,12%<br />
Participação nos lucros ou resultados 21.648.546 21804,01% 1107,71% 10.115.334 13035,39% 691,34%<br />
Outros 4.853.010 4887,86% 248,32% 2.847.644 3669,69% 194,62%<br />
Total - Indicadores sociais internos 72.930.222 73453,95% 3731,68% 46.022.959 59308,70% 3145,47%<br />
3 - Indicadores Sociais Externos Valor (mil) % sobre RO % sobre RL Valor (mil) % sobre RO % sobre RL<br />
Educação 707 0,09% 0,04% n/d n/d n/d<br />
Cultura 3.935 0,51% 0,20% n/d n/d n/d<br />
Saúde e saneamento 494 0,06% 0,03% n/d n/d n/d<br />
Outros 311 0,04% 0,02% n/d n/d n/d<br />
Total das contribuições para a sociedade 5.447 0,70% 0,28% n/d n/d n/d<br />
Total - Indicadores sociais externos 5.447 0,70% 0,28% n/d n/d n/d<br />
4 - Indicadores do Corpo Funcional 2005 2004<br />
Nº de empregados(as) ao fi nal do período 4.070 3.458<br />
Nº de admissões durante o período 893 932<br />
Nº de estagiários(as) 26 39<br />
Nº de empregados(as) acima de 45 anos 559 544<br />
Nº de mulheres que trabalham na empresa 1.362 1.087<br />
% de cargos de chefi a ocupados por mulheres 5,00% 4,00%<br />
Nº de negros(as) que trabalham na empresa 738 651<br />
% de cargos de chefi a ocupados por negros(as) 3,00% 2,00%<br />
Nº de portadores(as) de defi ciência ou necessidades especiais 67 67<br />
5 - Informações relevantes quanto ao exercício da cidadania empresarial 2005<br />
Relação entre a maior e a menor remuneração na empresa 102,58<br />
Número total de acidentes de trabalho 51<br />
Valor adicionado total a distribuir (em mil R$): Em 2005:<br />
Distribuição do Valor Adicionado (DVA): 45% governo 8% colaboradores(as)<br />
14% acionistas 33% retido<br />
55<br />
1 - Calculation Basis 2005 Amount (R$ thousand) 2004 Amount (R$ thousand)<br />
Net revenues (NR) 1,954,354 1,463,150<br />
Operating income (OI) 777,325 391,494<br />
Gross payroll (GP) 99,287 77,599<br />
2 - Internal Social Indicators Amount (thousand) % over GP % over NR Amount (thousand) % over GP % over NR<br />
Food 7,849,547 7905.92% 401.64% 5,416,550 6980.18% 370.20%<br />
Mandatory social charges 27,568,416 27766.39% 1410.62% 19,176,890 24712.81% 1310.66%<br />
Private pension scheme 3,029,293 3051.05% 155.00% 2,503,716 3226.48% 171.12%<br />
Health 6,861,975 6911.25% 351.11% 5,297,210 6826.39% 362.04%<br />
Education 89,759 90.40% 4.59% 61,281 78.97% 4.19%<br />
Training and professional development 987,200 994.29% 50.51% 573,304 738.80% 39.18%<br />
Day-care or day-care allowance 42,476 42.78% 2.17% 31,030 39.99% 2.12%<br />
Profi t sharing 21,648,546 21804.01% 1107.71% 10,115,334 13035.39% 691.34%<br />
Other 4,853,010 4887.86% 248.32% 2,847,644 3669.69% 194.62%<br />
Total - Internal social indicators 72,930,222 73453.95% 3731.68% 46,022,959 59308.70% 3145.47%<br />
3 - External Social Indicators Amount (thousand) % over GP % over NR Amount (thousand) % over GP % over NR<br />
Education 707 0.09% 0.04% n/a n/a n/a<br />
Culture 3,935 0.51% 0.20% n/a n/a n/a<br />
Health and sanitation 494 0.06% 0.03% n/a n/a n/a<br />
Other 311 0.04% 0.02% n/a n/a n/a<br />
Total contributions to society 5,447 0.70% 0.28% n/a n/a n/a<br />
Total - External social indicators 5,447 0.70% 0.28% n/a n/a n/a<br />
4 - Personal Indicators 2005 2004<br />
Number of employees at the end of the period 4,070 3,458<br />
Number of hires during the period 893 932<br />
Number of interns 26 39<br />
Number of employees over 45 years 559 544<br />
Number of women working at the company 1,362 1,087<br />
% of management positions held by women 5.00% 4.00%<br />
Number of afro-descendents working at the company 738 651<br />
% of management positions held by afro-descendents 3.00% 2.00%<br />
Number of handicapped people or with special needs 67 67<br />
5 - Relevant information about the company’s corporate citizenship practices 2005<br />
Relationship between the largest and the smallest compensation at the company 102.58<br />
Total number of work-related accidents 51<br />
Total value added to be distributed (in thousands of R$): In 2005:<br />
Distribution of the Value Added (DVA): 45% government 8% employees<br />
14% shareholders 33% retained<br />
Tenda do projeto Cine Tela Brasil - Cine Tela Brasil Project tent