Mapa do analfabetismo no Brasil - Prefeitura Municipal de Barra ...
Mapa do analfabetismo no Brasil - Prefeitura Municipal de Barra ...
Mapa do analfabetismo no Brasil - Prefeitura Municipal de Barra ...

Create successful ePaper yourself
Turn your PDF publications into a flip-book with our unique Google optimized e-Paper software.
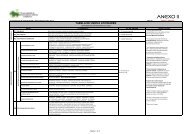
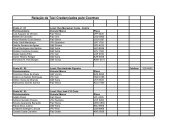
Tabela 1.B – Caracterização educacional da unida<strong>de</strong> da Fe<strong>de</strong>ração - 1998<br />
Analfabetismo<br />
(Números absolutos em 1.000)<br />
Unida<strong>de</strong> da<br />
Fe<strong>de</strong>ração<br />
População<br />
resi<strong>de</strong>nte <strong>de</strong> 15<br />
a<strong>no</strong>s ou mais<br />
População Analfabeta<br />
Analfabetos funcionais <strong>de</strong> 15 a<strong>no</strong>s ou<br />
mais (1)<br />
15 a<strong>no</strong>s ou mais 15 a 19 a<strong>no</strong>s 60 a<strong>no</strong>s ou mais Total Taxa<br />
<strong>Brasil</strong> 110.723 15.261 808 4.998 33.807 30,5<br />
Norte 5.024 634 29 192 1.591 31,7<br />
Rondônia 542 41 1 12 124 22,9<br />
Acre 218 31 1 10 59 27,1<br />
Amazonas 1.192 101 3 40 321 26,9<br />
Roraima 121 10 - 3 28 23,3<br />
Pará 2.004 273 17 79 682 34,0<br />
Amapá 236 22 1 8 58 24,6<br />
Tocantins 711 156 6 41 318 44,8<br />
Nor<strong>de</strong>ste 30.151 8.286 624 2.249 14.410 47,8<br />
Maranhão 3.274 971 69 280 1.736 53,0<br />
Piauí 1.779 608 50 155 981 55,2<br />
Ceará 4.522 1.336 90 362 2.194 48,5<br />
R. G. <strong>do</strong> Norte 1.758 468 42 121 751 42,7<br />
Paraíba 2.259 648 47 189 1.034 45,8<br />
Pernambuco 5.120 1.249 84 351 2.095 40,9<br />
Alagoas 1.767 613 70 138 887 50,2<br />
Sergipe 1.125 270 19 66 482 42,9<br />
Bahia 8.547 2.124 153 588 4.250 49,7<br />
Su<strong>de</strong>ste 50.535 4.084 96 1.718 11.688 23,1<br />
Minas Gerais 11.965 1.503 46 614 3.684 30,8<br />
Espírito Santo 1.999 240 6 83 565 28,3<br />
Rio <strong>de</strong> Janeiro 10.330 613 16 239 2.162 20,9<br />
São Paulo 26.241 1.728 27 782 5.276 20,1<br />
Sul 17.310 1.401 32 560 4.015 23,2<br />
Paraná 6.530 680 17 254 1.845 28,3<br />
Santa Catarina 3.554 229 1 96 712 20,0<br />
R. G. <strong>do</strong> Sul 7.226 493 15 210 1.457 20,2<br />
Centro-Oeste 7.702 854 27 278 2.104 27,3<br />
M. G. <strong>do</strong> Sul 1.378 163 7 60 397 28,8<br />
Mato Grosso 1.609 181 5 54 478 29,7<br />
Goiás 3.335 434 12 144 1.021 30,6<br />
Distrito Fe<strong>de</strong>ral 1.380 78 2 19 208 15,1<br />
Fonte: IBGE, Pnad 1998.<br />
Nota: Exclusive população rural <strong>de</strong> Rondônia, Acre, Amazonas, Roraima, Pará e Amapá.<br />
(1) São consi<strong>de</strong>ra<strong>do</strong>s analfabetos funcionais aqueles com me<strong>no</strong>s <strong>de</strong> quatro a<strong>no</strong>s <strong>de</strong> estu<strong>do</strong>.<br />
16