Mapa do analfabetismo no Brasil - Prefeitura Municipal de Barra ...
Mapa do analfabetismo no Brasil - Prefeitura Municipal de Barra ...
Mapa do analfabetismo no Brasil - Prefeitura Municipal de Barra ...

Create successful ePaper yourself
Turn your PDF publications into a flip-book with our unique Google optimized e-Paper software.
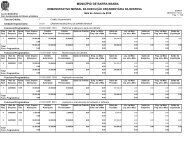
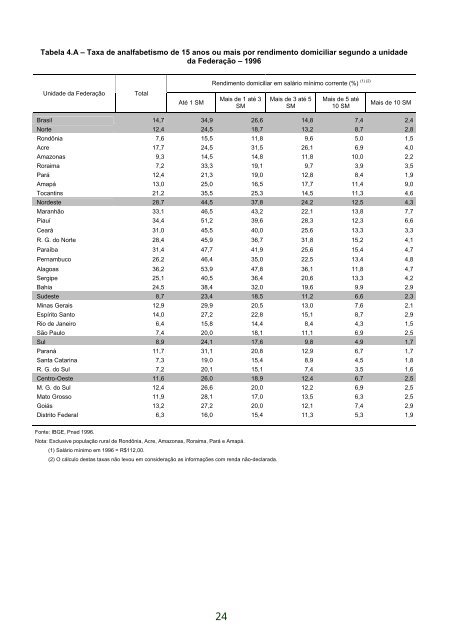
Tabela 4.A – Taxa <strong>de</strong> <strong>analfabetismo</strong> <strong>de</strong> 15 a<strong>no</strong>s ou mais por rendimento <strong>do</strong>miciliar segun<strong>do</strong> a unida<strong>de</strong><br />
da Fe<strong>de</strong>ração – 1996<br />
(1) (2)<br />
Rendimento <strong>do</strong>miciliar em salário mínimo corrente (%)<br />
Unida<strong>de</strong> da Fe<strong>de</strong>ração<br />
Total<br />
Até 1 SM<br />
Mais <strong>de</strong> 1 até 3<br />
SM<br />
Mais <strong>de</strong> 3 até 5<br />
SM<br />
Mais <strong>de</strong> 5 até<br />
10 SM<br />
Mais <strong>de</strong> 10 SM<br />
<strong>Brasil</strong> 14,7 34,9 26,6 14,8 7,4 2,4<br />
Norte 12,4 24,5 18,7 13,2 8,7 2,8<br />
Rondônia 7,6 15,5 11,8 9,6 5,0 1,5<br />
Acre 17,7 24,5 31,5 26,1 6,9 4,0<br />
Amazonas 9,3 14,5 14,8 11,8 10,0 2,2<br />
Roraima 7,2 33,3 19,1 9,7 3,9 3,5<br />
Pará 12,4 21,3 19,0 12,8 8,4 1,9<br />
Amapá 13,0 25,0 16,5 17,7 11,4 9,0<br />
Tocantins 21,2 35,5 25,3 14,5 11,3 4,6<br />
Nor<strong>de</strong>ste 28,7 44,5 37,8 24,2 12,5 4,3<br />
Maranhão 33,1 46,5 43,2 22,1 13,8 7,7<br />
Piauí 34,4 51,2 39,6 28,3 12,3 6,6<br />
Ceará 31,0 45,5 40,0 25,6 13,3 3,3<br />
R. G. <strong>do</strong> Norte 28,4 45,9 36,7 31,8 15,2 4,1<br />
Paraíba 31,4 47,7 41,9 25,6 15,4 4,7<br />
Pernambuco 26,2 46,4 35,0 22,5 13,4 4,8<br />
Alagoas 36,2 53,9 47,8 36,1 11,8 4,7<br />
Sergipe 25,1 40,5 36,4 20,6 13,3 4,2<br />
Bahia 24,5 38,4 32,0 19,6 9,9 2,9<br />
Su<strong>de</strong>ste 8,7 23,4 18,5 11,2 6,6 2,3<br />
Minas Gerais 12,9 29,9 20,5 13,0 7,6 2,1<br />
Espírito Santo 14,0 27,2 22,8 15,1 8,7 2,9<br />
Rio <strong>de</strong> Janeiro 6,4 15,8 14,4 8,4 4,3 1,5<br />
São Paulo 7,4 20,0 18,1 11,1 6,9 2,5<br />
Sul 8,9 24,1 17,6 9,8 4,9 1,7<br />
Paraná 11,7 31,1 20,8 12,9 6,7 1,7<br />
Santa Catarina 7,3 19,0 15,4 8,9 4,5 1,8<br />
R. G. <strong>do</strong> Sul 7,2 20,1 15,1 7,4 3,5 1,6<br />
Centro-Oeste 11,6 26,0 18,9 12,4 6,7 2,5<br />
M. G. <strong>do</strong> Sul 12,4 26,6 20,0 12,2 6,9 2,5<br />
Mato Grosso 11,9 28,1 17,0 13,5 6,3 2,5<br />
Goiás 13,2 27,2 20,0 12,1 7,4 2,9<br />
Distrito Fe<strong>de</strong>ral 6,3 16,0 15,4 11,3 5,3 1,9<br />
Fonte: IBGE, Pnad 1996.<br />
Nota: Exclusive população rural <strong>de</strong> Rondônia, Acre, Amazonas, Roraima, Pará e Amapá.<br />
(1) Salário mínimo em 1996 = R$112,00.<br />
(2) O cálculo <strong>de</strong>stas taxas não levou em consi<strong>de</strong>ração as informações com renda não-<strong>de</strong>clarada.<br />
24