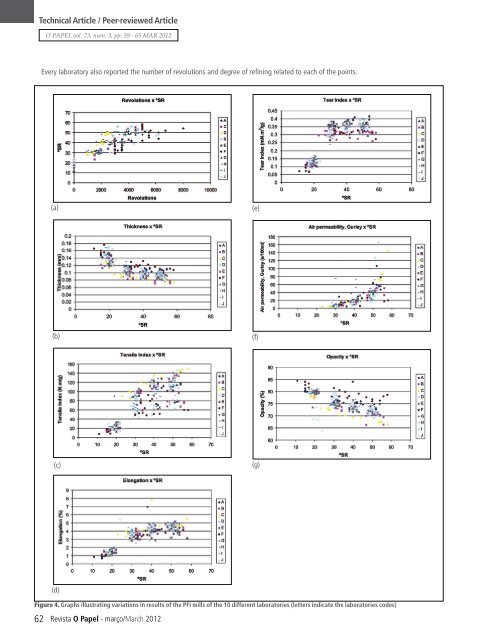
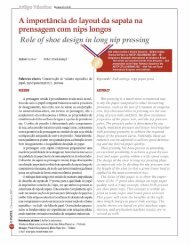
Technical Article / Peer-reviewed Article O PAPEL vol. 73, num. 3, pp. 59 - 65 MAR 2012 Every laboratory also reported the number of revolutions and degree of refining related to each of the points. (a) (e) (b) (f) (c) (g) (d) Figure 4. Graphs illustrating variations in results of the PFI mills of the 10 different laboratories (letters indicate the laboratories codes) 62 <strong>Revista</strong> O <strong>Papel</strong> - março/March 2012
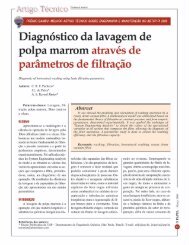
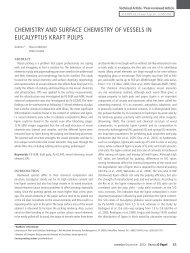
Technical Article / Peer-reviewed Article O PAPEL vol. 73, num. 3, pp. 59 - 65 MAR 2012 Tear strength Tear strength PC2 Burst strength PC2 Tensile strength Burst strength Tensile strength Air permeance (a) 20 o SR (b) 30 o SR Tear strength Burst strength Air permeance Burst strength Tensile strength PC2 Tensile strength PC2 Tear strength Air permeance (c) 40 o SR (d) 50 o SR Figure 5. Loading plots for each ºSR group Multivariate analysis for extraction of information using principal components is not that simple when considering the refining in a PFI mill. To investigate this complexity, the interlaboratorial data were analyzed. For this analysis, data were grouped into four groups. For each of the set of points, named groups 0, 1, 2 and 3, the PCA analysis was performed. Group 0 denotes the set of values around 20 °SR, group 1 indicates 30 ºSR, group 2 indicates 40 °SR and, finally, group 3 indicates 50 °SR. The graphs show the relationship of each physical property with the principal components (in this case, the first and second components). Thus, it is expected that properties with similar behaviors are to be placed in the same quadrant. For group 0 there are no values for the Gurley air permeance, since for unrefined pulp the equipment scale is not sensible enough to allow any air resistance measurement. The treatment for three variables: tear, tensile and burst strengths can be seen in Figure 5. Figure 5a shows the loadings, i.e., the positions of tear, tensile and burst strength variables. Here, these properties remain on the same side of the first component axis, but for the second component tensile and burst are on opposite sides. In Figure 5b it is to note that with the 30 °SR refining, tensile and bursting strength are close, and apart from tear strength, when compared on the axis of the second component. If Figure 5b is compared with Figure 5c, tensile strength is still closer to the Gurley air permeance when compared to the burst index. In Figure 5d the tensile strength shifts to the opposite side of the axis for the first principal component. There is not an immediate explanation, but it is to remember that 50 °SR is an extreme refining condition for hardwood pulp. RESULTS AND DISCUSSION To understand the behavior of physical properties in relation to principal components, the refining curves must be analyzed. This analysis is done with Figure 4. In Figure 4a, as expected, as the number of revolutions increases, the higher are the values of the achieved drainability (°SR). However, it is to note that there is a great variation in number of revolutions required to achieve a given °SR for each laboratory. This variation tends to increase with the increasing of the °SR. This may indicate that the PFI mills of the different laboratories have different characteristics, calibration or bars sharpening. Formento et al. (2003) show, with the obtained results of drainability and refining time, that the drainability is strongly influenced by the generation of fines and, to a lesser extent, by the flexibility and external fibrillation of the fiber. At this point it should be noted that in this study, as per instructions sent to the participating laboratories on the performing of the refining, no specific guidance was proposed about the use of some standard water. Differences between °SR degrees may arise from março/March 2012 - <strong>Revista</strong> O <strong>Papel</strong> 63