Aula 2 Prof. Renato Vicente
Aula 2 Prof. Renato Vicente
Aula 2 Prof. Renato Vicente
- No tags were found...
You also want an ePaper? Increase the reach of your titles
YUMPU automatically turns print PDFs into web optimized ePapers that Google loves.
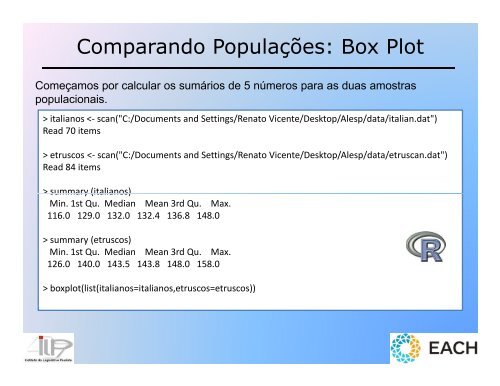
Comparando Populações: Box PlotComeçamos por calcular os sumários de 5 números para as duas amostraspopulacionais.> italianos etruscos summary (italianos)Min. 1st Qu. Median Mean 3rd Qu. Max.116.0 129.0 132.0 132.4 136.8 148.0> summary (etruscos)Min. 1st Qu. Median Mean 3rd Qu. Max.126.0 140.0 143.5 143.8 148.0 158.0> boxplot(list(italianos=italianos,etruscos=etruscos))


