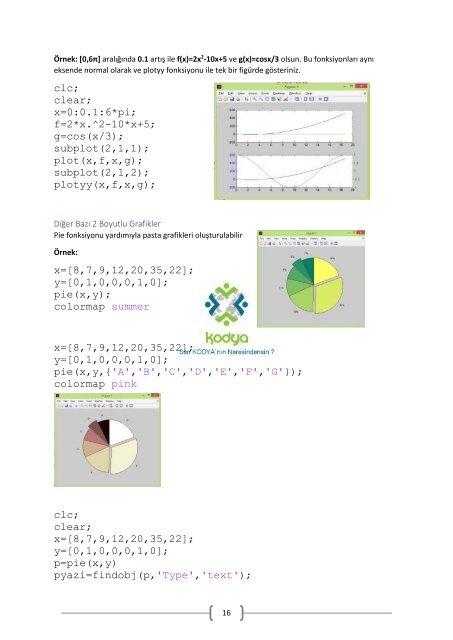
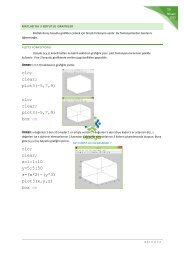
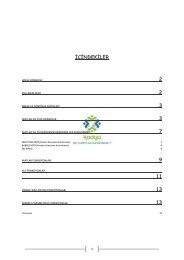
Örnek: [0,6π] aralığında 0.1 artış ile f(x)=2x 2 -10x+5 ve g(x)=cosx/3 olsun. Bu fonksiyonları aynı eksende normal olarak ve plotyy fonksiyonu ile tek bir figürde gösteriniz. clc; clear; x=0:0.1:6*pi; f=2*x.^2-10*x+5; g=cos(x/3); subplot(2,1,1); plot(x,f,x,g); subplot(2,1,2); plotyy(x,f,x,g); Diğer Bazı 2 Boyutlu Grafikler Pie fonksiyonu yardımıyla pasta grafikleri oluşturulabilir Örnek: x=[8,7,9,12,20,35,22]; y=[0,1,0,0,0,1,0]; pie(x,y); colormap summer x=[8,7,9,12,20,35,22]; y=[0,1,0,0,0,1,0]; pie(x,y,{'A','B','C','D','E','F','G'}); colormap pink clc; clear; x=[8,7,9,12,20,35,22]; y=[0,1,0,0,0,1,0]; p=pie(x,y) pyazi=findobj(p,'Type','text'); 16
z=get(pyazi,'String'); m={'A:';'B:';'C:';'D:';'E:';'F:';'G:'}; b=strcat(m,z); set(pyazi,{'String'},b) colormap bone Renk Ayarı: Hsv,hot,gray,bone,copper,pink,white,flag,colorcube,lines,vga,cool,autumn,spring,winter, summer Pie fonksiyonu 3 boyutlu grafikler için olan hali pie3(x,y) komutudur. Bar() ve bar3() komutları çubuk grafikleri çizmek için kullanılır. Benzer şekilde hist(x) komutu ile histogram, stem(x,y) komutu ile dal grafikleri ve stairs(x,y) komutu ile merdiven grafikleri çizilebilir. Kutupsal koordinatlarda verilen bir fonksiyonun grafiğini çizmek için polar komutu kullanılır. Bu komut, t grafiğe ait noktaya karşılık gelen vektörün x ekseni ile yaptığı açıyı ve r de bu vektörün uzunluğunu belirtmek üzere polar (t,r) şeklinde kullanılır. Örnek: t açısı [0,10π] arasında 0.1 artış ile verilmek üzere r1=sint ve r2=tsintcost fonksiyonlarının grafiklerini çiziniz. clc; t=0:0.1:10*pi; r1=sin(t); r2=t.*sin(t).*cos(t); subplot(2,1,1) polar(t,r1) subplot(2,1,2) polar(t,r2) 17
- Page 1 and 2: İÇİNDEKİLER MATLAB`DA DİZİLER
- Page 3 and 4: double fonksiyonu sembolik olarak v
- Page 5 and 6: quad('1./((x+1).^2)',1,2) 1 ∫ ( 2
- Page 7 and 8: ∫ dx x(logx) 2 dx clc; syms x pre
- Page 9 and 10: ÖRNEKLER clc; syms x limit(1/x,x,0
- Page 11 and 12: Matlab`da diferansiyel denklem çö
- Page 13 and 14: Çizgi Stili (LineStyle) Kesintisiz
- Page 15: plot(x,y,'--ro') xlabel(yazi(1,1));
- Page 19 and 20: clc; x=[8,7,9,12,20,35,22]; y=2009:
- Page 21: Örnek: [0,π] aralığında π/6 a