

Table B1.1: Demographics and Geopolitical Divisions ... - Social Watch
Table B1.1: Demographics and Geopolitical Divisions ... - Social Watch
Table B1.1: Demographics and Geopolitical Divisions ... - Social Watch

Create successful ePaper yourself
Turn your PDF publications into a flip-book with our unique Google optimized e-Paper software.
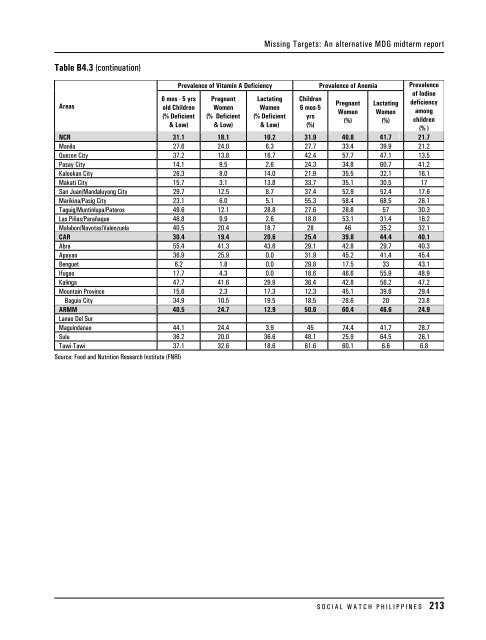
Missing Targets: An alternative MDG midterm report<br />
<strong>Table</strong> B4.3 (continuation)<br />
Areas<br />
Prevalence of Vitamin A Deficiency<br />
6 mos - 5 yrs<br />
old Children<br />
(% Deficient<br />
& Low)<br />
Pregnant<br />
Women<br />
(% Deficient<br />
& Low)<br />
Lactating<br />
Women<br />
(% Deficient<br />
& Low)<br />
Children<br />
6 mos-5<br />
yrs<br />
(%)<br />
Prevalence of Anemia<br />
Pregnant<br />
Women<br />
(%)<br />
Lactating<br />
Women<br />
(%)<br />
Prevalence<br />
of Iodine<br />
deficiency<br />
among<br />
children<br />
(% )<br />
NCR 31.1 18.1 10.2 31.9 40.8 41.7 21.7<br />
Manila 27.6 24.0 6.3 27.7 33.4 39.9 21.2<br />
Quezon City 37.2 13.8 16.7 42.4 57.7 47.1 13.5<br />
Pasay City 14.1 9.5 2.6 24.3 34.8 60.7 41.2<br />
Kalookan City 26.3 8.0 14.0 21.9 35.5 32.1 16.1<br />
Makati City 15.7 3.1 13.8 33.7 35.1 30.5 17<br />
San Juan/M<strong>and</strong>aluyong City 29.7 12.5 8.7 37.4 52.9 52.4 17.6<br />
Marikina/Pasig City 23.1 6.0 5.1 55.3 58.4 68.5 26.1<br />
Taguig/Muntinlupa/Pateros 49.6 12.1 28.8 27.6 28.8 57 30.3<br />
Las Piñas/Parañaque 46.8 9.9 2.6 18.8 53.1 31.4 16.2<br />
Malabon/Navotas/Valenzuela 40.5 20.4 18.7 28 46 35.2 32.1<br />
CAR 30.4 19.4 20.6 25.4 39.8 44.4 40.1<br />
Abra 55.4 41.3 43.6 29.1 42.8 29.7 40.3<br />
Apayao 36.9 25.9 0.0 31.9 45.2 41.4 45.4<br />
Benguet 6.2 1.8 0.0 29.8 17.5 33 43.1<br />
Ifugao 17.7 4.3 0.0 18.6 46.6 55.9 48.9<br />
Kalinga 47.7 41.6 29.9 36.4 42.8 56.2 47.2<br />
Mountain Province 15.6 2.3 17.3 12.3 45.1 39.6 29.4<br />
Baguio City 34.9 10.5 19.5 18.5 28.6 20 23.8<br />
ARMM 40.5 24.7 12.9 50.6 60.4 46.6 24.9<br />
Lanao Del Sur<br />
Maguindanao 44.1 24.4 3.9 45 74.4 41.7 28.7<br />
Sulu 36.2 20.0 36.6 48.1 25.9 64.5 26.1<br />
Tawi-Tawi 37.1 32.6 18.6 61.6 60.1 6.6 6.8<br />
Source: Food <strong>and</strong> Nutrition Research Institute (FNRI)<br />
S O C I A L W A T C H P H I L I P P I N E S 213


