Table B1.1: Demographics and Geopolitical Divisions ... - Social Watch
Table B1.1: Demographics and Geopolitical Divisions ... - Social Watch
Table B1.1: Demographics and Geopolitical Divisions ... - Social Watch
Create successful ePaper yourself
Turn your PDF publications into a flip-book with our unique Google optimized e-Paper software.
Missing Targets: An alternative MDG midterm report<br />
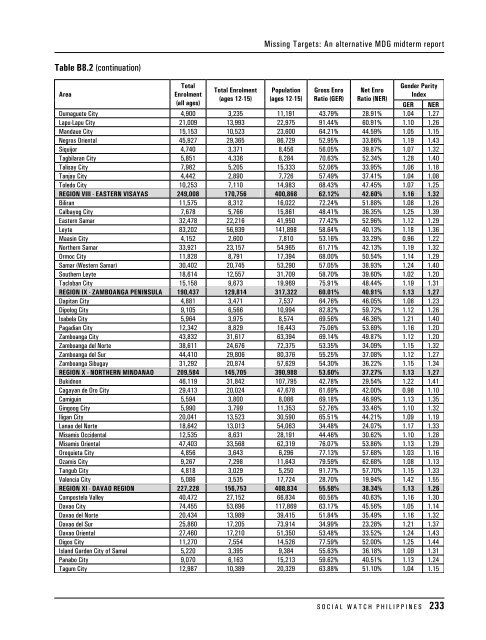
<strong>Table</strong> B8.2 (continuation)<br />
Area<br />
Total<br />
Enrolment<br />
(all ages)<br />
Total Enrolment<br />
(ages 12-15)<br />
Population<br />
(ages 12-15)<br />
Gross Enro<br />
Ratio (GER)<br />
Net Enro<br />
Ratio (NER)<br />
Gender Parity<br />
Index<br />
GER NER<br />
Dumaguete City 4,900 3,235 11,191 43.79% 28.91% 1.04 1.27<br />
Lapu-Lapu City 21,009 13,993 22,975 91.44% 60.91% 1.10 1.26<br />
M<strong>and</strong>aue City 15,153 10,523 23,600 64.21% 44.59% 1.05 1.15<br />
Negros Oriental 45,927 29,365 86,729 52.95% 33.86% 1.19 1.43<br />
Siquijor 4,740 3,371 8,456 56.05% 39.87% 1.07 1.32<br />
Tagbilaran City 5,851 4,336 8,284 70.63% 52.34% 1.28 1.40<br />
Talisay City 7,982 5,205 15,333 52.06% 33.95% 1.06 1.18<br />
Tanjay City 4,442 2,890 7,726 57.49% 37.41% 1.04 1.08<br />
Toledo City 10,253 7,110 14,983 68.43% 47.45% 1.07 1.25<br />
REGION VIII - EASTERN VISAYAS 249,008 170,756 400,868 62.12% 42.60% 1.16 1.32<br />
Biliran 11,575 8,312 16,022 72.24% 51.88% 1.08 1.26<br />
Calbayog City 7,678 5,766 15,861 48.41% 36.35% 1.25 1.39<br />
Eastern Samar 32,478 22,216 41,950 77.42% 52.96% 1.12 1.29<br />
Leyte 83,202 56,939 141,898 58.64% 40.13% 1.18 1.36<br />
Maasin City 4,152 2,600 7,810 53.16% 33.29% 0.96 1.22<br />
Northern Samar 33,921 23,157 54,965 61.71% 42.13% 1.19 1.32<br />
Ormoc City 11,828 8,791 17,394 68.00% 50.54% 1.14 1.29<br />
Samar (Western Samar) 30,402 20,745 53,290 57.05% 38.93% 1.24 1.40<br />
Southern Leyte 18,614 12,557 31,709 58.70% 39.60% 1.02 1.20<br />
Tacloban City 15,158 9,673 19,969 75.91% 48.44% 1.19 1.31<br />
REGION IX - ZAMBOANGA PENINSULA 190,437 129,814 317,322 60.01% 40.91% 1.13 1.27<br />
Dapitan City 4,881 3,471 7,537 64.76% 46.05% 1.08 1.23<br />
Dipolog City 9,105 6,566 10,994 82.82% 59.72% 1.12 1.26<br />
Isabela City 5,964 3,975 8,574 69.56% 46.36% 1.21 1.40<br />
Pagadian City 12,342 8,829 16,443 75.06% 53.69% 1.16 1.20<br />
Zamboanga City 43,832 31,617 63,394 69.14% 49.87% 1.12 1.20<br />
Zamboanga del Norte 38,611 24,676 72,375 53.35% 34.09% 1.15 1.32<br />
Zamboanga del Sur 44,410 29,806 80,376 55.25% 37.08% 1.12 1.27<br />
Zamboanga Sibugay 31,292 20,874 57,629 54.30% 36.22% 1.15 1.34<br />
REGION X - NORTHERN MINDANAO 209,584 145,705 390,988 53.60% 37.27% 1.13 1.27<br />
Bukidnon 46,119 31,842 107,795 42.78% 29.54% 1.22 1.41<br />
Cagayan de Oro City 29,413 20,024 47,678 61.69% 42.00% 0.98 1.10<br />
Camiguin 5,594 3,800 8,086 69.18% 46.99% 1.13 1.35<br />
Gingoog City 5,990 3,799 11,353 52.76% 33.46% 1.10 1.32<br />
Iligan City 20,041 13,523 30,590 65.51% 44.21% 1.09 1.19<br />
Lanao del Norte 18,642 13,013 54,063 34.48% 24.07% 1.17 1.33<br />
Misamis Occidental 12,535 8,631 28,191 44.46% 30.62% 1.10 1.28<br />
Misamis Oriental 47,403 33,568 62,319 76.07% 53.86% 1.13 1.29<br />
Oroquieta City 4,856 3,643 6,296 77.13% 57.68% 1.03 1.16<br />
Ozamis City 9,267 7,298 11,643 79.59% 62.68% 1.08 1.13<br />
Tangub City 4,818 3,029 5,250 91.77% 57.70% 1.15 1.33<br />
Valencia City 5,086 3,535 17,724 28.70% 19.94% 1.42 1.55<br />
REGION XI - DAVAO REGION 227,228 156,753 408,834 55.58% 38.34% 1.13 1.26<br />
Compostela Valley 40,472 27,152 66,834 60.56% 40.63% 1.16 1.30<br />
Davao City 74,455 53,696 117,869 63.17% 45.56% 1.05 1.14<br />
Davao del Norte 20,434 13,989 39,415 51.84% 35.49% 1.16 1.32<br />
Davao del Sur 25,860 17,205 73,914 34.99% 23.28% 1.21 1.37<br />
Davao Oriental 27,460 17,210 51,350 53.48% 33.52% 1.24 1.43<br />
Digos City 11,270 7,554 14,526 77.59% 52.00% 1.25 1.44<br />
Isl<strong>and</strong> Garden City of Samal 5,220 3,395 9,384 55.63% 36.18% 1.09 1.31<br />
Panabo City 9,070 6,163 15,213 59.62% 40.51% 1.13 1.24<br />
Tagum City 12,987 10,389 20,329 63.88% 51.10% 1.04 1.15<br />
S O C I A L W A T C H P H I L I P P I N E S 233


