

Table B1.1: Demographics and Geopolitical Divisions ... - Social Watch
Table B1.1: Demographics and Geopolitical Divisions ... - Social Watch
Table B1.1: Demographics and Geopolitical Divisions ... - Social Watch

You also want an ePaper? Increase the reach of your titles
YUMPU automatically turns print PDFs into web optimized ePapers that Google loves.
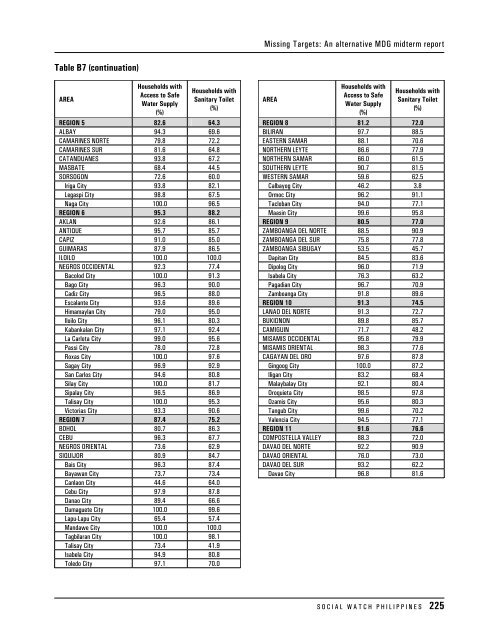
Missing Targets: An alternative MDG midterm report<br />
<strong>Table</strong> B7 (continuation)<br />
AREA<br />
Households with<br />
Access to Safe<br />
Water Supply<br />
(%)<br />
Households with<br />
Sanitary Toilet<br />
(%)<br />
REGION 5 82.6 64.3<br />
ALBAY 94.3 69.6<br />
CAMARINES NORTE 79.8 72.2<br />
CAMARINES SUR 81.6 64.8<br />
CATANDUANES 93.8 67.2<br />
MASBATE 68.4 44.5<br />
SORSOGON 72.6 60.0<br />
Iriga City 93.8 82.1<br />
Legaspi City 98.8 67.5<br />
Naga City 100.0 96.5<br />
REGION 6 95.3 88.2<br />
AKLAN 92.6 86.1<br />
ANTIQUE 95.7 85.7<br />
CAPIZ 91.0 85.0<br />
GUIMARAS 87.9 86.5<br />
ILOILO 100.0 100.0<br />
NEGROS OCCIDENTAL 92.3 77.4<br />
Bacolod City 100.0 91.3<br />
Bago City 96.3 90.0<br />
Cadiz City 96.5 88.0<br />
Escalante City 93.6 89.6<br />
Himamaylan City 79.0 95.0<br />
Iloilo City 96.1 80.3<br />
Kabankalan City 97.1 92.4<br />
La Carlota City 99.0 95.6<br />
Passi City 78.0 72.8<br />
Roxas City 100.0 97.6<br />
Sagay City 96.9 92.9<br />
San Carlos City 94.6 80.8<br />
Silay City 100.0 81.7<br />
Sipalay City 96.5 86.9<br />
Talisay City 100.0 95.3<br />
Victorias City 93.3 90.6<br />
REGION 7 87.4 75.2<br />
BOHOL 80.7 86.3<br />
CEBU 96.3 67.7<br />
NEGROS ORIENTAL 73.6 62.9<br />
SIQUIJOR 80.9 84.7<br />
Bais City 96.3 87.4<br />
Bayawan City 73.7 73.4<br />
Canlaon City 44.6 64.0<br />
Cebu City 97.9 87.8<br />
Danao City 89.4 66.6<br />
Dumaguete City 100.0 99.6<br />
Lapu-Lapu City 65.4 57.4<br />
M<strong>and</strong>awe City 100.0 100.0<br />
Tagbilaran City 100.0 98.1<br />
Talisay City 73.4 41.9<br />
Isabela City 94.9 80.8<br />
Toledo City 97.1 70.0<br />
AREA<br />
Households with<br />
Access to Safe<br />
Water Supply<br />
(%)<br />
Households with<br />
Sanitary Toilet<br />
(%)<br />
REGION 8 81.2 72.0<br />
BILIRAN 97.7 88.5<br />
EASTERN SAMAR 88.1 70.6<br />
NORTHERN LEYTE 86.6 77.9<br />
NORTHERN SAMAR 66.0 61.5<br />
SOUTHERN LEYTE 90.7 81.5<br />
WESTERN SAMAR 59.6 62.5<br />
Calbayog City 46.2 3.8<br />
Ormoc City 96.2 91.1<br />
Tacloban City 94.0 77.1<br />
Maasin City 99.6 95.8<br />
REGION 9 80.5 77.0<br />
ZAMBOANGA DEL NORTE 88.5 90.9<br />
ZAMBOANGA DEL SUR 75.8 77.8<br />
ZAMBOANGA SIBUGAY 53.5 45.7<br />
Dapitan City 84.5 83.6<br />
Dipolog City 96.0 71.9<br />
Isabela City 76.3 63.2<br />
Pagadian City 96.7 70.9<br />
Zamboanga City 91.8 89.6<br />
REGION 10 91.3 74.5<br />
LANAO DEL NORTE 91.3 72.7<br />
BUKIDNON 89.8 85.7<br />
CAMIGUIN 71.7 48.2<br />
MISAMIS OCCIDENTAL 95.8 79.9<br />
MISAMIS ORIENTAL 98.3 77.6<br />
CAGAYAN DEL ORO 97.6 87.8<br />
Gingoog City 100.0 87.2<br />
Iligan City 83.2 68.4<br />
Malaybalay City 92.1 80.4<br />
Oroquieta City 98.5 97.8<br />
Ozamis City 95.6 80.3<br />
Tangub City 99.6 70.2<br />
Valencia City 94.5 77.1<br />
REGION 11 91.6 76.6<br />
COMPOSTELLA VALLEY 88.3 72.0<br />
DAVAO DEL NORTE 92.2 90.9<br />
DAVAO ORIENTAL 76.0 73.0<br />
DAVAO DEL SUR 93.2 62.2<br />
Davao City 96.8 81.6<br />
S O C I A L W A T C H P H I L I P P I N E S 225


