Monthly Economic Bulletin October 2010 - Banco Mercantil
Monthly Economic Bulletin October 2010 - Banco Mercantil
Monthly Economic Bulletin October 2010 - Banco Mercantil

You also want an ePaper? Increase the reach of your titles
YUMPU automatically turns print PDFs into web optimized ePapers that Google loves.
ECONOMIC SITUATION<br />
Oil Market<br />
External Sector<br />
Government Finance<br />
Public Debt<br />
Monetary Market<br />
Interest Rates<br />
Real Sector<br />
Labor Market<br />
Prices<br />
NEW LEGISLATION<br />
ECONOMIC INDICATORS<br />
ECONOMIC SITUATION<br />
GEMA MURILLO *<br />
gmurillo@bancomercantil.com<br />
1<br />
CONTENT<br />
OIL MARKET<br />
The prices of the principal marker crudes increased<br />
substantially in the month of <strong>October</strong> over September,<br />
when there were only minor adjustments and, in some<br />
cases, actual declines. This development was largely<br />
explained by expectations of another round of major<br />
financial stimulus in the United States. Starting in <strong>October</strong>,<br />
petroleum prices reflected the belief that the Federal<br />
Reserve would increase the supply of money and affect the<br />
value of the dollar early in November.<br />
As a result, the average price of the WTI marker crude in<br />
<strong>October</strong> reached US$/b 81.9 for an 8.9% increase over<br />
September when this marker had fallen by 2.3%. The<br />
OCTOBER <strong>2010</strong><br />
average year-to-date (January-<strong>October</strong> <strong>2010</strong>) price of WTI<br />
came to US$/b 78.1, for a 33% increase over the same<br />
period of 2009. The average price of the Brent marker<br />
crude came to US$/b 83.5 in <strong>October</strong> for a 7% increase<br />
over September and the highest month-to-month increase<br />
since the month of April. On a year-to-date basis the price<br />
of Brent averaged US$/b 78.5, for a 31.5% rise over the<br />
same period of 2009.<br />
The prices of the OPEC crude basket and of the<br />
Venezuelan export basket followed the changes of the<br />
marker crudes. The average price of the OPEC basket in<br />
<strong>October</strong> of the current year was US$/b 79.8, for a 7.2%<br />
increase over the preceding month and for the highest<br />
month-to-month increase during last year. The average<br />
price of the OPEC basket during the first ten months of the<br />
year came to US$/b 75.7 for a 30.5% rise over the same<br />
period of 2009. The average price of the Venezuelan<br />
export basket was US$/b 74.3, up 9.4% over September<br />
and the highest month-to-month increase since June,<br />
2009. As a result, the average price of the Venezuelan oil<br />
export basket reached US$/b 70, nearly US$/b 16 higher<br />
than during the same period of 2009.<br />
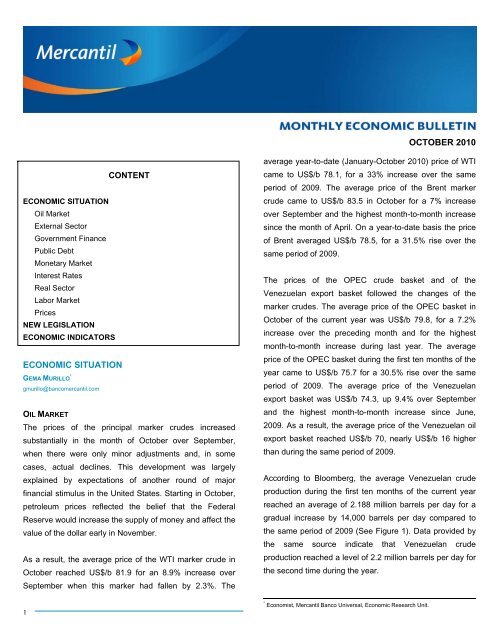
According to Bloomberg, the average Venezuelan crude<br />
production during the first ten months of the current year<br />
reached an average of 2.188 million barrels per day for a<br />
gradual increase by 14,000 barrels per day compared to<br />
the same period of 2009 (See Figure 1). Data provided by<br />
the same source indicate that Venezuelan crude<br />
production reached a level of 2.2 million barrels per day for<br />
the second time during the year.<br />
* Economist, <strong>Mercantil</strong> <strong>Banco</strong> Universal, <strong>Economic</strong> Research Unit.
Crude Oil Production<br />
2<br />
2,550<br />
2,400<br />
2,250<br />
2,100<br />
1,950<br />
1,800<br />
1,650<br />
1,500<br />
Oct-08<br />
Dec-08<br />
Feb-09<br />
Apr-09<br />
Figure 1<br />
Venezuela: Oil Price and Production<br />
Crude Oil Production<br />
Price of the Export Basket<br />
Jun-09<br />
Aug-09<br />
Oct-09<br />
Dec-09<br />
Source: Bloomberg and Ministry of the Popular Power for the Energy and Petroleum<br />
Until US$ 3,000 100% of the position<br />
Greater than US$ 6,000 US$ 5,000<br />
From US$ 3,000 to US$ 750,000 100% of the position<br />
Greater than US$ 750,000 US$ 750,000<br />
Source: PDVSA<br />
Feb-10<br />
Apr-10<br />
Jun-10<br />
Aug-10<br />
Oct-10<br />
90<br />
80<br />
70<br />
60<br />
50<br />
40<br />
30<br />
Price of the Export Basket<br />
was offered for exchange, representing a placement of<br />
US$ 618.6 of the new PDVSA 2013 bond.<br />
EXTERNAL SECTOR<br />
The BCV reported a Balance of Payments deficit of<br />
US$ 221 million in the third quarter of the current year,<br />
substantially better than the US$ 1.006 billion deficit<br />
recorded in the second quarter but still considerably worse<br />
than the US$ 2.364 billion surplus in the third quarter of<br />
2009 (See Table 2). This deficit is due to the combined<br />
effects of the deficits in the Capital and Financial accounts<br />
and in Errors and Omissions which offset the surplus in the<br />
Current account.<br />
In <strong>October</strong>, PDVSA issued the US$ 3 billion “PDVSA 2017”<br />
bond at the official exchange rate of Bs. 4.30 per US dollar.<br />
The total amount was placed. Demand by investors for this<br />
issue reached nearly US$ 7 billion. This bond matures in<br />
November 2017 and carries an 8.5% coupon. PDVSA<br />
required minimum bids of US$ 3,000 and priced the issue<br />
at 100% for a total of Bs. 12.9 billion, to be invested in<br />
PDVSA corporate projects. The procedure followed for the<br />
allocation of the bids is show on Table 1.<br />
This latter account registered a US$ 2.571 billion surplus in<br />
the third quarter of <strong>2010</strong>, similar to the second quarter but<br />
US$ 2.8 billion lower than the surplus recorded in the third<br />
quarter of 2009. This was due to the deceleration of the<br />
commercial surplus by 27.6% as a result of lower exports<br />
and higher imports. In the third quarter of the current year,<br />
petroleum exports, at US$ 14.661 billion, were down 5.4%<br />
Table 1 compared to the same quarter of 2009. This<br />
PETROBONO 2017 Bond Allocation Mechanism result was caused by lower export volumes, in<br />
INDIVIDUALS<br />
view of the fact that oil export prices actually<br />
Ranges Allocation<br />
rose by 6% during the quarter. Imports in that<br />
same third quarter increased by 13% compared<br />
LEGAL PERSONS<br />
to the same period of 2009, due to the increased<br />
Ranges Allocation<br />
purchases of material and equipment for public<br />
works principally for electricity generation. In this<br />
regard it should be noted that the share in<br />
imports by the public sector has increased<br />
PDVSA also offered to exchange the US$ 3 billion<br />
“Petrobono” maturing in 2011 for a new International Bond<br />
maturing in 2013 with an 8% coupon. Venezuelan<br />
individuals and corporations holders of the 2011<br />
considerably over the last six years, reaching 32% of the<br />
total in the third quarter of the current year, for an increase<br />
of 440 basis points (bp) over the same period of 2009<br />
when the level of public sector imports had come to 27.3%.<br />
“Petrobono” would receive an exchange incentive of<br />
US$ 1.125 of the new bond per US$ 1.000 of the<br />
“Petrobono” if they made the exchange before <strong>October</strong> 28.<br />
The incentive would be reduced to US$ 1.095 for<br />
exchanges made later than <strong>October</strong> 28. PDVSA reported<br />
that 18.3% (US$ 550 million) of the original “Petrobono”<br />
The Capital and Financial account showed a deficit of<br />
US$ 1.882 billion, similar to the previous quarter and<br />
32.1% lower than the deficit on record during the third<br />
quarter of 2009. The deficit in this account is basically the<br />
result of the deficit in the Other Investment Account of
US$ 2.0 billion (30% higher than that recorded in the same<br />
quarter of 2009), as the result of the initial disbursements<br />
under the Long-Term Financing granted to BANDES by the<br />
National Bank of China.<br />
The net result of the current capital transactions and<br />
imputations to the Errors and Omissions Account<br />
determined a level of reserves in the hands of the BCV at<br />
the close of September of US$ 28.618 billion, that is,<br />
US$ 6.382 billion less than at the close of 2009 (US$ 35<br />
billion). The most recent information about the international<br />
reserves at the close of <strong>October</strong>, showed a decline by<br />
US$ 5.967 billion compared to the month of December,<br />
mainly as the result of the transfer of US$ 6 billion from the<br />
BCV to FONDEN in the first semester of the year 1 , to reach<br />
a net of US$ 29.033 billion. To be noted is that<br />
approximately half of these reserves correspond to the<br />
BCV position in gold.<br />
In addition, the Foreign Currency Administration<br />
Commission (CADIVI – Comisión de Administración de<br />
1 Originally, the Central Bank had announced its intention of transferring US$ 7<br />
billion to FONDEN during the first semester of the year. To be noted is that, of the<br />
US$ 1 billion remaining, US$ 500 million were transferred in November.<br />
3<br />
Table 2<br />
Balance of Payments<br />
Third Quarter (Million of US$)<br />
2009 <strong>2010</strong><br />
CURRENT ACCOUNT 5,377<br />
Trade Balance 7,623<br />
Total Export 16,445<br />
Oil 15,494<br />
Non-Oil 951<br />
Total Import (8,822)<br />
Oil (1,086)<br />
Non-Oil (7,736)<br />
Services (1,765)<br />
Rent (471)<br />
Current Transfers (10)<br />
CAPITAL & FINANCIAL ACCOUNT (2,773)<br />
Direct Investment (2,143)<br />
Abroad (572)<br />
In the Country (1,571)<br />
Portfolio Investment 909<br />
Other Investment (1,539)<br />
Public Sector 3,036<br />
Private Sector (3,985)<br />
ERRORS & OMISSIONS (240)<br />
GLOBAL BALANCE 2,364<br />
Source: Central Bank of Venezuela<br />
2,571<br />
5,523<br />
15,491<br />
14,661<br />
830<br />
(9,968)<br />
(916)<br />
(9,052)<br />
(2,103)<br />
(726)<br />
(123)<br />
(1,882)<br />
(1,212)<br />
94<br />
(1,306)<br />
1,330<br />
(2,000)<br />
1,778<br />
(2,644)<br />
(910)<br />
(221)<br />
Divisas) published the statistics corresponding to the<br />
authorizations and liquidations of foreign exchange during<br />
the third quarter of the year. According to CADIVI, in the<br />
amount accumulated during the first nine months of the<br />
year, the total requests approved increased by barely 3.2%<br />
compared to the same period of last year, in spite of the<br />
higher oil prices, which stood on average 32.2% higher<br />
than in the first nine months of 2009. Likewise, currency<br />
actually liquidated by the BCV showed a year-on-year<br />
growth of 1.8%, explainable in part by the delays resulting<br />
from the establishment of the new system of multiple<br />
exchange rates at the beginning of the year. Consequently,<br />
during the first nine months of the year, the daily average<br />
of foreign exchange liquidated by the BCV came to<br />
US$ 118 million, 2.5% over the record during the first nine<br />
months of the year 2009.<br />
By type of request, according to s supplied by CADIVI, in<br />
the first three quarters of the year (US$ 20.991 billion)<br />
70.4% went for imports, 14.4% for outlays charged to the<br />
ALADI Agreement, 4.5% for airlines, 4% for credit cards<br />
and 6.7% to Others. To be noted, almost half of the types<br />
of requests for currency declined in comparison with the<br />
same period of 2009. However, the increases shown in the<br />
requests for Imports, Students, Special Cases, Airlines and<br />
Cash for Travels, as a result of their high participation in<br />
the total liquidated foreign exchange (78%), partially offset<br />
the decline in the amount actually liquidated.<br />
The total foreign exchange liquidated for imports during the<br />
period in question, not including imports under the ALADI<br />
Agreement, came to US$ 14.792 billion. Of this amount,<br />
the economic sectors receiving more currency were: Food<br />
(20.8%), Health (19.5%), Automotive (12.1%), Commerce<br />
(12%), Machinery and Equipment (6.7%) and Chemicals<br />
(6.6%). In this connection, to be noted is the significant<br />
growth by 67.4% of liquidations destined to the Health<br />
sector which explains the increase by slightly over 320<br />
basis points (bp) in the participation of the total foreign<br />
exchange for imports, which went from 16.1% in the<br />
January - September period of 2009 to 19.5% in the same
period of this year. This higher participation of the Health<br />
sector was at the expense of the Food and Automotive<br />
sectors, which declined by 252 bp and 185 bp respectively<br />
(See Figure 2).<br />
Foods<br />
Health<br />
Automobile<br />
Commerce<br />
Others<br />
Machineries and Equipment<br />
Metallurgic<br />
Chemistry<br />
Rubber and Plastic<br />
Telecommunications<br />
Services<br />
Informatic<br />
4<br />
Figure 2<br />
Sectorial distribution of FX sold for imports<br />
(Third Quarter)<br />
<strong>2010</strong><br />
2009<br />
0% 5% 10% 15% 20% 25% 30%<br />
Note: Not include imports under ALADI agreement<br />
Source: CADIVI and Own Calculations<br />
The SITME started operations in early June. Up to the end<br />
of September, the daily average of currency provided<br />
through the SITME 2 came to US$ 30.9 million at an implicit<br />
weighted average exchange rate of Bs./US$ 5.30. To be<br />
noted is that the daily average of foreign exchange<br />
delivered through this procedure increased notably during<br />
the month of <strong>October</strong> to US$ 43.2 million. Consequently, a<br />
total of US$ 3.330 billion have been provided through<br />
SITME (See Figure 3).<br />
GOVERNMENT FINANCE<br />
The financial performance of the Central<br />
Government, according to the most recent<br />
information provided by the National Treasury<br />
Office (ONT -Oficina Nacional del Tesoro)<br />
during the first ten months of the year, again<br />
showed a deficit as a result of a moderate<br />
government spending together with still low oil<br />
income on record and its notably diminished<br />
participation within the total revenues.<br />
2 In early June, the BCV approved the System of Transactions with Securities in<br />
Foreign Currency (SITME – Sistema de Transacciones con Títulos en Moneda<br />
Extranjera), by which government securities may be negotiated under the terms and<br />
conditions established by the BCV through authorized financial institutions. For this<br />
purpose, the BCV publishes daily in its web page the maxi-mum and minimum<br />
prices at which securities of the Republic and of PDVSA may be purchased and sold<br />
in bolivares. Companies and individuals may participate in the SITME with restricted<br />
quantities, whereas Commercial and Universal Banks, and Savings and Loans<br />
Entities, act both as intermediaries (ex-change operators) as well as suppliers of<br />
bonds in this new system.<br />
The ordinary revenues of the Central Government during<br />
the first ten months came to Bs. 122 billion (68.1%<br />
provided by non-oil contributions), for an increase of barely<br />
2.9% over the same period of 2009. After adjustment for<br />
the high inflation during the period, the result in real terms<br />
was a decline by 18.3%.<br />
45<br />
40<br />
35<br />
30<br />
25<br />
20<br />
15<br />
10<br />
5<br />
0<br />
Figure 3<br />
SITME<br />
Daily Average (Million of US$)<br />
Jun-10 Jul-10 Aug-10 Sep-10 Oct-10<br />
Source: Central Bank of Venezuela and Own Calculations<br />
To be noted is that the highest nominal cumulative<br />
expansion during the January to <strong>October</strong> period of this<br />
year was in non-oil income (+4.9%), while oil income<br />
declined by -1.2%. In real terms, oil income dropped by<br />
21.6%, and non-oil by 16.7%.<br />
Nominal Real<br />
Jan-Oct 2009 Jan-Oct <strong>2010</strong> Change Change<br />
I.- ORDINARY 118,534 121,965 2.9% -18.3%<br />
Oil 39,391 38,914 -1.2% -21.6%<br />
Tax Income 8,293<br />
7,179 -13.4% -31.3%<br />
PDVSA's Cash Royalties 28,034 30,044 7.2% -15.0%<br />
PDVSA's Dividends 3,064<br />
1,691 -44.8% -56.2%<br />
Non-Oil 79,143 83,051 4.9% -16.7%<br />
Primary Expenditures 135,977 152,854 12.4% -12.8%<br />
Surplus/Deficit (23,199) (30,889) 33.1% 5.7%<br />
Source: National Treasury Office, Central Bank of Venezuela and Own Calculations<br />
Table 3<br />
Central Government Financial Management<br />
Acumulated to <strong>October</strong><br />
Million of Bs.<br />
The nominal decrease of oil income was a result of the<br />
decline in payment of Income Tax (-13.4%) and of<br />
Dividends (-44.8%). This was offset in part by a 7.2%<br />
increase in payment of Royalties (See Table 3). This lower<br />
oil income occurs in a context in which the value in<br />
bolívares of the oil income increased by 100% as a result
of the exchange rate adjustment at the beginning of the<br />
year.<br />
5<br />
Payments and 4.4% to pending obligations budget of the<br />
previous year.<br />
In addition, internal tax collections under SENIAT<br />
jurisdiction came to Bs. 82.6 billion in the first ten months<br />
50%<br />
Figure 4<br />
Primary Expenditures executed by the Treasury<br />
(Accumulated to <strong>October</strong>)<br />
of the year, almost 25% over the same period of 2009.<br />
However, the high inflation rates throughout the year led to<br />
40%<br />
30%<br />
Nominal Change<br />
Real Change<br />
a decline in real terms by 3.6% (during 2009, the real de-<br />
20%<br />
cline was 13.3%). By type of contributions, the Value<br />
10%<br />
Added Tax showed a real year-to-year increase of 6.5%;<br />
0%<br />
Domestic and Customs Incomes increased by barely 0.8%<br />
-10%<br />
2007 2008 2009 <strong>2010</strong><br />
and 0.3% respectively. Income Tax (ISLR – Impuesto<br />
-20%<br />
sobre la Renta) showed a real 17.8% year-on-year decline,<br />
-30%<br />
Source: Ministry of the Popular Power for the Economy and Finances and Own Calculations<br />
930 bp more than the real decline during the same period<br />
of last year (See Table 4).<br />
As a result of the combined effect of increased public<br />
spending and lower growth of ordinary<br />
Table 4<br />
Domestic Taxes income, the Central Government’s fiscal<br />
Acumulated to <strong>October</strong> (Million of Bs.)<br />
performance (ordinary income – ordinary<br />
Income Tax<br />
Value Added Tax<br />
2009<br />
22,235.9<br />
32,692.4<br />
<strong>2010</strong><br />
23,634.7<br />
44,936.8<br />
Nominal Change<br />
6.3%<br />
37.5%<br />
Real Change<br />
-17.8%<br />
6.5%<br />
expenditures) showed a significant deficit<br />
by Bs. 30.9 billion during the first ten<br />
Wholesale Operators<br />
Imports Operators<br />
26,229.6<br />
6,462.8<br />
36,316.4<br />
8,620.4<br />
38.5%<br />
33.4%<br />
7.5%<br />
2.3%<br />
months of the year; this was 33.1% higher<br />
Customs<br />
Domestic Income<br />
Alcoholic Beverages<br />
5,352.8<br />
4,729.5<br />
951.3<br />
7,003.3<br />
6,169.1<br />
1,234.4<br />
30.8%<br />
30.4%<br />
29.8%<br />
0.3%<br />
0.8%<br />
-0.2%<br />
than the deficit during the same period of<br />
2009 (Bs. 23.2 billion), and the highest for<br />
Tabacco<br />
Fiscal Duties<br />
3,415.7<br />
49.4<br />
4,521.0<br />
43.4<br />
32.4%<br />
-12.2%<br />
2.5%<br />
-31.9%<br />
the January-<strong>October</strong> period since the<br />
Inheritance<br />
Gambling & Casinos<br />
Others<br />
145.5<br />
167.6<br />
1,328.1<br />
180.1<br />
190.2<br />
901.3<br />
23.8%<br />
13.5%<br />
-32.1%<br />
-4.7%<br />
-12.2%<br />
-46.8%<br />
monthly statistical series became available<br />
(1998) (See Figure 5). To be noted is that<br />
Total<br />
Source: SENIAT and Own Calculations<br />
66,338.7 82,645.2<br />
24.6% -3.6%<br />
this deficit was basically covered with<br />
domestic public debt.<br />
On the other side of the budget balance, primary<br />
expenditures according to the Treasury stood at Bs. 152.9 Concerning the fiscal budget of this year, the additional<br />
billion during the first ten months of the year, for a nominal credits approved by the National Assembly and decreed by<br />
increase of 12.4% compared to the same period of last the Executive stood at Bs. 66.4 billion up to <strong>October</strong>; this<br />
year. However, in real terms, this was a 12.8% contraction was 85.4% higher than the amount approved during the<br />
(See Figure 4). To be noted is that during the period, an same period of 2009. Consequently, the fiscal budget to<br />
average of 9% of the budgeted amounts of Bs. 168.1 billion date comes to Bs. 203.6 billion, that is, 27.7% higher than<br />
was not disbursed. According to the composition of the initially approved fiscal budget (Bs. 159.4 billion). By<br />
expenditures during the January-<strong>October</strong> period of this sectors, these additional credits were distributed as<br />
year, 34.3% in Other Transfers were assigned to follows: 44.1% to Other sectors, 37.3% to Social sectors,<br />
decentralized entities of the Public Administration, 30.4% 12.1% to Productive sectors, and 6.5% to General sectors.<br />
went to Remunerations, 24.4% to Legal Contributions of To be noted in this connection is that, to date this year no<br />
state governments and municipalities, 6.5% to Other additional credits have been approved for the Law of<br />
Special <strong>Economic</strong> Allocations (LAEE - Ley de
Asignaciones Económicas Especiales), nor for the<br />
Allocations to the States (Situado Constitucional), whereas<br />
during the same period of last year 17.3% of the approved<br />
credits had been assigned to these sectors (See Table 5).<br />
(Acumulated to <strong>October</strong>) Million of Bs.<br />
10,000<br />
5,000<br />
SUPERAVIT (+)<br />
0<br />
-5,0001998<br />
1999 2000 2001 2002 2003 2004 2005 2006 2007 2008 2009 <strong>2010</strong><br />
-10,000<br />
-15,000<br />
-20,000<br />
-25,000<br />
DEFICIT (-)<br />
-30,000<br />
-35,000<br />
Note: 1/ Calculated as the difference between the Ordinary Revenues<br />
and the Ordinary Expenditures<br />
Source: Ministry of the Popular Power for the Economy and Finances, National Treasury Office<br />
and Own Calculations<br />
TOTAL 2009 20,686<br />
January -<br />
February -<br />
March 100<br />
April 479<br />
Mayo 1,491<br />
June 2,108<br />
July 304<br />
August 2,465<br />
September 5,632<br />
<strong>October</strong> 8,106<br />
TOTAL <strong>2010</strong> 24,743<br />
January -<br />
February 405<br />
March 2,182<br />
April 1,532<br />
Mayo 890<br />
June 3,588<br />
July 265<br />
August 10,219<br />
September 532<br />
<strong>October</strong> 5,131<br />
6<br />
Figure 5<br />
Central Government Fiscal Management 1/<br />
Social<br />
Sectors<br />
Productive<br />
Sectors<br />
3,847<br />
-<br />
-<br />
-<br />
-<br />
220<br />
2,126<br />
230<br />
1,009<br />
46<br />
216<br />
8,032<br />
-<br />
-<br />
3,348<br />
1,975<br />
100<br />
118<br />
48<br />
292<br />
102<br />
2,048<br />
General<br />
Sectors<br />
766<br />
-<br />
393<br />
-<br />
-<br />
-<br />
-<br />
58<br />
-<br />
220<br />
95<br />
4,319<br />
-<br />
33<br />
-<br />
-<br />
-<br />
1,013<br />
500<br />
1,322<br />
1,100<br />
352<br />
Note: 1/ Law of Special <strong>Economic</strong> Allowances.<br />
Source: Official Gazettes of the Bolivarian Republic of Venezuela and Own Calculations<br />
PUBLIC DEBT<br />
The low level of fiscal oil income recorded in the National<br />
Treasury during the first ten months of the year led to the<br />
Central Government’s increased need for further financing.<br />
Consequently, a program of weekly auctions of Treasury<br />
-<br />
-<br />
-<br />
-<br />
-<br />
-<br />
-<br />
-<br />
-<br />
-<br />
-<br />
-<br />
-<br />
-<br />
-<br />
-<br />
-<br />
-<br />
-<br />
-<br />
-<br />
-<br />
Bills 3 was initiated in early February as a result of which a<br />
cumulative total placement of Bs. 14.6 billion was made<br />
during the January-<strong>October</strong> period of this year. This was<br />
1.1 times higher than placements on record in the same<br />
period of the previous year 4 . In terms of maturity, the award<br />
of this type of instrument was carried out as follows: 94.1%<br />
at 91- and 105-days terms, and the remaining 5.9% at<br />
terms of 182 and 364 days. However, these higher<br />
placements had an average yield almost 130 bp below that<br />
of last year to stand at 8.5% 5 .<br />
In addition, a program of weekly auctions of VEBONOS<br />
and TIF 6 was launched in the second week of February.<br />
Consequently, Bs. 31.6 billion were placed during the<br />
January-<strong>October</strong> period, 55.8% more than during the first<br />
ten months of 2009, with<br />
an effective yield of<br />
15.5%, that is 320 bp<br />
LSEA<br />
over the yield on record<br />
during the same period<br />
4,417 1,784 4,289 35,788 of last year. To be noted<br />
-<br />
-<br />
-<br />
-<br />
-<br />
-<br />
-<br />
393 is that 92% of the<br />
-<br />
-<br />
-<br />
-<br />
109<br />
30<br />
209<br />
509<br />
placement was awarded<br />
- -<br />
29 1,740 by auction and the<br />
4,417<br />
-<br />
1,784<br />
-<br />
1,240<br />
637<br />
11,675<br />
1,230 remaining 8% by direct<br />
- -<br />
450 3,924 award.<br />
1/<br />
Table 5<br />
Additional Credits by <strong>Economic</strong> Destiny<br />
Million of Bs.<br />
Other<br />
Sectors<br />
TOTAL<br />
Public Debt Constitutional<br />
Allowances<br />
-<br />
-<br />
-<br />
-<br />
-<br />
-<br />
-<br />
-<br />
-<br />
-<br />
-<br />
-<br />
-<br />
-<br />
-<br />
-<br />
-<br />
-<br />
-<br />
-<br />
-<br />
-<br />
-<br />
-<br />
-<br />
-<br />
38<br />
1,756<br />
29,272<br />
-<br />
-<br />
-<br />
201<br />
3,668<br />
17,507<br />
2,235<br />
3,196<br />
1,109<br />
1,355<br />
5,936<br />
10,173<br />
66,366<br />
-<br />
438<br />
5,530<br />
3,708<br />
4,658<br />
22,226<br />
3,049<br />
15,028<br />
2,843<br />
8,886<br />
Maturities of domestic<br />
public debt in the<br />
January-<strong>October</strong> <strong>2010</strong><br />
period added up to Bs.<br />
17 billion of which 76%<br />
in Treasury Bills and<br />
24% in DPN bonds. As<br />
a result, the net<br />
3 Under the issue approved in Official Gazette N° 39,349 of January 19 of this year,<br />
a maximum circulation at the close of the fiscal year <strong>2010</strong> of Bs. 5.15 billion was<br />
approved.<br />
4 When the oil price was 30% lower than the current price.<br />
5 Consequently reducing not only the financing cost of this instrument but also the<br />
cost of payment of interest of VEBONOS, which are linked to the rate of yield of<br />
Treasury Bills.<br />
6 In the framework of issues approved in Official Gazettes N° 39,362 and 39,392 of<br />
February 5 and March 23 of this year, when the issue of a maximum Bs. 45.7 billion<br />
were approved to finance Public Debt Service and Fiscal Performance.
indebtedness rose by Bs. 29.2 billion for the highest level<br />
since this statistical series became available in 1999 (See<br />
Figure 6), 62.5% higher than the net positive indebtedness<br />
of Bs. 18 billion in the same period of 2009.<br />
30,000<br />
26,000<br />
22,000<br />
18,000<br />
14,000<br />
10,000<br />
6,000<br />
2,000<br />
-2,000<br />
-6,000<br />
-10,000<br />
7<br />
1999<br />
2000<br />
Figure 6<br />
Net Domestic Borrowing Requirement<br />
(DPN Bonds + Treasury Bills) (Acumulated to <strong>October</strong>)<br />
Billions of Bs.<br />
2001<br />
2002<br />
2003<br />
2004<br />
2005<br />
2006<br />
2007<br />
2008<br />
2009<br />
<strong>2010</strong><br />
Source: Central Bank of Venezuela and Own Calculations<br />
The high awards of DPN bonds and Treasury Bills brought<br />
the total stock of debt securities held by the Central<br />
Government at the close of <strong>October</strong>, <strong>2010</strong>, to Bs. 81.1<br />
billion (93.6% of which were in DPN bonds), for a 58.4%<br />
increase in the net debt in circulation at the close of the<br />
year 2009 (Bs. 51.2 billion). The current level of domestic<br />
debt securities in stock represents 30.9% of total monetary<br />
liquidity, the highest amount since <strong>October</strong> 2006, although<br />
still well below the historical maximum of 83% in <strong>October</strong>,<br />
2003.<br />
MONETARY MARKET<br />
The performance of the monetary market to date this year<br />
showed a moderate expansion of money in circulation,<br />
resulting mostly from the domestic economic contraction,<br />
the lesser secondary creation of money by way of credits,<br />
the delivery of dollars by CADIVI at a higher exchange<br />
rate, the sterilization resulting from the various issues of<br />
Bs/US$ Bonds (International Sovereign Bonds and<br />
PETROBONOS), and to a lesser degree, through<br />
mechanisms such as SITME.<br />
In effect, Monetary Liquidity (M2) came to Bs. 262.3 billion<br />
during the week of <strong>October</strong> 29; this was a cumulative<br />
11.4% expansion compared to the close of 2009, and<br />
scarcely more than 140 bp below the 12.9% expansion<br />
during the same period of 2009 (See Figure 7). However,<br />
after discounting the effects of the higher inflation rates<br />
throughout the period, the contraction of M2 continued<br />
during this year. In effect, at the close of the first ten<br />
months of the year, the real contraction stood at 10%, 180<br />
bp over the real decline on record in the same period of<br />
2009 (-8.2%).<br />
54%<br />
46%<br />
38%<br />
30%<br />
22%<br />
14%<br />
6%<br />
-2%<br />
-10%<br />
-18%<br />
2000<br />
Monetary Liquidity<br />
Monetary Base<br />
2001<br />
2002<br />
2003<br />
2004<br />
Figure 7<br />
Liquidity & Monetary Base<br />
% Change Accumulated to <strong>October</strong><br />
2005<br />
2006<br />
2007<br />
2008<br />
2009<br />
<strong>2010</strong><br />
Source: Central Bank of Venezuela and Own Calculations<br />
By components, Money in Circulation (Coins and Bills plus<br />
Sight Deposits) caused the overall nominal development of<br />
liquidity, which grew by a cumulative 20.4%, somewhat<br />
over 1,000 bp over the cumulative increase during the<br />
same period of 2009 7 . At the same time, Quasimoney<br />
(Savings and Term Deposits) showed a cumulative<br />
decrease by 7%, in significant contrast with the 17.4%<br />
increase during the same period of last year (See Figure<br />
8). As a result, the participation of Money in Circulation<br />
rose from 62.4% at the end of <strong>October</strong> 2009 to 71.2% in<br />
the same month of this year. To be noted is that this<br />
participation of Money in Circulation is the highest since<br />
the statistical series became available (December 1968) 8<br />
(See Figure 9).<br />
7 To be noted is the quite different performance of the components of Money in<br />
Circulation. In effect, Sight Deposits grew by a cumulative 26.4%, which explains the<br />
increase of Money in Circulation. However, Coins and Bills declined by a cumulative<br />
6.5%.<br />
8 This performance of Money in Circulation may be reflecting the greater preference<br />
of the public for more liquid instruments in a scenario of high inflation rates and<br />
economic recession.
-10%<br />
-20%<br />
8<br />
50%<br />
40%<br />
30%<br />
20%<br />
10%<br />
0%<br />
Figure 8<br />
Change of Liquidity, Accumulated<br />
(by Components)<br />
Term Deposits<br />
Saving Deposits<br />
Demand Deposits<br />
Cash<br />
Monetary Liquidity<br />
2000 2001 2002 2003 2004 2005 2006 2007 2008 2009 <strong>2010</strong><br />
Source: Central Bank of Venezuela and Own Calculations<br />
The Monetary Base or high-powered money reached<br />
Bs. 100.6 billion as of <strong>October</strong> 29, representing a<br />
cumulative growth of barely 1.7% compared to the close of<br />
2009, 60 bp over the cumulative increase in the same<br />
period of last year (1.1%). To be noted is that to date this<br />
year no detailed information on the components of the<br />
Monetary Base has been published.<br />
80%<br />
70%<br />
60%<br />
50%<br />
40%<br />
30%<br />
20%<br />
1990<br />
1991<br />
Figure 9<br />
Money in Circulation (Cash + Demand Deposits)<br />
as percentage of Monetary Liquidity<br />
1992<br />
1993<br />
1994<br />
1995<br />
1996<br />
1997<br />
1998<br />
1999<br />
2000<br />
2001<br />
2002<br />
2003<br />
2004<br />
2005<br />
2006<br />
2007<br />
2008<br />
2009<br />
<strong>2010</strong><br />
Source: Central Bank of Venezuela and Own Calculations<br />
Bank liquidity surpluses came to Bs. 15.5 billion on<br />
average during the fist ten months of the year, which is 3.8<br />
times higher than the average on record for the January-<br />
<strong>October</strong> period of 2009 9 . As a result, liquidity surpluses<br />
over M2 went from 1.9% in the first ten months of 2009 to<br />
6.7% in the same period of this year.<br />
9 To be pointed out is that the strong expansion of surplus liquidity in the banking<br />
system in late 2009 and, to a lesser degree, throughout the current year, was the<br />
result of a lesser increase in loans, as well as of the limits imposed on CDs and<br />
Repos by the Central Bank since December of last year.<br />
Regarding the management of monetary policy, during the<br />
first ten months of the year the BCV showed a more lax<br />
performance than last year with respect to awarding<br />
Certificates of Deposit (CDs) and Repos. This is explained<br />
in part by the limits established on placement of CDs and<br />
Repos (the Central Bank’s main instruments to control<br />
Money in Circulation). In effect, placements of these<br />
absorption instruments during the period came to Bs. 93.6<br />
billion, which was 43.4% lower than during the January-<br />
<strong>October</strong> period of 2009.<br />
Injection operations in an amount of Bs. 27.3 billion were<br />
carried out by means of Purchase of DPN Bonds under<br />
Resale Pact (Reverse Repos) up to <strong>October</strong> at an average<br />
rate of 19.4%, while during the same period of last year<br />
placements were, 1.3 times lower (Bs. 11.7 billion).<br />
Maturities of both CDs and Repos during the January-<br />
<strong>October</strong> period came to Bs. 95.1 billion compared to<br />
Bs. 180 billion during the first ten months of 2009. As a<br />
result, open market operations, both of absorption and<br />
injection, resulted in a slight expansion of liquidity of barely<br />
Bs. 21.4 million (See Figure 10), in contrast with the strong<br />
expansion by Bs. 13.5 billion during the same period of<br />
2009. Given the lower awards of credit instruments by the<br />
BCV together with the decrease by some-what over 200<br />
bp in the average weighted yield of CDs and Repos,<br />
interest paid by the Central Bank during the first ten<br />
months of the year declined by 70.8% compared to the<br />
same period of last year, for a total Bs. 600.6 million.<br />
Figure 10<br />
Net Effect of Open Market Operations<br />
Repos+Certificates of Deposits+Reverse Repos. Million of Bs.<br />
10,000<br />
8,000<br />
6,000<br />
4,000<br />
2,000<br />
0<br />
-2,000<br />
-4,000<br />
-6,000<br />
-8,000<br />
Oct-08<br />
Dec-08<br />
Feb-09<br />
INYECTION<br />
Apr-09<br />
Jun-09<br />
ABSORPTION<br />
Aug-09<br />
Oct-09<br />
Issuance of Bonds (Bs. / US$)<br />
Jun-09: PETROBONO 2011<br />
Oct-09: Bonos Soberanos Internacionales<br />
Oct-09: PETROBONO 2014,2015 y 2016<br />
Aug-10: Bono Soberano Internacional 2022<br />
Oct-10: PETROBONO 2017<br />
Dec-09<br />
Feb-10<br />
Apr-10<br />
Jun-10<br />
Aug-10<br />
Oct-10<br />
Source: Central Bank of Venezuela and Own Calculations
As a result, the stock in circulation of CDs and Repos fell<br />
from Bs. 10.2 billion at the close of 2009 to Bs. 9.3 billion<br />
at the close of <strong>October</strong> of this year. This level is equivalent<br />
to 3.5% of M2, 120 bp less than in the same month of<br />
2009, and represented the lowest on record since May of<br />
2002, when this ratio stood at 2.7%. In addition, this level<br />
was significantly lower than the historical maximum on<br />
record, when this ratio reached 46.2% in April 2006 (See<br />
Figure 11).<br />
16%<br />
14%<br />
12%<br />
10%<br />
9<br />
8%<br />
6%<br />
4%<br />
2%<br />
Oct-08<br />
Dec-08<br />
Feb-09<br />
Figure 11<br />
BCV's Stock of Securities (Cd's+Repos)<br />
as percentage of Monetary Liquidity<br />
Apr-09<br />
Jun-09<br />
Aug-09<br />
Oct-09<br />
Dec-09<br />
Feb-10<br />
Apr-10<br />
Jun-10<br />
Aug-10<br />
Oct-10<br />
Source: Central Bank of Venezuela and Own Calculations<br />
In connection with legal matters, according to Official<br />
Gazette N° 39,538, for the second time this year,<br />
on <strong>October</strong> 26, <strong>2010</strong> the minimum legal reserve<br />
that financial institutions must maintain for the increase<br />
of their deposits with respect to the<br />
Reserves Base (July 14, 2006) was reduced from<br />
20% to 17%. This lower reserve entailed freeing<br />
bank funds by approximately Bs. 9.6 billion.<br />
INTEREST RATES<br />
To date this year, interest rates have continued<br />
their downward trend recorded throughout 2009. In<br />
effect, the nominal active rate of Commercial and<br />
Universal Banks averaged 18.3% in the first ten<br />
months of the year, equivalent to a decline by 262<br />
bp compared to the average rate during the same period of<br />
2009, and represented the lowest on record since the<br />
same period of 2007. By economic destination, the rates<br />
charged declined for all items, particularly Mortgage<br />
Loans 10 (-537 bp compared to the January-<strong>October</strong><br />
average of 2009), Communications (-325 bp), and<br />
Commerce (-278 bp) (See Table 6).<br />
The Savings Deposits rate reached an average 12.6%<br />
(vs. 13.6% during the same period of 2009), while the 90day<br />
Fixed Term Deposits rate declined by 100 bp for an<br />
average 14.7% during the first ten months of the year, both<br />
barely higher than the regulatory minimums of 12.5% and<br />
14.5% respectively. Consequently, the relative financial<br />
margin stood at 19.3% on average for the period, that is<br />
320 bp below that of the January-<strong>October</strong> period of 2009<br />
(22.5%), which also is the lowest level for a similar period<br />
since 1993 (See Figure 12).<br />
As a result of the high rates of inflation of the period, the<br />
average lending and borrowing rates continued to be<br />
negative for the fifth year running in the case of loans, and<br />
for the ninth consecutive year in the case of the deposits<br />
with highest yields. In effect, the real lending rate was<br />
-7.7% (-5.6% on average for the first ten months of 2009),<br />
Table 6<br />
Commercial and Universal Banks<br />
Average Interest Rates by <strong>Economic</strong> Destination<br />
Average until <strong>October</strong><br />
2008 2009 <strong>2010</strong><br />
AVERAGE LENDING RATE 23.4<br />
21.0<br />
18.3<br />
Agriculture 13.4<br />
12.6<br />
12.3<br />
Industrial 22.2<br />
19.6<br />
17.5<br />
Commerce 25.8<br />
23.9<br />
21.1<br />
Services 24.7<br />
23.5<br />
22.0<br />
Mortgage 21.3<br />
16.3<br />
11.0<br />
Transportation 26.3<br />
22.8<br />
22.2<br />
Tourism 19.5<br />
17.7<br />
15.5<br />
Communication 25.7<br />
23.4<br />
20.2<br />
Vehicles 26.8<br />
25.2<br />
22.8<br />
Other Private Sectors 24.8<br />
23.7<br />
22.5<br />
Mining and Quarries 26.8<br />
23.2<br />
20.9<br />
Electricity and Water 26.1<br />
24.2<br />
22.5<br />
Credit Cards 31.2<br />
30.0<br />
28.6<br />
Source: Central Bank of Venezuela and Own Calculations<br />
whereas the real borrowing rate came to -10.4% (-9.2% in<br />
the same period of last year). It is important to point out<br />
that negative real interest rates usually stimulate demand<br />
for credit and the substitution of savings by consumption<br />
10 To be pointed out is that some of the Sectors subject to measures of preferred<br />
rates, like Mortgage and Farming, stayed at the lowest level of the classification of<br />
asset yields by economic destination.
(in anticipation of future prices higher than the yields of<br />
savings).<br />
%<br />
48<br />
44<br />
40<br />
36<br />
32<br />
28<br />
24<br />
20<br />
16<br />
12<br />
10<br />
1990<br />
1992<br />
REAL SECTOR<br />
Figure 12<br />
Financial Gap<br />
Commercial and Universal Banks. Average to <strong>October</strong><br />
1994<br />
1996<br />
1998<br />
2000<br />
2002<br />
2004<br />
2006<br />
2008<br />
<strong>2010</strong><br />
Source: Central Bank of Venezuela and Own Calculations<br />
The oil product during the third quarter of the current year<br />
came to -2.1%, similar to the preceding quarter, but 750<br />
basis points less than the decline during the same period<br />
of 2009. This result was recorded in spite of the slight<br />
20,000 b/d (-0.9%) drop in oil production and of the 5.8%<br />
higher average price of the Venezuelan oil export basket.<br />
Figure 13<br />
Absolute deviation of Non Oil GDP by <strong>Economic</strong> Activity<br />
with respect to Total Non Oil GDP<br />
Government General<br />
Services<br />
Social and Common<br />
Services<br />
Real Estate and Services<br />
provided<br />
Finance & Insurance<br />
Mining<br />
12.0%<br />
8.0%<br />
4.0%<br />
0.0%<br />
-4.0%<br />
-8.0%<br />
-12.0%<br />
Manufacturing<br />
Electricity & Water<br />
Construction<br />
Commerce & Repair<br />
Services<br />
Transportation &<br />
Warehousing<br />
The Central Bank (BCV) reported that the Gross Domestic<br />
Communications<br />
Product (GDP) had declined by 0.4% in the third quarter of<br />
Non Oil GDP by <strong>Economic</strong> Activity Total Non Oil GDP<br />
<strong>2010</strong> when compared with the same period of 2009,<br />
Source: Central Bank of Venezuela and Own Calculations<br />
significantly less than the 1.9% decline of the second On the other hand, the non-oil activity fell by merely 0.2%,<br />
quarter and 420 basis points less than the reduction for the lowest decline since the second quarter of 2009.<br />
registered in that same period of last year. This means that The rate of decline has decelerated considerably from the<br />
the Venezuelan economy was in decline for the sixth high -4.9% of the first quarter of this year. An analysis of<br />
consecutive quarter. The GDP fall during the first nine the decline by type of economic activity shows that the<br />
months of <strong>2010</strong> reached 2.4%.<br />
economic activity fell in most of the sectors, particularly in<br />
Table 7 Mining (-10.6%), Construction (-7.9%) and -<br />
Gross Domestic Product 7.2% in Electricity. In the case of Construction<br />
Third Quarter (Annual % Change) the rate of decline was the highest since the<br />
fourth quarter of 2003. Communications,<br />
Communications<br />
Government General Services<br />
2008<br />
13.9<br />
4.1<br />
2009<br />
11.8<br />
2.4<br />
<strong>2010</strong><br />
9.4<br />
3.2<br />
Government Services and Transportation<br />
increased by 9.4%, 3.2% and 2.7%<br />
Transportation & Warehousing<br />
Manufacturing<br />
0.5<br />
-0.3<br />
-10.7<br />
-9.1<br />
2.7<br />
0.1 respectively. The growth of the Transportation<br />
Social and Common Services<br />
Real Estate and Services provided<br />
Non Oil Sector<br />
9.6<br />
1.6<br />
3.9<br />
3.8<br />
-2.9<br />
-3.1<br />
0.0<br />
-0.1<br />
-0.2<br />
sector was in notable contrast to the 10.7%<br />
drop in the same period of 2009 (See Table<br />
TOTAL 3.8 -4.6 -0.4 7). Figure 13 allows the differences in<br />
Others absolute terms between the non-oil activity as<br />
a whole and its component sectors.<br />
1/<br />
At 1997 Prices<br />
6.4 0.2 -1.0<br />
Oil Sector 4.4 -9.6 -2.1<br />
Commerce & Repair Services 1.9 -11.0 -4.4<br />
Finance & Insurance -5.1 -3.6 -5.0<br />
Electricity & Water 9.5 4.0 -7.8<br />
Construction 3.7 1.8 -7.9<br />
Mining 0.9 -18.3 -10.6<br />
Note: The activities were ordered in accordance with the highest growths recorded in the third quarter of <strong>2010</strong>. 1/ Private<br />
Agriculture, Restaurants & Hotels and Public Activities.<br />
Source: Central Bank of Venezuela and Own Calculations<br />
On an institutional basis, the BCV reported<br />
that the product of the public sector fell for the<br />
fifth consecutive quarter, although only by<br />
0.1%, 140 basis points less than in the<br />
preceding quarter and 30 basis points lower than in the
same quarter of the previous year. In the case of the<br />
private sector, it fell 0.7% compared to the same period of<br />
2009, for the lowest such fall in the last six quarters.<br />
The notable decrease in the rate of decline of the non-oil<br />
activity can be explained in part by the performance of the<br />
Aggregate Internal Demand (AID) which grew by 4.1%<br />
after falling for five consecutive quarters, in contrast with<br />
the 0.9% fall in the preceding quarter and with the 10.9%<br />
decline in the same quarter of last year. The rise in the<br />
Aggregate Internal Demand is the result of the increases in<br />
the Gross Formation of Fixed Capital and of Government<br />
Consumption.<br />
Private Consumption represented 57,1% of AID but<br />
declined by 2.1% for 30 basis points less than the<br />
contraction in the second quarter and 240 basis points<br />
lower than the decline in the third quarter of 2009. The<br />
Gross Formation of Fixed Capital represents 25% of AID<br />
but after the five consecutive quarters of decrease it rose<br />
by 4.4% while in the same period of 2009 it dropped by<br />
13.6%. Government Consumption continued to rise,<br />
currently at the highest rate in the last seven quarters<br />
when it reached 3.4%, the highest increase from fourth<br />
quarter in 2008.<br />
On the other hand, External Demand (ED) contracted by<br />
17.6%, down to its minimum in real terms and – excluding<br />
the first quarter of 2003 – the lowest level on record since<br />
this series became available in 1998 (See Table 8).<br />
Table 8<br />
Aggregate Demand and Gross Domestic Product<br />
Third Quarter (Annual % Change)<br />
2009 <strong>2010</strong><br />
1. Final Consumption -3.3% -1.1%<br />
Public Sector 2.6% 3.4%<br />
Private Sector -4.5% -2.1%<br />
2. Gross Fixed Capital Formation -13.6% 4.4%<br />
3. Domestic Aggregate Demand 1/<br />
At 1997 Prices<br />
-10.9% 4.1%<br />
4. Exports -15.0% -17.6%<br />
5. Minus: Imports -25.5% 6.3%<br />
6. Gross Domestic Product (3+4+5)<br />
Note: 1/ includes the variation of stocks.<br />
Source: Central Bank of Venezuela and Own Calculations<br />
-4.6% -0.4%<br />
11<br />
LABOR MARKET<br />
The National Statistical Institute reported that the average<br />
rate of un-employment in the first nine months of <strong>2010</strong> was<br />
8.8%, 80 basis points higher than in the same period of<br />
2009 (8%) and the highest since the comparable period of<br />
2007.<br />
This result is due to the 10.8% increase in the unemployed<br />
population during the first nine months of this year, nearly<br />
400 basis points higher than the 6.9% increase during the<br />
same period of last year and the highest since 2003. The<br />
average number of unemployed persons during the current<br />
year came to 1,146,170 while the economically active<br />
population only increased by 1.6% during the same period.<br />
On the other hand, the average number of employed<br />
persons during the first nine months of this year rose only<br />
by 0.8%, 130 basis points below the increase recorded in<br />
the same period of 2009 and the lowest since the same<br />
period in 2003, indicating the depth of the economic<br />
recession.<br />
Employment in the public sector during the same period<br />
increased merely by 59,391 (2.6%) for the lowest rise<br />
since 2003 and 530 basis points less than the growth<br />
recorded in the first nine months of 2009. Employment in<br />
the private sector increased by a mere 38,048 (0.4%), 40<br />
basis points less than the increase of the first nine months<br />
of 2009 (0.8%), again the lowest since 2003. The<br />
participation of the public sector in the total employed<br />
population has grown every year for the last seven years,<br />
moving from 14.1% in the first nine months of 2003 to<br />
19.3% in the same period of the present year.<br />
The informal sector of the economy provided the strongest<br />
growth within the employed population, for a 1.6%<br />
increase compared to the same period of 2009. During the<br />
same period employment in the formal sector of the<br />
economy only increased by 0.2%. However, the
participation in the formal sector remained relatively stable,<br />
falling only by 30 basis points - to a total of 56.1%<br />
compared again to the same nine month period of 2009.<br />
The Central Bank reported that the Index of<br />
Remunerations in the formal sector of the economy for the<br />
third quarter of the current year increased by 21.7%,<br />
similar to the second quarter. However, after adjusting for<br />
inflation the Index in real terms discloses a 6.3% fall in<br />
average remunerations which have declined for eleven<br />
consecutive quarters, the level registered in the third<br />
quarter of the current year being the lowest ever in real<br />
terms for any third quarter.<br />
25%<br />
20%<br />
15%<br />
10%<br />
5%<br />
0%<br />
-5%<br />
-10%<br />
-15%<br />
-20%<br />
-25%<br />
-30%<br />
12<br />
III-02<br />
I03<br />
III-03<br />
I04<br />
III-04<br />
I05<br />
III-05<br />
I06<br />
III-06<br />
I07<br />
III-07<br />
I08<br />
Figure 14<br />
Wage Index<br />
Annual % Change<br />
III-08<br />
I09<br />
General<br />
Private<br />
Public<br />
III-09<br />
I10<br />
III-10<br />
Source: Central Bank of Venezuela and Own Calculations<br />
The highest increase of the Remunerations Index took<br />
place in the private sector, by 27.4%. However, in real<br />
terms this adjustment translates into a negative 1.8%.<br />
Remunerations in the public sector were up 9.9%, for the<br />
lowest rate of increase since the third quarter of 2003.<br />
After adjusting for inflation, it is found that in this case<br />
there has been a year-to-year quarterly decline for the<br />
eighth consecutive quarter. Specifically, the Index fell by<br />
15.3% in real terms in the third quarter of <strong>2010</strong> compared<br />
to the same period of 2009 (See Figure 14). When<br />
remunerations are compared between the public and the<br />
private sector, it is found that remunerations in the public<br />
sector continue at higher levels than in the private sector. It<br />
should be noted however that after nearly a decade (1998-<br />
2007) of higher salary increases in the public sector this<br />
tendency started to revert at the end of 2007. At that time<br />
average remunerations in the public sector were 38.3%<br />
higher than in the private sector, but the difference is now<br />
down to 11.4%.<br />
PRICES<br />
In <strong>October</strong> <strong>2010</strong> the National Consumer Price Index (CPI)<br />
accelerated after the slowdown recorded in September. In<br />
<strong>October</strong> <strong>2010</strong> the CPI rose by 1.5%, i.e. by 40 basis points<br />
over September, although it was 40 basis points lower<br />
than in <strong>October</strong> 2009. On a year-to-date basis, inflation<br />
rose by 23%, 270 basis points above the level recorded in<br />
the first ten months of 2009. A number of factors<br />
contributed to inflation during the first ten months of <strong>2010</strong>:<br />
the modification of the exchange rate, lower supply of local<br />
products, a slower rate of CADIVI authorizations for the<br />
acquisition of foreign exchange, and the eventual complete<br />
shutdown of the parallel exchange market, etc.<br />
The rate of inflation speeded up in all of the eleven cities<br />
included in the monthly survey. On a year-to-date basis, in<br />
only three cities was inflation found to exceed the national<br />
average, namely Valencia (24.4%), Caracas (23.7%) and<br />
Maturin (23.4%). The lowest prices were found in San<br />
Cristóbal and Mérida (20.5% and 22.1%) respectively, but<br />
never much below the national average of 23%. Figure 15<br />
shows the differences between the rates of inflation in the<br />
various cities compared with the national average.<br />
Figure 15<br />
Absolute deviation of cumulated inflation up to <strong>October</strong><br />
with respect to the national average<br />
National Rest<br />
San Cristóbal<br />
Maturín<br />
Mérida<br />
Maracaibo<br />
Caracas<br />
1.5%<br />
0.9%<br />
0.3%<br />
-0.3%<br />
-0.9%<br />
-1.5%<br />
-2.1%<br />
-2.7%<br />
Maracay<br />
Ciudad Guayana<br />
Valencia<br />
Barquisimeto<br />
Pto La Cruz / Barcelona<br />
Cumulated Inflation by Cities National Cumulated Inflation<br />
Source: Central Bank of Venezuela and Own Calculations
Inflation increased in six of the thirteen groups considered<br />
for the monthly study. The highest rates of increase<br />
occurred in Alcoholic Beverages and Tobacco (2.9% vs.<br />
1%), Food and Non-Alcoholic Beverages (1.6% vs. 0.3%)<br />
and Home Rentals (1.1 vs. 0.8%). During the first ten<br />
months of the current year the prices of five of the 13 items<br />
used for the Index increased at higher rates than the<br />
national average. These items represent about 54% of the<br />
total, as follows: Alcoholic Beverages and Tobacco<br />
(33.6%), Food and Non-Alcoholic Beverages (29.2%),<br />
Entertainment and Culture (25.6%), Diverse Goods and<br />
Services (24.4%) and Restaurants and Hotels (23.7%)<br />
(See Table 9).<br />
Core Inflation, which excludes seasonal changes and<br />
price-controlled items, increased by 1.7% in <strong>October</strong> <strong>2010</strong>,<br />
for a total increase during the first ten months of 22.6%,<br />
only 40 basis points below the 23% of the National Index.<br />
To be noted is that during the same period of 2009 the<br />
National Inflation Index was considerably higher – by 410<br />
basis points - than the Core Inflation.<br />
The CPI in the Caracas area rose by 1.5% in <strong>October</strong> after<br />
five consecutive months of deceleration, for an increase of<br />
20 basis points over September and reaching 23.7% for<br />
the first ten months of the year and 70 basis points above<br />
the level in the same period of last year.<br />
Five of the 13 groups used to compile the price index had<br />
higher prices than the national index of 1.5%, namely<br />
13<br />
Alcoholic Beverages and Tobacco (2.4%), Various Goods<br />
and Services (2.1%), Food and Non-Alcoholic Beverages<br />
(1.9%), Clothing and Footwear (1.8%), and Health (1.6%).<br />
It is of interest that the increase of prices for Food and<br />
Non-Alcoholic Beverages registered in <strong>October</strong> followed a<br />
0.1% price decrease in September.<br />
Core Inflation at 1.6% exceeded the national CPI for the<br />
sixth consecutive month, although barely 10 basis points<br />
over the level of September. The rates of Core Inflation<br />
have been gradually approaching the national index. In<br />
<strong>October</strong> <strong>2010</strong> the difference between the CPI and the Core<br />
Inflation was down to 60 basis points, compared to 662<br />
basis points of difference in <strong>October</strong> 2009.<br />
26%<br />
24%<br />
22%<br />
20%<br />
18%<br />
16%<br />
14%<br />
12%<br />
10%<br />
Figure 16<br />
CPI-Metropolitan Area of Caracas by Income levels<br />
% Change Accumulated to <strong>October</strong><br />
2003<br />
2004<br />
2005<br />
Level I<br />
Level IV<br />
2006<br />
Table 9<br />
Inflation by Sector<br />
% Change Accumulated to <strong>October</strong><br />
National Barquisimeto Barcelona Caracas Ciudad Guayana Maracaibo Maracay Maturín Mérida San Cristóbal Valencia Rest 1/<br />
GENERAL INDEX 23.0 22.4 22.8 23.7 22.5 23.0 22.8 23.4 22.1 20.5 24.4 22.9<br />
Foodstuffs & Non-Alcoholic Beverages 29.2 27.0 27.8 30.1 28.5 30.3 30.2 30.1 30.2 26.7 30.9 28.8<br />
Alcoholic Beverages & Tobacco 33.6 34.8 34.3 39.3 33.3 34.4 34.2 33.1 35.2 31.9 31.6 31.5<br />
Clothing & Footwear 12.1 12.7 11.2 14.7 10.5 13.6 10.1 11.9 13.3 10.2 16.0 11.0<br />
Housing Rent 9.7 9.6 12.3 9.7 11.0 9.2 9.7 10.6 12.0 11.7 11.5 9.3<br />
House Services (excluding Phone Services) 8.3 9.9 10.3 4.7 10.1 -0.3 13.8 13.3 11.5 15.2 13.7 11.1<br />
Home Equipment 20.9 19.6 20.4 26.2 19.7 24.8 19.6 18.7 14.9 17.3 18.2 18.6<br />
Health 21.6 18.4 24.0 22.3 21.5 26.8 18.4 29.4 28.0 18.8 23.3 18.9<br />
Transportation 22.7 25.4 26.6 24.1 21.8 16.3 25.4 19.6 23.8 20.6 29.8 22.1<br />
Communications 5.9 6.7 6.4 6.0 6.2 6.5 5.4 6.8 5.1 4.6 5.9 5.5<br />
Culture 25.6 28.5 19.1 24.3 19.6 20.4 20.5 19.4 23.1 17.3 21.8 29.5<br />
Education Services 21.7 20.3 20.3 23.9 24.0 24.1 17.9 19.5 20.9 20.0 19.7 18.9<br />
Restaurants & Hotels 23.7 21.0 21.0 25.5 18.4 22.4 19.7 25.4 21.2 22.1 22.5 24.4<br />
Other Good and Services 24.4 23.6 25.7 25.3 24.6 26.1 24.8 25.0 25.7 20.4 25.1 23.4<br />
Note: 1/ Include a representative sample of 74 localities (cities small medians and, as well as rural areas).<br />
Source: Central Bank of Venezuela and Own Calculations<br />
2007<br />
2008<br />
2009<br />
<strong>2010</strong><br />
Note: Levels I and IV correspond to households<br />
with lower and higher income, respectively.<br />
Source: Central Bank of Venezuela and Own Calculations<br />
In terms of level of income, the key item is Food and Non-<br />
Alcoholic Beverages which is not only the principal<br />
component of the price index but also causes the greatest<br />
impact on the low-income sectors. Inflation in <strong>October</strong> on<br />
Level 1 (the quartile of homes with the lowest incomes)<br />
was 1.8% while the effect on Level 4 the quartile of homes
with the highest incomes was only 1.4%. Cumulative<br />
inflation during the first ten months in Level 1 was 22.4%,<br />
223 basis points higher than the same quarter in 2009 and<br />
the highest rate of year-to-date inflation since 2008, when<br />
it reached 24.9% (See Figure 16). On the other hand, the<br />
effect of inflation on Level 4 for the ten-month period of<br />
<strong>2010</strong> was only 20.6%, 170 basis points lower than during<br />
the same period of 2009.<br />
The Diversity Index measures<br />
the availability of certain brands,<br />
forms of presentation or varieties<br />
of merchandise in Caracas.<br />
14<br />
In <strong>October</strong> of the current year this index came to a level of<br />
161, indicating only a minor improvement of 3.9% in<br />
diversity since the close of 2009 and well below the 8.8%<br />
increase in diversity in the first ten months of 2009.<br />
Finally, the government increased the prices for sale to the<br />
public of a number of price-controlled items. The principal<br />
changes are listed on Table 10.<br />
Date Official Gazettes Measures<br />
November 5, <strong>2010</strong><br />
Source: Official Gazettes of the Bolivarian Republic of Venezuela<br />
Table 10<br />
Principal price adjustments in goods under control<br />
N° 39,546<br />
NEW LEGISLATION IN THE ECONOMIC AND SECTORIAL FIELD<br />
MONTH OF OCTOBER <strong>2010</strong><br />
* An upward adjustment in the Maximum Sale Price of the<br />
following goods: White Rice Type I, II and III (1 kg) (average<br />
21.1%) and corn flour (1 kg) (23.9%).<br />
OFFICIAL GAZETTE N° DATE SUMMARY<br />
39.522 10/01/10 Regulations of Foreign Exchange transactions.<br />
39.526 10/07/10 Regulation extending by 30 banking days the period during which financial institutions are allowed to charge commissions, fees, etc.<br />
39.527 10/08/10<br />
Law approving a joint venture between Venezuela and China to develop Block Junin 4 of the Orinoco Oil Belt Law approving a joint venture between<br />
Venezuela and China to develop Block Junin 4 of the Orinoco Oil Belt.<br />
39.533 10/19/10 Regulation of mandatory deposits (encaje legal) in the Central Bank.<br />
39.538 10/26/10 Regulation of mandatory deposits in the Central Bank.<br />
Source: Official Gazettes of the Bolivarian Republic of Venezuela<br />
This bulletin has been prepared by the <strong>Economic</strong> Research Management, by <strong>Mercantil</strong> C.A., (<strong>Banco</strong> Universal), coordinated by<br />
Francisco Vivancos Cabello.<br />
<strong>Economic</strong> Research team: Inés Fasanaro, Andreas Faust, Gema Murillo, Carmen J. Noguera, Leonardo Vera.<br />
The opinions expressed in this bulletin are responsibility of the authors and do not necessarily express the opinion of the institution.<br />
Edificio <strong>Mercantil</strong>, Av. Andrés Bello, N° 1-Zip Code N°789 - Caracas 1010A. Venezuela.<br />
Legal Deposit: 83-0181. Vol 32, N° 07.
15<br />
ECONOMIC INDICATORS 2007 2008 2009 Jul-10 Aug-10 Sep-10 Oct-10 Nov-10 % Change % Change<br />
EXTERNAL SECTOR Accumulated 12 Months<br />
Volume of Production of Crude (thousands of barrels) 2,413<br />
2,353<br />
2,181<br />
2,195<br />
2,200<br />
2,190<br />
2,200<br />
2,180<br />
-1.8% -1.8%<br />
Price West Texas Intermediate (WTI) (US$/bl) 72.2<br />
99.9<br />
61.7<br />
76.1 77.0 75.2 81.9 84.1 12.8 % 7.7 %<br />
Venezuelan Oil Basket Price (US$/bl) 64.6<br />
86.4<br />
56.9<br />
67.3 68.9 68.0 74.3 77.0 11.6 % 6.3 %<br />
OPEC Price (US$/bl) 69.1<br />
94.4<br />
60.7<br />
72.4 74.3 74.4 79.8 82.6 11.7% 8.4%<br />
Non Traditional Exports (Million of US$) 16,964<br />
5,426<br />
2,380<br />
200<br />
150 221 -3.5% -3.5%<br />
Imports 1/ (Million of US$) 41,911 45,128 36,908<br />
2,942<br />
2,998<br />
3,075<br />
18.1% -6.2%<br />
Gross International Reserves (Million of US$) 33,477 42,299 35,000 27,389 28,234 28,618 29,033<br />
27,135 -22.5% -16.6%<br />
Priority Imports Exchange Rate (Bs./US$) 2.15<br />
2.60<br />
2.60<br />
2.60<br />
2.60<br />
2.60<br />
20.9% 20.9%<br />
Non-Priority Imports "Oil Dollar" Exchange Rate (Bs./US$) 2.15<br />
2.15<br />
2.15<br />
4.30<br />
4.30<br />
4.30<br />
4.30<br />
4.30<br />
REAL SECTOR<br />
Sales Volume Index 196.0<br />
216.6<br />
192.6<br />
171.6<br />
174.1<br />
174.6<br />
-30.3% -5.3%<br />
Wholesale 140.5<br />
143.3<br />
122.1<br />
131.9<br />
136.6<br />
143.0<br />
18.7% 13.4%<br />
Detail 233.2<br />
265.7<br />
239.8<br />
198.3<br />
199.2<br />
195.8<br />
-42.0% -12.3%<br />
Automotive Vehicles 245.3<br />
189.8<br />
127.4<br />
75.4<br />
80.1<br />
79.9<br />
-30.5% -14.8%<br />
Parts, Pieces & Accessories of Automotive Vehicles 142.1<br />
171.7<br />
149.5<br />
144.6<br />
163.7<br />
150.2<br />
-0.5% 2.6%<br />
Fuels for Automotive Vehicles 116.3<br />
128.9<br />
180.7<br />
167.4<br />
169.5<br />
167.0<br />
-42.1% 10.1%<br />
Foods, Beverages & Tobacco in Non-Specialized Storehouses 312.4<br />
337.0<br />
324.2<br />
260.6<br />
246.7<br />
237.0<br />
-43.5% -19.8%<br />
Other Products in Non-Specialized Storehouses 105.6<br />
159.1<br />
247.7<br />
176.8<br />
175.6<br />
164.6<br />
-54.2% -24.2%<br />
Foods, Beverages & Tobacco in Specialized Storehouses 229.6<br />
248.7<br />
217.4<br />
201.9<br />
208.0<br />
195.6<br />
-3.6% -9.5%<br />
Pharmaceutical & Medicinal Products, Cosmetic & Toiletries 302.4<br />
401.7<br />
409.3<br />
303.7<br />
307.6<br />
294.1<br />
-23.1% -30.2%<br />
Textile Products, Apparel, Footwear & Leather's Articles 327.2<br />
490.8<br />
394.4<br />
316.6<br />
332.8<br />
360.3<br />
-55.9% -4.6%<br />
Articles & Equipment of Domestic Use 433.5<br />
608.1<br />
490.7<br />
379.6<br />
408.9<br />
308.2<br />
-60.6% -30.8%<br />
Articles of Ironworks, Paintings & Products of Glass 97.7<br />
107.2<br />
99.8<br />
82.3<br />
82.8<br />
92.6<br />
2.3% -13.4%<br />
Other Products in Specialized Storehouses 83.5<br />
85.8<br />
90.0<br />
100.0<br />
102.1<br />
110.6<br />
-31.6% 20.0%<br />
Volume Index of Private Manufacturing Industry 123.9<br />
125.6<br />
110.7<br />
109.7<br />
117.0<br />
118.1<br />
28.5 % 3.2 %<br />
MONETARY AGGREGATES<br />
Liquidity (M2) 153,225 194,275 235,401 257,084 258,811 261,114 262,272 278.006 *****/ 18.1% 20.0%<br />
Currency & Demand Deposits (M1) 98,069 124,036 155,269 180,929 183,150 184,581 187,281 198.405 *****/ 27.8% 33.4%<br />
Monetary Base 64,177 83,787 98,903 107.264 */ 104.679 **/ 107.505 ***/ 100.567 ****/ 108.272 *****/ 9.5% 22.4%<br />
Net International Reserves 70,524 89,048 74,544<br />
Net National Treasury Agency (13,879) (9,474) (3,488)<br />
PDVSA (1,181)<br />
(351) (6,091)<br />
Other Net Public Sector Accounts (10,132) 2,624<br />
919<br />
Financial Sector 2<br />
161<br />
3<br />
Credit Instruments Placed by BCV (12,663) (23,041) (7,563)<br />
Capital & Other Net Accounts 13,989 17,477 38,354<br />
MONETARY MARKET<br />
Awarded Repos 27,531<br />
795 12,190<br />
3,600 3,118 2,481 2,910 1,909 149.2 % 22.5 %<br />
Awarded CDs 281,332 179,520 168,813<br />
6,433 6,525 6,669 4,887 6,051 -59.0% -20.0%<br />
Awarded Repos+CDs (Average Weekly) 5,940<br />
3,468<br />
3,481<br />
2,389 2,192 2,080 2,052 1,895 -36.9% 3.9%<br />
Purchases DPN (Average Weekly) 101<br />
586<br />
461<br />
872 998 798 839 977 59.7% -7.1%<br />
Outstanding Repos -<br />
-<br />
2,653<br />
3,204 3,284 2,829 2,725 3,130 18.0% 61.9%<br />
Outstanding CDs 12,613 22,715<br />
7,584<br />
9,318 7,887 8,876 6,572 6,653 -12.3% -25.3%<br />
Average Effective Returns Repos 7.70<br />
6.50<br />
6.27<br />
6.1 6.3 6.0 6.4 6.1 (3.9)<br />
0.1<br />
Average Effective Returns CDs 9.79<br />
12.34<br />
8.97<br />
6.3 6.4 6.2 6.3 6.2 (4.8) (17.1)<br />
COMMERCIAL & UNIVERSAL BANKS<br />
Credit Portfolio 102,542 101,171 139,067 150,307 155,058 156,211 158,679 161.471 ******/ 16.1 % 13.8 %<br />
Investments 47,192 59,049 59,445 81,855 80,291 87,831 58,213 59.283 ******/ -0.3% -13.0%<br />
Total Deposits 141,969 175,984 184,977 218,575 221,043 222,576 213,338 208.561 ******/ 12.7% 7.6%<br />
Demand Deposits 88,210 106,763 115,498 151,607 154,109 154,748 151,135 146.534 ******/ 26.9% 23.5%<br />
Saving Deposits 35,289 45,777 47,996 53,755 53,399 54,081 50,550 50.889 ******/ 6.0% 6.1%<br />
Term Deposits 18,469 23,444 21,483 13,213 13,534 13,747 11,653 11.138 ******/ -48.2% -59.1%<br />
INTEREST RATES<br />
Overnight (Min - Max) 0,1-121,0 0,01-56,0 0,01-38,0 0,2-3,5 0,1-10,0 0,5-20,0 0,1-18,0 3,0-16,0 - -<br />
Overnight (Average) 7.74<br />
10.15<br />
9.30<br />
2.16 2.59 10.09 12.83 11.53 (60)<br />
(728)<br />
Loans (6 Main Banks) 16.77<br />
22.77<br />
20.61<br />
17.73 17.97 17.43 17.70 18,02 *****/ (92)<br />
(82)<br />
90 Days Deposits (6 Main Banks) 10.89<br />
16.55<br />
15.57<br />
14.95 14.58 14.77 15.05 14,91 *****/ (9)<br />
(34)<br />
Libor 90 Days 5.26<br />
2.79<br />
0.65<br />
0.45 0.30 0.29 0.29 0.30 5<br />
4<br />
CENTRAL GOVERNMENT 2/<br />
Ordinary Revenues 141,333 166,098 151,525 10,410 12,923 17,243 11,973<br />
19,206 16.3 % 96.2 %<br />
Oil Ordinary Revenues 71,569 82,432 53,231<br />
2,524<br />
6,103<br />
7,376<br />
1,697<br />
9,445<br />
1.1% 356.7%<br />
Tax Income 19,945 17,834 12,944<br />
574<br />
783<br />
856<br />
1,059<br />
775 -17.8% -13.7%<br />
Royalties 46,093 60,298 35,987<br />
1,107<br />
4,501<br />
3,585<br />
522<br />
8,484<br />
24.3% 624.8%<br />
Dividends 5,532<br />
4,300<br />
4,300<br />
-<br />
182<br />
1,508<br />
-60.7%<br />
Non-Oil Ordinary Revenues 69,764 83,666 98,295<br />
7,886<br />
6,819<br />
9,867 10,276<br />
9,760<br />
26.0% 26.4%<br />
Net Seniat 60,451 73,168 80,011<br />
7,886<br />
6,819<br />
9,867 10,276<br />
9,435<br />
66.0% 22.3%<br />
Gasoline and Derivaties 704<br />
1,174<br />
756<br />
-<br />
-<br />
326<br />
39.0%<br />
Others 8,609<br />
9,324 17,527<br />
-<br />
-<br />
Ordinary Expenses 126,462.1 174,132.8 187,134.6 20,259 18,520 14,379 14,091<br />
32,645<br />
-0.9% 36.0%<br />
Financial Surplus or Deficit 14,871 (8,034) (35,609) (9,850) (5,597) 2,864 (2,118) (13,439) -12.3% -5.5%<br />
Efective Placements of DPN+Treasury Bills 10,548<br />
4,053 28,301<br />
5,356<br />
3,329<br />
4,505<br />
3,061<br />
4,208<br />
63.2% 81.2%<br />
Net Borrowing Bonds DPN 2,365 (5,790) 14,557<br />
4,096<br />
1,943<br />
2,309<br />
1,981<br />
2,810<br />
89.1% 176.2%<br />
Net Borrowing Treasury Bills<br />
Public Debt Securities Average Effective Yields<br />
(1,245)<br />
(90) 2,314<br />
(338)<br />
-714 -910 (135)<br />
102 -26.2% -228.7%<br />
60-360 Days 9.84<br />
361-1080 Days 15.52<br />
12.59<br />
14.19 (1,388) (1,419)<br />
1081-1800 Days 11.86<br />
16.58<br />
12.62<br />
16.11 15.95 16.32 16.99 17.08 1,708<br />
826<br />
1801-2520 Days 7.55<br />
11.87<br />
18.98 18.47 18.40 18.46 18.48 1,848 1,848<br />
2521-3240 Days<br />
3241-5760 Days<br />
7.45<br />
8.48<br />
Treasury Bills Average Yield<br />
60-80 Days<br />
81-110 Days<br />
111-150 Days<br />
8.98<br />
11.52<br />
10.39<br />
8.43 8.58 8.88 8.30 8.19 (155) (156)<br />
151-180 Days 9.69<br />
181-269 Days 11.12<br />
8.53 8.55 8.61 (1,067) (1,074)<br />
PRICE INDEX (CARACAS)<br />
Consumer 22.5<br />
31.9<br />
26.9<br />
1.6 1.4 1.3 1.5 1.3 25.3% 26.9 %<br />
Foods & Non Alcoholic Beverages 30.9<br />
46.7<br />
20.4<br />
0.9 0.9 (0.1) 1.9 0.9 31.3 % 33.1 %<br />
Alcoholic Beverages & Tobaccos 78.1<br />
28.3<br />
47.7<br />
3.1 4.5 1.7 2.4 4.7 45.9 % 47.8 %<br />
Apparel & Footwear 19.1<br />
18.8<br />
22.1<br />
1.2 0.1 2.3 1.8 1.2 16.1 % 17.9 %<br />
House Rent 5.7<br />
7.0<br />
16.1<br />
0.9 0.0 0.8 1.0 0.4 10.1 % 11.7 %<br />
Household Services (excluding Phone Services) 1.8<br />
5.5<br />
3.9<br />
(0.1) 1.6 1.0 (0.2) (0.3) 4.4 % 5.1 %<br />
Home Equipment 22.2<br />
34.7<br />
39.2<br />
0.7 1.4 1.0 0.9 1.5 28.1 % 30.3 %<br />
Health 28.3<br />
26.9<br />
34.3<br />
2.5 1.7 1.2 1.6 0.8 23.2 % 23.7 %<br />
Transport 17.7<br />
29.9<br />
30.5<br />
1.1 2.0 0.9 1.4 1.0 25.4 % 26.7 %<br />
Communications (5.8)<br />
7.3<br />
9.4<br />
0.3 0.7 1.0 0.1 0.3 6.4 % 6.7 %<br />
Culture 16.9<br />
25.1<br />
26.9<br />
3.0 1.6 2.4 0.4 1.6 26.3 % 28.1 %<br />
Educational Services 7.3<br />
28.5<br />
29.4<br />
2.8 0.0 11.9 0.8 0.6 24.7 % 24.7 %<br />
Restaurants & Hotels 42.8<br />
49.6<br />
33.6<br />
3.2 1.8 1.7 1.3 3.1 29.4 % 31.4 %<br />
Miscellaneous Goods & Services 24.7<br />
37.8<br />
50.7<br />
3.0 2.7 1.7 2.1 1.5 27.2 % 30.8 %<br />
Core Inflation 3/<br />
Index 1997 = 100<br />
Million of Bs.<br />
Million of Bs.<br />
Million of Bs.<br />
Million of Bs.<br />
28.3<br />
33.8<br />
34.6<br />
2.1 1.7 1.7 1.6 2.3 27.0 % 29.3 %<br />
Private Manufacturing Production 14.9<br />
25.2<br />
26.5<br />
0.8 0.7 0.9 0.8 1.6 21.2 % 22.3 %<br />
Wholesale 17.2<br />
32.4<br />
24.8<br />
1.3<br />
0.9<br />
0.7<br />
0.7<br />
1.2 23.3 % 24.1 %<br />
National 18.0<br />
36.7<br />
22.2<br />
1.2<br />
1.0<br />
0.7<br />
0.8<br />
1.2 24.8 % 25.5 %<br />
Imported 14.6<br />
17.1<br />
35.7<br />
2.0<br />
0.6<br />
0.8<br />
0.4<br />
1.1 17.9 % 18.9 %<br />
Construction Materials (Wholesales) 15.2<br />
23.3<br />
18.7<br />
1.0<br />
0.6<br />
0.6<br />
0.3<br />
0.1<br />
17.6% 18.7 %<br />
LABOR MARKET<br />
Second Half Percentage Percentage<br />
Unemployment Rate 7.5<br />
6.9<br />
7.5<br />
8.7 9.6 8.4 9.0 243 90<br />
Activity Rate 65.0<br />
65.2<br />
65.0<br />
64.5 65.1 65.5 65.0 (123) (94)<br />
Formal Occupation 56.0<br />
56.6<br />
56.0<br />
55.0 56.6 56.4 123 1<br />
Public Sector Occupation 17.1<br />
18.1<br />
19.7<br />
18.9 19.4 19.5 4 26<br />
Notes: */ As of 07/30/10, **/ As of 08/27/10, ***/ As of 09/24/10, ****/ As of 10/29/10, *****/ As of 11/26/10, ******/ As of 11/12/10<br />
1/ Data from trade are from the National Institute of Statistics. Imports do not include oil the oil sector.<br />
2/ Data from the Central Bank of Venezuela.<br />
3/ Core Inflation: Excludes from the Consumer Price Index those goods subject to seasonal factors and price controls.<br />
Source: Ministry of Finance, Central Bank of Venezuela, Reuters, National Statistics Institute, Bloomberg and Own Calculations
Notes: Y o Y: Change of the month with respect to the same month of the previous year. The Emerging Markets Bond Index Plus (EMBI+) tracks total returns for traded external<br />
debt instruments in the emerging markets. The instruments include external-currency-denominated Brady bonds, loans and Eurobonds, as well as U.S. dollar local markets<br />
instruments. Five Year Average Range: Average of the minimum and maximum values of the previos five years. */ As of 11/26/<strong>2010</strong><br />
Source: Central Bank of Venezuela, Reuters, Bloomberg, National Statistics Institute, Ministry of Energy & Oil, Cavenez, International Monetary Fund, OPSIS and Own<br />
Calculations<br />
16<br />
Oil Price<br />
(US$/b)<br />
147<br />
126<br />
105<br />
84<br />
63<br />
42<br />
21<br />
Sovereign Spreads.Diferencials EMBI+<br />
Basic Points<br />
1,800<br />
1,500<br />
1,200<br />
900<br />
600<br />
300<br />
0<br />
Nov-05<br />
Nov-05<br />
May-06<br />
May-06<br />
Venezuela<br />
WTI<br />
Nov-06<br />
Nov-06<br />
May-07<br />
International Reserves and Macroeconomic<br />
Stabilization Fund (Million of US$)<br />
48,000<br />
40,000<br />
32,000<br />
24,000<br />
16,000<br />
8,000<br />
0<br />
Nov-05<br />
May-06<br />
Nov-06<br />
May-07<br />
Venezuela<br />
Mexico<br />
Colombia<br />
Brazil<br />
May-07<br />
Monetary Aggregates<br />
% Change Y o Y<br />
120<br />
100<br />
80<br />
60<br />
40<br />
20<br />
0<br />
Nov-05<br />
May-06<br />
Nov-07<br />
Nov-07<br />
May-08<br />
May-08<br />
Nov-08<br />
Macroeconomic Stabilization Fund<br />
International Reserves<br />
Nov-06<br />
May-07<br />
Nov-07<br />
Nov-07<br />
May-08<br />
May-08<br />
Nov-08<br />
Nov-08<br />
Nov-08<br />
May-09<br />
May-09<br />
May-09<br />
Nov-09<br />
Nov-09<br />
Nov-09<br />
May-10<br />
May-10<br />
<strong>Economic</strong> Indicators<br />
May-10<br />
Liquidity (M2)<br />
Monetary Base<br />
May-09<br />
Nov-09<br />
May-10<br />
Nov-10<br />
Nov-10<br />
Nov-10<br />
Nov-10 */<br />
147<br />
126<br />
105<br />
84<br />
63<br />
42<br />
21<br />
48,000<br />
40,000<br />
32,000<br />
24,000<br />
16,000<br />
8,000<br />
0<br />
1,800<br />
1,500<br />
1,200<br />
900<br />
600<br />
300<br />
0<br />
120<br />
100<br />
80<br />
60<br />
40<br />
20<br />
0<br />
27<br />
24<br />
21<br />
18<br />
15<br />
12<br />
9<br />
NTE<br />
2,500<br />
2,100<br />
1,700<br />
1,300<br />
900<br />
500<br />
100<br />
9<br />
6<br />
3<br />
0<br />
-3<br />
-6<br />
-9<br />
-12<br />
-15<br />
Sep-05<br />
Sep-05<br />
Mar-06<br />
Mar-06<br />
Imports<br />
Non Traditional Exports<br />
Sep-06<br />
Sep-06<br />
Mar-07<br />
Mar-07<br />
Sep-07<br />
Sep-07<br />
Non Traditional Exports (NTE) &<br />
Imports (MMUS$)<br />
Mar-08<br />
Mar-08<br />
Sep-08<br />
Sep-08<br />
Mar-09<br />
Mar-09<br />
Sep-09<br />
Sep-09<br />
Mar-10<br />
Mar-10<br />
Imports<br />
4,900<br />
Energy Consumption Interconected National System<br />
% Change t/t- 12<br />
56,000<br />
48,000<br />
40,000<br />
32,000<br />
24,000<br />
16,000<br />
8,000<br />
0<br />
Nov-05<br />
Nov-05<br />
May-06<br />
Imported<br />
National<br />
May-06<br />
Nov-06<br />
Loans<br />
Deposits 90 days<br />
Nov-06<br />
May-07<br />
May-07<br />
Nov-07<br />
Nov-07<br />
39569<br />
May-08<br />
Interest Rates. 6 Main Banks<br />
%<br />
Nov-08<br />
Nov-08<br />
May-09<br />
May-09<br />
Nov-09<br />
Nov-09<br />
May-10<br />
May-10<br />
Nov-10 */<br />
Sep-10<br />
Sep-10<br />
Nov-10<br />
27<br />
24<br />
21<br />
18<br />
15<br />
12<br />
9<br />
4,100<br />
3,300<br />
2,500<br />
1,700<br />
900<br />
100<br />
9<br />
6<br />
3<br />
0<br />
-3<br />
-6<br />
-9<br />
-12<br />
Sales of Vehicles<br />
Units<br />
56,000<br />
48,000<br />
40,000<br />
32,000<br />
24,000<br />
16,000<br />
8,000<br />
0
Open Market Operations<br />
Repos+CD+Purchase Under Resale Agreement. Million of Bs.<br />
Domestic Debt Stock<br />
DPN Bonds + Treasury Bills<br />
Million of Bs. Millions of US$<br />
80,000<br />
Million of Bs.<br />
24,000<br />
70,000<br />
MM of US$<br />
22,000<br />
17<br />
60,000<br />
45,000<br />
30,000<br />
15,000<br />
0<br />
-15,000<br />
-30,000<br />
-45,000<br />
-60,000<br />
60,000<br />
50,000<br />
40,000<br />
30,000<br />
20,000<br />
Nov-05<br />
Nov-05<br />
May-06<br />
May-06<br />
Nov-06<br />
Nov-06<br />
May-07<br />
May-07<br />
Nov-07<br />
Net Domestic Borrowing 1/<br />
Million of Bs.<br />
7,500<br />
6,000<br />
4,500<br />
3,000<br />
1,500<br />
0<br />
-1,500<br />
-3,000<br />
Nov-07<br />
Labor Market %<br />
and Million of Persons<br />
11.0<br />
9.5<br />
8.0<br />
6.5<br />
5.0<br />
Nov-05<br />
May-08<br />
May-08<br />
Nov-08<br />
Nov-08<br />
May-09<br />
May-09<br />
Nov-09<br />
Nov-09<br />
May-10<br />
Injection<br />
Gross Absortion<br />
Net Effect<br />
May-10<br />
<strong>Economic</strong> Indicators<br />
Nov-10<br />
Nov-10<br />
12,000<br />
8,000<br />
4,000<br />
0<br />
-4,000<br />
-8,000<br />
-12,000<br />
20,000<br />
18,000<br />
16,000<br />
14,000<br />
12,000<br />
% Million of Persons<br />
14.0<br />
Formal Occupation<br />
Unemployment Rate<br />
7.0<br />
12.5<br />
6.6<br />
Oct-05<br />
May-06<br />
Apr-06<br />
Nov-06<br />
Oct-06<br />
May-07<br />
Apr-07<br />
Nov-07<br />
Oct-07<br />
May-08<br />
Apr-08<br />
Nov-08<br />
Oct-08<br />
May-09<br />
Apr-09<br />
Nov-09<br />
Oct-09<br />
May-10<br />
Apr-10<br />
Nov-10<br />
Oct-10<br />
7,500<br />
6,000<br />
4,500<br />
3,000<br />
1,500<br />
0<br />
-1,500<br />
-3,000<br />
6.2<br />
5.8<br />
5.4<br />
5.0<br />
4.6<br />
Credit, Portfolio Investment<br />
Bs. At Dec-2007 Prices<br />
180,000<br />
Investment in Securities<br />
Loan Portfolio<br />
150,000<br />
Intermediation Index<br />
Commercial & Universal Banks<br />
% Change 2007 2008 2009 IIIQ<strong>2010</strong><br />
Total GDP 8.2% 4.8% -3.3% -0.4%<br />
Oil GDP -4.2% 2.5% -7.2% -2.1%<br />
Non-Oil GDP 9.6% 5.1% -2.0% -0.2%<br />
Private Consumption 18.7% 7.1% -3.2% -2.1%<br />
Investment<br />
(Millions US$)<br />
25.3% -3.3% -8.2% 4.4%<br />
Trade Balance 22,979 45,656 19,153 5,523<br />
Current Account 18,098 37,392 8,561 2,571<br />
Capital Account -22,153 -24,820 -14,040 -1,882<br />
Balance of Payments -5,742 9,275 -10,262 -221<br />
Note: M o M: Change of the month with respect to the month previous, 1/ Net Domestic Borrowing is calculated as the difference between placements<br />
and maturities of short-term and long-term Treasury bonds. */ (S/S-2); **/ (Q/Q-4). Source: Central Bank of Venezuela, Balance sheets of Financial Institutions, National Institute of Statistics and Own Calculations<br />
120,000<br />
90,000<br />
60,000<br />
30,000<br />
0<br />
30,000<br />
25,000<br />
20,000<br />
15,000<br />
10,000<br />
5,000<br />
0<br />
Aug-05<br />
Aug-05<br />
6<br />
5<br />
4<br />
3<br />
2<br />
1<br />
0<br />
-1<br />
Nov-05<br />
Feb-06<br />
Feb-06<br />
May-06<br />
Aug-06<br />
Aug-06<br />
Feb-07<br />
Feb-07<br />
Aug-07<br />
Ordinary Revenues<br />
Aug-07<br />
Apr-08<br />
Ordinary Expenditures<br />
% Change Inflation (Caracas)<br />
November <strong>2010</strong>: 1.3%<br />
Nov-06<br />
May-07<br />
Nov-07<br />
Feb-08<br />
May-08<br />
Oct-08<br />
Aug-08<br />
Nov-08<br />
Apr-09<br />
Feb-09<br />
Intermediation Index<br />
%<br />
65<br />
Oct-09<br />
Aug-09<br />
Apr-10<br />
Feb-10<br />
Oct-10<br />
Aug-10<br />
61<br />
57<br />
53<br />
49<br />
45<br />
41<br />
Central Government<br />
Bs. At Dec-2007 Prices<br />
Consumer Inflation<br />
Wholesale Inflation<br />
May-09<br />
Nov-09<br />
May-10<br />
Nov-10<br />
6<br />
5<br />
4<br />
3<br />
2<br />
1<br />
0<br />
30,000<br />
25,000<br />
20,000<br />
15,000<br />
10,000<br />
5,000<br />
Inflation (Caracas)<br />
% Change M o M<br />
Real Sector and External Sector<br />
0<br />
-1