kafe – Ein Python-Paket für elementare Datenanalyse im ...
kafe – Ein Python-Paket für elementare Datenanalyse im ...
kafe – Ein Python-Paket für elementare Datenanalyse im ...
Sie wollen auch ein ePaper? Erhöhen Sie die Reichweite Ihrer Titel.
YUMPU macht aus Druck-PDFs automatisch weboptimierte ePaper, die Google liebt.
<strong>kafe</strong> Documentation, Release<br />
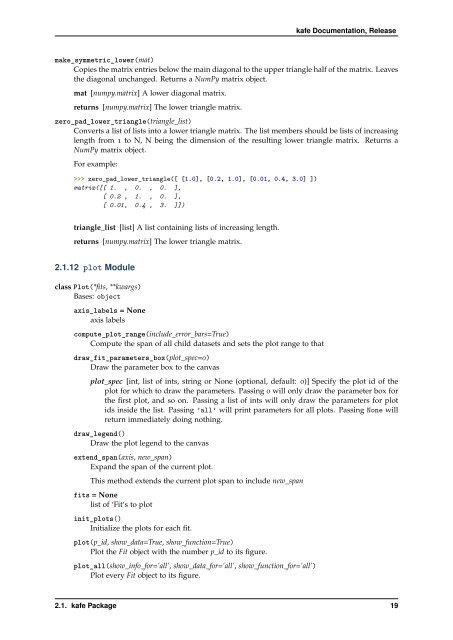
make_symmetric_lower(mat)<br />
Copies the matrix entries below the main diagonal to the upper triangle half of the matrix. Leaves<br />
the diagonal unchanged. Returns a NumPy matrix object.<br />
mat [numpy.matrix] A lower diagonal matrix.<br />
returns [numpy.matrix] The lower triangle matrix.<br />
zero_pad_lower_triangle(triangle_list)<br />
Converts a list of lists into a lower triangle matrix. The list members should be lists of increasing<br />
length from 1 to N, N being the d<strong>im</strong>ension of the resulting lower triangle matrix. Returns a<br />
NumPy matrix object.<br />
For example:<br />
>>> zero_pad_lower_triangle([ [1.0], [0.2, 1.0], [0.01, 0.4, 3.0] ])<br />
matrix([[ 1. , 0. , 0. ],<br />
[ 0.2 , 1. , 0. ],<br />
[ 0.01, 0.4 , 3. ]])<br />
triangle_list [list] A list containing lists of increasing length.<br />
returns [numpy.matrix] The lower triangle matrix.<br />
2.1.12 plot Module<br />
class Plot(*fits, **kwargs)<br />
Bases: object<br />
axis_labels = None<br />
axis labels<br />
compute_plot_range(include_error_bars=True)<br />
Compute the span of all child datasets and sets the plot range to that<br />
draw_fit_parameters_box(plot_spec=0)<br />
Draw the parameter box to the canvas<br />
plot_spec [int, list of ints, string or None (optional, default: 0)] Specify the plot id of the<br />
plot for which to draw the parameters. Passing 0 will only draw the parameter box for<br />
the first plot, and so on. Passing a list of ints will only draw the parameters for plot<br />
ids inside the list. Passing ’all’ will print parameters for all plots. Passing None will<br />
return <strong>im</strong>mediately doing nothing.<br />
draw_legend()<br />
Draw the plot legend to the canvas<br />
extend_span(axis, new_span)<br />
Expand the span of the current plot.<br />
This method extends the current plot span to include new_span<br />
fits = None<br />
list of ‘Fit‘s to plot<br />
init_plots()<br />
Initialize the plots for each fit.<br />
plot(p_id, show_data=True, show_function=True)<br />
Plot the Fit object with the number p_id to its figure.<br />
plot_all(show_info_for=’all’, show_data_for=’all’, show_function_for=’all’)<br />
Plot every Fit object to its figure.<br />
2.1. <strong>kafe</strong> Package 19


