Lineare Modelle in R: Schrittweise Modellselektion
Lineare Modelle in R: Schrittweise Modellselektion
Lineare Modelle in R: Schrittweise Modellselektion
Erfolgreiche ePaper selbst erstellen
Machen Sie aus Ihren PDF Publikationen ein blätterbares Flipbook mit unserer einzigartigen Google optimierten e-Paper Software.
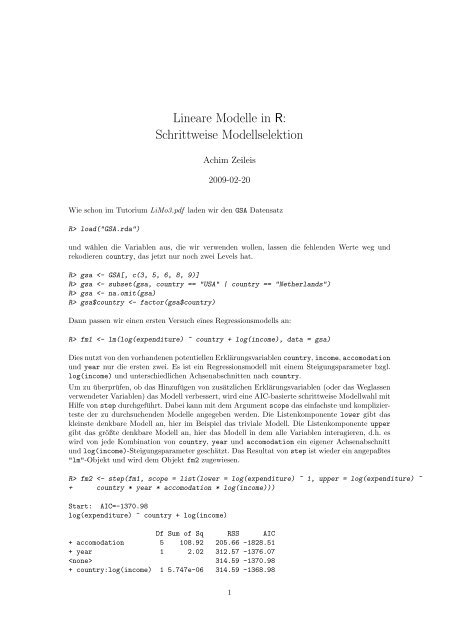
<strong>L<strong>in</strong>eare</strong> <strong>Modelle</strong> <strong>in</strong> R:<strong>Schrittweise</strong> <strong>Modellselektion</strong>Achim Zeileis2009-02-20Wie schon im Tutorium LiMo3.pdf laden wir den GSA DatensatzR> load("GSA.rda")und wählen die Variablen aus, die wir verwenden wollen, lassen die fehlenden Werte weg undrekodieren country, das jetzt nur noch zwei Levels hat.R> gsa gsa gsa gsa$country fm1 fm2
- log(<strong>in</strong>come) 1 7.48 322.07 -1347.13- country 1 118.14 432.72 -1022.26Step: AIC=-1828.51log(expenditure) ~ country + log(<strong>in</strong>come) + accomodationDf Sum of Sq RSS AIC+ year 1 0.44 205.22 -1828.87 205.66 -1828.51+ country:log(<strong>in</strong>come) 1 0.02 205.65 -1826.59+ country:accomodation 5 0.46 205.21 -1820.95+ accomodation:log(<strong>in</strong>come) 5 0.22 205.45 -1819.67- log(<strong>in</strong>come) 1 4.59 210.26 -1806.22- country 1 20.83 226.50 -1724.37- accomodation 5 108.92 314.59 -1370.98Step: AIC=-1828.87log(expenditure) ~ country + log(<strong>in</strong>come) + accomodation + yearDf Sum of Sq RSS AIC+ country:year 1 3.10 202.13 -1843.59+ year:accomodation 5 2.41 202.82 -1831.84+ year:log(<strong>in</strong>come) 1 0.50 204.72 -1829.56 205.22 -1828.87- year 1 0.44 205.66 -1828.51+ country:log(<strong>in</strong>come) 1 0.02 205.20 -1826.96+ country:accomodation 5 0.49 204.73 -1821.51+ accomodation:log(<strong>in</strong>come) 5 0.22 205.01 -1820.02- log(<strong>in</strong>come) 1 4.06 209.28 -1809.33- country 1 21.11 226.33 -1723.17- accomodation 5 107.35 312.57 -1376.07Step: AIC=-1843.59log(expenditure) ~ country + log(<strong>in</strong>come) + accomodation + year +country:yearDf Sum of Sq RSS AIC 202.13 -1843.59+ country:log(<strong>in</strong>come) 1 0.02 202.10 -1841.73+ year:log(<strong>in</strong>come) 1 0.01 202.12 -1841.63+ country:accomodation 5 0.64 201.48 -1837.09+ year:accomodation 5 0.60 201.53 -1836.86+ accomodation:log(<strong>in</strong>come) 5 0.26 201.87 -1835.01- country:year 1 3.10 205.22 -1828.87- log(<strong>in</strong>come) 1 3.58 205.71 -1826.28- accomodation 5 108.01 310.13 -1382.68Im ersten Schritt wird zunächst reportiert, daß das aktuelle Modell e<strong>in</strong> AIC von -1370.98 hat.Die H<strong>in</strong>zunahme der Variable accomodation verbessert dies sehr deutlich auf -1828.51 bei Schätzungvon weiteren 5 Parametern. Die H<strong>in</strong>zunahme von year würde auch zu e<strong>in</strong>er Verbesserungführen, jedoch nicht zu so e<strong>in</strong>er deutlichen. Dagegen würde die H<strong>in</strong>zunahme der Interaktion country:log(<strong>in</strong>come)das Modell bzgl. des AIC auf -1368.98 verschlechtern. Ebenso führt das Weglassenvon log(<strong>in</strong>come) und country zu jeweils deutlichen Verschlechterungen.Deshalb wird also accomodation <strong>in</strong> das Modell aufgenommen und dieselbe Prozedur noch e<strong>in</strong>mal2
durchgeführt. In diesem Schritt führt nur die H<strong>in</strong>zunahmen von year zu e<strong>in</strong>er Verbesserung desModells, weshalb diese Variable ebenfalls <strong>in</strong> das Modell aufgenommen wird.Im darauffolgenden Schritt führt die Interaktion country:year zu e<strong>in</strong>er Verbesserung. (Diese standvorher nicht zur Auswahl, weil der zugehörige Haupteffekt year noch nicht im Modell vertretenwar.)Im letzten Schritt kann weder die H<strong>in</strong>zunahme weiterer Interaktionen noch das Weglassen vorhandenerVariablen bzw. deren Interaktionen zu e<strong>in</strong>er Verbesserung des Modells bzgl. des AICbeitragen. Also ist die <strong>Schrittweise</strong> Modellwahl abgeschlossen. Das gewählte ModellR> summary(fm2)Call:lm(formula = log(expenditure) ~ country + log(<strong>in</strong>come) + accomodation +year + country:year, data = gsa)Residuals:M<strong>in</strong> 1Q Median 3Q Max-1.256955 -0.286229 -0.009696 0.264602 1.970420Coefficients:Estimate Std. Error t value Pr(>|t|)(Intercept) 5.74906 0.25185 22.827 < 2e-16 ***countryUSA 0.25923 0.04205 6.165 9.89e-10 ***log(<strong>in</strong>come) 0.10729 0.02442 4.394 1.22e-05 ***accomodationCamp<strong>in</strong>g -0.90674 0.03816 -23.764 < 2e-16 ***accomodationB&B -0.30279 0.04803 -6.304 4.20e-10 ***accomodationAppartment -0.56677 0.04666 -12.147 < 2e-16 ***accomodationRoom -0.44297 0.06057 -7.314 5.03e-13 ***accomodationFarm -0.36915 0.12716 -2.903 0.00377 **year1997 -0.04848 0.03446 -1.407 0.15973countryUSA:year1997 0.21715 0.05314 4.087 4.70e-05 ***---Signif. codes: 0 ’***’ 0.001 ’**’ 0.01 ’*’ 0.05 ’.’ 0.1 ’ ’ 1Residual standard error: 0.4306 on 1090 degrees of freedomMultiple R-squared: 0.5988, Adjusted R-squared: 0.5954F-statistic: 180.7 on 9 and 1090 DF, p-value: < 2.2e-16hat also e<strong>in</strong>e Steigung bzgl. log(<strong>in</strong>come) und verschiedene Achsenabschnitte bzgl. der Variablencountry, year und accomodation. Diese s<strong>in</strong>d parametrisiert über alle drei Haupteffekte sowie e<strong>in</strong>eInteraktion zwischen country und year.Zum Abschluß sollen auch wieder die angelegten Objekte aufgeräumt werden:R> remove(GSA, gsa, fm1, fm2)3


