GEBIET UND BEVÖLKERUNGSSTAND IN HESSENBevölkerungsstand 1)Kreisfreie Stadt (St.)<strong>Landkreis</strong>Geme<strong>in</strong>deFlächeam1.1.<strong>2008</strong><strong>in</strong> km 2Geme<strong>in</strong>denam31.12.<strong>2008</strong>Bevölkerung am 31.12.<strong>2008</strong><strong>in</strong>sgesamtdavonZu- bzw. Abnahme (–)31.12.<strong>2008</strong> gegenüber31.12.2007männlich weiblich Anzahl %25.5.1987WeiblicheE<strong>in</strong>wohnerE<strong>in</strong>wohnerje km 2 auf1000ammännliche31.12.<strong>2008</strong>am31.12.<strong>2008</strong><strong>Darmstadt</strong>, Wissenschaftsst. 122,09 1 142 310 70 469 71 841 119 0,1 6,0 1 166 1 019Frankfurt am Ma<strong>in</strong>, St. 248,31 1 664 838 324 838 340 000 5 817 0,9 7,5 2 677 1 047Offenbach am Ma<strong>in</strong>, St. 44,90 1 118 977 59 574 59 403 732 0,6 6,8 2 650 997Wiesbaden, Landeshauptst. 203,90 1 276 742 133 298 143 444 893 0,3 9,9 1 357 1 076Bergstraße 719,54 22 263 465 129 071 134 394 – 915 – 0,3 9,7 366 1 041<strong>Darmstadt</strong>-<strong>Dieburg</strong> 658,65 23 288 701 143 037 145 664 – 370 – 0,1 16,0 438 1 018Groß-Gerau 453,05 14 253 576 125 983 127 593 563 0,2 11,7 560 1 013darunter Rüsselsheim 58,29 1 59 604 29 570 30 034 304 0,5 1,8 1 023 1 016Hochtaunuskreis 482,03 13 225 737 108 344 117 393 – 306 – 0,1 11,1 468 1 084dar. Bad Homburg v.d.H. 51,16 1 51 768 24 062 27 706 – 57 – 0,1 2,9 1 012 1 151Ma<strong>in</strong>-K<strong>in</strong>zig-Kreis 1 397,56 29 407 456 200 308 207 148 – 706 – 0,2 14,0 292 1 034darunter Hanau 76,49 1 88 245 43 227 45 018 – 42 – 0,0 5,8 1 154 1 041Ma<strong>in</strong>-Taunus-Kreis 222,39 12 226 072 109 897 116 175 646 0,3 13,0 1 017 1 057Odenwaldkreis 623,97 15 98 092 48 300 49 792 – 862 – 0,9 14,5 157 1 031Offenbach 356,30 13 336 818 164 994 171 824 147 0,0 11,7 945 1 041Rhe<strong>in</strong>gau-Taunus-Kreis 811,48 17 183 487 89 847 93 640 – 665 – 0,4 12,5 226 1 042Wetteraukreis 1 100,71 25 298 496 146 775 151 721 – 558 – 0,2 19,0 271 1 034Reg.-Bez. <strong>Darmstadt</strong> 7 444,89 187 3 784 767 1 854 735 1 930 032 4 535 0,1 11,5 508 1 041Gießen 854,64 18 255 299 124 272 131 027 – 477 – 0,2 13,0 299 1 054dar. Gießen, Univ.-Stadt 72,56 1 75 140 35 768 39 372 547 0,7 7,6 1 036 1 101Lahn-Dill-Kreis 1 066,51 23 256 582 125 771 130 811 – 1 481 – 0,6 7,9 241 1 040darunter Wetzlar 75,67 1 51 780 24 850 26 930 – 154 – 0,3 3,1 684 1 084Limburg-Weilburg 738,48 19 172 738 84 756 87 982 – 1 016 – 0,6 13,8 234 1 038Marburg-Biedenkopf 1 262,56 22 251 800 123 329 128 471 – 387 – 0,2 9,8 199 1 042dar. Marburg, Univ.-Stadt 123,93 1 79 836 38 039 41 797 596 0,7 16,3 644 1 099Vogelsbergkreis 1 458,99 19 112 264 55 786 56 478 – 1 215 – 1,1 4,2 77 1 012Reg.-Bez. Gießen 5 381,19 101 1 048 683 513 914 534 769 – 4 576 – 0,4 10,1 195 1 041Kassel, documenta-St. 106,78 1 194 168 92 526 101 642 365 0,2 3,7 1 818 1 099Fulda 1 380,39 23 218 421 107 077 111 344 – 634 – 0,3 16,5 158 1 040darunter Fulda 104,04 1 64 129 30 803 33 326 32 0,0 18,1 616 1 082Hersfeld-Rotenburg 1 097,12 20 123 984 61 227 62 757 – 1 227 – 1,0 – 1,0 113 1 025Kassel 1 292,77 29 239 236 116 486 122 750 – 1 492 – 0,6 7,7 185 1 054Schwalm-Eder-Kreis 1 538,49 27 185 310 91 577 93 733 – 1 748 – 0,9 4,9 120 1 024Waldeck-Frankenberg 1 848,58 22 164 652 81 136 83 516 – 1 401 – 0,9 9,9 89 1 029Werra-Meißner-Kreis 1 024,71 16 105 732 51 769 53 963 – 1 424 – 1,3 – 5,9 103 1 042Reg.-Bez. Kassel 8 288,84 138 1 231 503 601 798 629 705 – 7 561 – 0,6 6,1 149 1 046Land H e s s e n 21 114,91 426 6 064 953 2 970 447 3 094 506 – 7 602 – 0,1 10,1 287 1 042davonkreisfreie Städte 725,98 5 1 397 035 680 705 716 330 7 926 0,6 7,2 1 924 1 052<strong>Landkreis</strong>e 20 388,94 421 4 667 918 2 289 742 2 378 176 – 15 528 – 0,3 11,0 229 1 039Planungsverband Frankfurt 2 458,54 75 2 202 231 1 077 996 1 124 235 8 047 0,4 46,1 896 1 0431) Die Bevölkerungsfortschreibung enthält neben den Bewegungsdaten auch Staatsangehörigkeitswechsel und Bestandsveränderungen.Weiteres Material vgl. die Statistischen A I 1 – A V 2 – hj 2/07 „Die Bevölkerung der hessischen Geme<strong>in</strong>den am 31.12.2007”.15
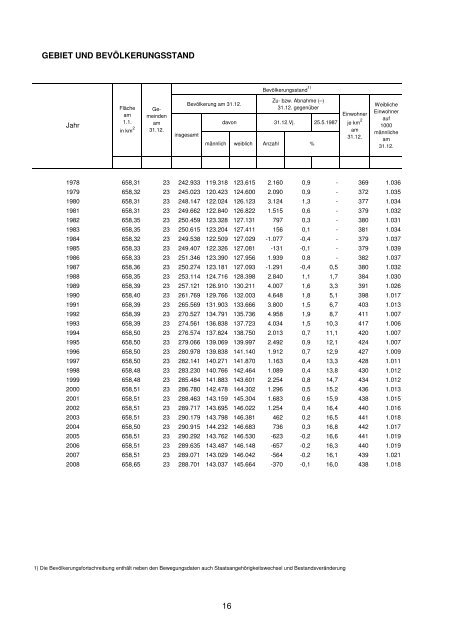
GEBIET UND BEVÖLKERUNGSSTANDBevölkerungsstand 1)JahrFlächeam1.1.<strong>in</strong> km 2Geme<strong>in</strong>denam31.12.<strong>in</strong>sgesamtBevölkerung am 31.12.Zu- bzw. Abnahme (–)31.12. gegenüberdavon 31.12.Vj. 25.5.1987männlich weiblich Anzahl %E<strong>in</strong>wohnerje km 2am31.12.WeiblicheE<strong>in</strong>wohnerauf1000männlicheam31.12.1978 658,31 23 242.933 119.318 123.615 2.160 0,9 - 369 1.0361979 658,32 23 245.023 120.423 124.600 2.090 0,9 - 372 1.0351980 658,31 23 248.147 122.024 126.123 3.124 1,3 - 377 1.0341981 658,31 23 249.662 122.840 126.822 1.515 0,6 - 379 1.0321982 658,35 23 250.459 123.328 127.131 797 0,3 - 380 1.0311983 658,35 23 250.615 123.204 127.411 156 0,1 - 381 1.0341984 658,32 23 249.538 122.509 127.029 -1.077 -0,4 - 379 1.0371985 658,33 23 249.407 122.326 127.081 -131 -0,1 - 379 1.0391986 658,33 23 251.346 123.390 127.956 1.939 0,8 - 382 1.0371987 658,36 23 250.274 123.181 127.093 -1.291 -0,4 0,5 380 1.0321988 658,35 23 253.114 124.716 128.398 2.840 1,1 1,7 384 1.0301989 658,39 23 257.121 126.910 130.211 4.007 1,6 3,3 391 1.0261990 658,40 23 261.769 129.766 132.003 4.648 1,8 5,1 398 1.0171991 658,39 23 265.569 131.903 133.666 3.800 1,5 6,7 403 1.0131992 658,39 23 270.527 134.791 135.736 4.958 1,9 8,7 411 1.0071993 658,39 23 274.561 136.838 137.723 4.034 1,5 10,3 417 1.0061994 658,50 23 276.574 137.824 138.750 2.013 0,7 11,1 420 1.0071995 658,50 23 279.066 139.069 139.997 2.492 0,9 12,1 424 1.0071996 658,50 23 280.978 139.838 141.140 1.912 0,7 12,9 427 1.0091997 658,50 23 282.141 140.271 141.870 1.163 0,4 13,3 428 1.0111998 658,48 23 283.230 140.766 142.464 1.089 0,4 13,8 430 1.0121999 658,48 23 285.484 141.883 143.601 2.254 0,8 14,7 434 1.0122000 658,51 23 286.780 142.478 144.302 1.296 0,5 15,2 436 1.0132001 658,51 23 288.463 143.159 145.304 1.683 0,6 15,9 438 1.0152002 658,51 23 289.717 143.695 146.022 1.254 0,4 16,4 440 1.0162003 658,51 23 290.179 143.798 146.381 462 0,2 16,5 441 1.0182004 658,50 23 290.915 144.232 146.683 736 0,3 16,8 442 1.0172005 658,51 23 290.292 143.762 146.530 -623 -0,2 16,6 441 1.0192006 658,51 23 289.635 143.487 146.148 -657 -0,2 16,3 440 1.0192007 658,51 23 289.071 143.029 146.042 -564 -0,2 16,1 439 1.021<strong>2008</strong> 658,65 23 288.701 143.037 145.664 -370 -0,1 16,0 438 1.0181) Die Bevölkerungsfortschreibung enthält neben den Bewegungsdaten auch Staatsangehörigkeitswechsel und Bestandsveränderung16


![[In Führung gehen!] - Landkreis Darmstadt Dieburg](https://img.yumpu.com/35549173/1/184x260/in-fa-1-4-hrung-gehen-landkreis-darmstadt-dieburg.jpg?quality=85)