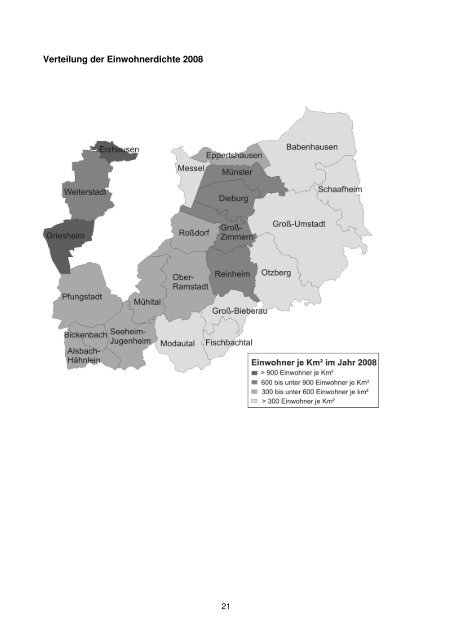
Verteilung der E<strong>in</strong>wohnerdichte <strong>2008</strong>21
BEVÖLKERUNGSBEWEGUNGBevölkerungsbewegungGestorbene im 1. LebensjahrJahrEheschließungenEhescheidungenAnzahl<strong>in</strong>sgesamtauf 1000lebend Geborene 2)darunter<strong>in</strong> den ersten7 LebenstagenTot GeborenePer<strong>in</strong>atale1) 2)SterblichkeitDeutscheDeutscheDeutscheDeutscheNichtdeutscheDeutsche NichtdeutscheNichtdeutscheNichtdeutscheNichtdeutsche1977 1291 - 24 1 11,3 9,8 14 4 19 7 15,5 26,51978 1109 115 26 8 12,5 19,6 17 8 14 3 14,8 26,81979 1194 315 23 6 10,3 16,3 13 4 9 7 9,8 29,41980 1236 445 21 6 8,7 15,2 9 4 18 - 11,0 10,11981 1215 438 27 7 12,0 17,9 8 4 12 1 8,9 12,81982 1328 452 21 2 9,2 5,4 7 2 16 - 10,0 5,41983 1363 418 16 7 7,2 23,0 3 1 12 2 6,7 9,81984 1379 595 15 8 7,0 31,0 6 5 9 - 7,0 19,41985 1362 512 19 2 8,8 7,6 7 1 11 1 8,3 7,71986 1477 455 16 2 6,9 7,3 6 1 5 2 4,8 10,91987 1498 615 19 4 7,8 13,0 8 1 14 1 9,0 6,51988 1545 501 19 3 7,6 8,5 8 1 8 3 6,4 11,41989 1515 550 17 - 6,7 - 8 - 7 - 5,9 -1990 1612 554 18 4 7,1 10,0 7 2 5 4 4,7 15,01991 1537 564 21 1 8,1 2,8 8 - 6 4 5,4 11,01992 1635 549 14 2 5,5 4,1 2 - 7 1 3,6 2,11993 1669 753 16 - 6,5 - 4 - 1 2 2,0 3,71994 1671 796 14 4 5,5 8,5 10 2 6 3 6,2 10,51995 1618 711 13 3 5,3 6,1 6 2 10 4 6,5 12,11996 1426 644 13 - 5,2 - 3 - 13 1 6,3 1,91997 1462 745 9 4 3,5 7,4 3 2 5 5 3,1 12,81998 1499 742 18 1 7,2 2,2 5 - 9 2 5,6 4,31999 1514 770 9 4 3,8 8,4 3 1 10 5 5,5 12,42000 1504 735 11 2 4,3 9,2 6 1 12 2 7,0 13,62001 1395 812 5 2 2,0 9,4 2 1 9 2 4,3 14,02002 1409 900 8 3 3,3 19,5 5 1 12 2 7,0 19,22003 1286 895 9 2 3,8 12,9 5 1 9 1 5,9 12,82004 1412 955 16 - 6,9 - 8 - 9 1 7,3 6,62005 1328 781 9 2 3,8 22,5 6 1 10 1 6,7 22,22006 1206 763 5 - 2,2 - 2 0 4 1 2,7 132007 1228 856 6 1 2,6 8,3 5 1 9 4 6,1 41,7<strong>2008</strong> 1294 878 7 2 3,1 16,4 5 1 3 1 3,5 16,31) Tot Geborene und <strong>in</strong> den ersten sieben Lebenstagen Gestorbene auf 1000 Geborene2) Bezogen auf die jeweilige Bevölkerungsgruppe22


![[In Führung gehen!] - Landkreis Darmstadt Dieburg](https://img.yumpu.com/35549173/1/184x260/in-fa-1-4-hrung-gehen-landkreis-darmstadt-dieburg.jpg?quality=85)