Geschäftsbericht 2012 - Textilverband Schweiz
Geschäftsbericht 2012 - Textilverband Schweiz
Geschäftsbericht 2012 - Textilverband Schweiz
- Keine Tags gefunden...

Erfolgreiche ePaper selbst erstellen
Machen Sie aus Ihren PDF Publikationen ein blätterbares Flipbook mit unserer einzigartigen Google optimierten e-Paper Software.
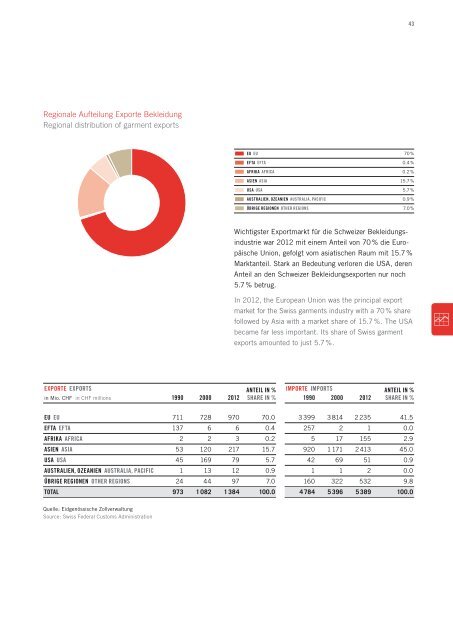
43Regionale Aufteilung Exporte BekleidungRegional distribution of garment exportsEU EU 70 %EFTA EFTA 0.4 %Afrika Africa 0.2 %Asien Asia 15.7 %USA USA 5.7 %Australien, ozeanien Australia, Pacific 0.9 %Übrige regionen other regions 7.0 %Wichtigster Exportmarkt für die <strong>Schweiz</strong>er Bekleidungsindustriewar <strong>2012</strong> mit einem Anteil von 70 % die EuropäischeUnion, gefolgt vom asiatischen Raum mit 15.7 %Marktanteil. Stark an Bedeutung verloren die USA, derenAnteil an den <strong>Schweiz</strong>er Bekleidungsexporten nur noch5.7 % betrug.In <strong>2012</strong>, the European Union was the principal exportmarket for the Swiss garments industry with a 70 % sharefollowed by Asia with a market share of 15.7 %. The USAbecame far less important. Its share of Swiss garmentexports amounted to just 5.7 %.EXPORTE EXPORTS Anteil in %in Mio. CHF in CHF millions 1990 2000 <strong>2012</strong>Share in %importe imPORTS Anteil in %1990 2000 <strong>2012</strong>Share in %EU EU 711 728 970 70.0EFTA EFTA 137 6 6 0.4Afrika Africa 2 2 3 0.2Asien Asia 53 120 217 15.7USA USA 45 169 79 5.7Australien, Ozeanien Australia, Pacific 1 13 12 0.9Übrige Regionen Other regions 24 44 97 7.0Total 973 1082 1384 100.03399 3814 2235 41.5257 2 1 0.05 17 155 2.9920 1171 2413 45.042 69 51 0.91 1 2 0.0160 322 532 9.84784 5396 5389 100.0Quelle: Eidgenössische ZollverwaltungSource: Swiss Federal Customs Administration