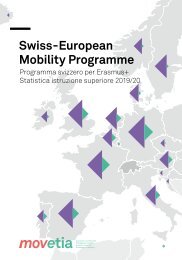
Statistik Übergangslösung für Erasmus +

Erfolgreiche ePaper selbst erstellen
Machen Sie aus Ihren PDF Publikationen ein blätterbares Flipbook mit unserer einzigartigen Google optimierten e-Paper Software.
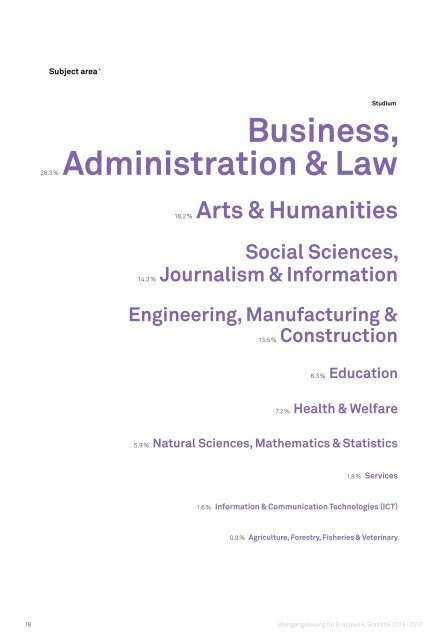
Subject area *<br />
Business,<br />
Administration & Law<br />
28.3 %<br />
14.3 %<br />
Studium<br />
18.2 % Arts & Humanities<br />
Social Sciences,<br />
Journalism & Information<br />
Engineering, Manufacturing &<br />
13.5 % Construction<br />
Praktikum<br />
Services 29.4 %<br />
Health & Welfare 23.6<br />
Arts & Humanities 12.0 %<br />
%<br />
Engineering, Manufacturing &<br />
Construction 18.6 %<br />
Social Sciences, Journalism & Information 7.4 %<br />
8.3 % Education<br />
7.2 % Health & Welfare<br />
Natural Sciences, Mathematics & Statistics<br />
Business, Administration & Law 3.7 %<br />
4.9 %<br />
5.9 % Natural Sciences, Mathematics & Statistics<br />
Information & Communication Technologies (ICT)<br />
0.4 %<br />
1.8 % Services<br />
1.6 % Information & Communication Technologies (ICT)<br />
0.9 % Agriculture, Forestry, Fisheries & Veterinary<br />
* Gemäss der Internationalen Standardklassifikation<br />
<strong>für</strong> das Bildungswesen der UNESCO (ISCED)<br />
18 <strong>Übergangslösung</strong> <strong>für</strong> <strong>Erasmus</strong>+, <strong>Statistik</strong> 2014–2017<br />
Lernmobilitäten von Einzelpersonen – Tertiärstufe<br />
19