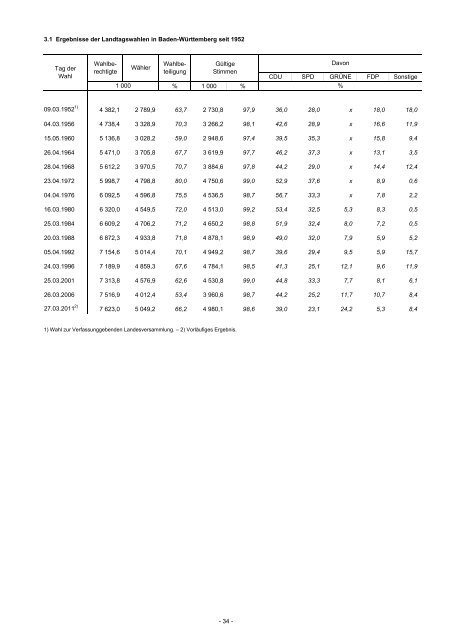
3.1 Ergebnisse <strong>der</strong> <strong>Landtag</strong>swahlen in <strong>Baden</strong>-Württemberg seit 1952 Tag <strong>der</strong> <strong>Wahl</strong> 09.03.1952 1) CDU SPD GRÜNE FDP Sonstige 1 000 % 1 000 % % 4 382,1 2 789,9 63,7 2 730,8 97,9 36,0 28,0 x 18,0 18,0 04.03.1956 4 738,4 3 328,9 70,3 3 266,2 98,1 42,6 28,9 x 16,6 11,9 <strong>15.</strong>05.1960 5 136,8 3 028,2 59,0 2 948,6 97,4 39,5 35,3 x 15,8 9,4 26.04.1964 5 471,0 3 705,8 67,7 3 619,9 97,7 46,2 37,3 x 13,1 3,5 28.04.1968 5 612,2 3 970,5 70,7 3 884,6 97,8 44,2 29,0 x 14,4 12,4 23.04.1972 5 998,7 4 798,8 80,0 4 750,6 99,0 52,9 37,6 x 8,9 0,6 04.04.1976 6 092,5 4 596,8 75,5 4 536,5 98,7 56,7 33,3 x 7,8 2,2 16.03.1980 6 320,0 4 549,5 72,0 4 513,0 99,2 53,4 32,5 5,3 8,3 0,5 25.03.1984 6 609,2 4 706,2 71,2 4 650,2 98,8 51,9 32,4 8,0 7,2 0,5 20.03.1988 6 872,3 4 933,8 71,8 4 878,1 98,9 49,0 32,0 7,9 5,9 5,2 05.04.1992 7 154,6 5 014,4 70,1 4 949,2 98,7 39,6 29,4 9,5 5,9 15,7 24.03.1996 7 189,9 4 859,3 67,6 4 784,1 98,5 41,3 25,1 12,1 9,6 11,9 25.03.2001 7 313,8 4 576,9 62,6 4 530,8 99,0 44,8 33,3 7,7 8,1 6,1 26.03.2006 7 516,9 4 012,4 53,4 3 960,6 98,7 44,2 25,2 11,7 10,7 8,4 27.03.2011 2) <strong>Wahl</strong>berechtigte Wähler <strong>Wahl</strong>beteiligung Gültige Stimmen 7 623,0 5 049,2 66,2 4 980,1 98,6 39,0 23,1 24,2 5,3 8,4 1) <strong>Wahl</strong> zur Verfassunggebenden Landesversammlung. – 2) Vorläufiges Ergebnis. - 34 - Da<strong>von</strong>
3.2 Vorläufige Ergebnisse <strong>der</strong> <strong>Wahl</strong> <strong>zum</strong> <strong>15.</strong> <strong>Landtag</strong> <strong>von</strong> <strong>Baden</strong>-Württemberg am 27. März 2011 mit Vergleichsangaben 3.2 <strong>von</strong> 2006 in den <strong>Landtag</strong>swahlkreisen <strong>Baden</strong>-Württembergs Gegenstand <strong>der</strong> Nachweisung <strong>Wahl</strong>berechtigte Wähler Ungültige Stimmen Gültige Stimmen da<strong>von</strong> für CDU SPD GRÜNE FDP Volksabstimmung 1) AUF BIG BüSo DKP DIE LINKE 2) REP DIE VIOLETTEN FAMILIE NPD ödp PBC Die PARTEI PIRATEN RSB Einzelbewerber Sonstige (nur 2006) 2011 2006 Verän<strong>der</strong>ung Anzahl % Anzahl % Anzahl %-Punkte 7 622 955 5 049 157 66,2 69 043 1,4 4 980 114 98,6 1 942 404 39,0 1 748 766 44,2 + 193 638 – 5,2 1 151 859 23,1 996 207 25,2 + 155 652 – 2,1 1 205 508 24,2 462 889 11,7 + 742 619 + 12,5 262 520 5,3 421 994 10,7 – 159 474 – 5,4 2 489 0,0 767 0,0 + 1 722 – 10 421 0,2 × × + 10 421 + 0,2 3 463 0,1 × × + 3 463 + 0,1 307 0,0 × × + 307 + 0,0 104 0,0 × × + 104 + 0,0 139 606 2,8 121 753 3,1 + 17 853 – 0,3 56 723 1,1 100 081 2,5 – 43 358 – 1,4 1 860 0,0 × × + 1 860 + 0,0 1 280 0,0 × × + 1 280 + 0,0 48 209 1,0 29 219 0,7 + 18 990 + 0,3 42 469 0,9 21 761 0,5 + 20 708 + 0,4 4 647 0,1 26 759 0,7 – 22 112 – 0,6 384 0,0 742 0,0 – 358 – 103 392 2,1 × × + 103 392 + 2,1 109 0,0 144 0,0 – 35 – 2 360 0,0 5 892 0,1 – 3 532 – 0,1 × × 23 641 0,6 – 23 641 – 0,6 Anzahl % Anzahl % Anzahl %-Pkte Anzahl % Anzahl % Anzahl %-Pkte <strong>Wahl</strong>berechtigte 94 347 89 181 + 5 166 90 670 88 460 + 2 210 Wähler 71 327 75,6 50 926 57,1 + 20 401 + 18,5 70 493 77,7 55 713 63,0 + 14 780 + 14,7 Ungültige Stimmen 466 0,7 407 0,8 + 59 – 0,1 547 0,8 378 0,7 + 169 + 0,1 Gültige Stimmen da<strong>von</strong> für 70 861 99,3 50 519 99,2 + 20 342 + 0,1 69 946 99,2 55 335 99,3 + 14 611 – 0,1 CDU 19 033 26,9 16 060 31,8 + 2 973 – 4,9 23 624 33,8 21 019 38,0 + 2 605 – 4,2 SPD 12 407 17,5 12 580 24,9 – 173 – 7,4 13 332 19,1 13 019 23,5 + 313 – 4,4 GRÜNE 30 114 42,5 12 090 23,9 + 18 024 + 18,6 23 925 34,2 9 276 16,8 + 14 649 + 17,4 FDP 4 334 6,1 6 018 11,9 – 1 684 – 5,8 4 945 7,1 8 084 14,6 – 3 139 – 7,5 Volksabstimmung 1) × × × × × × × × × × × × AUF × × × × × × × × × × × × BIG × × × × × × × × × × × × BüSo 109 0,2 × × + 109 + 0,2 106 0,2 × × + 106 + 0,2 DKP × × × × × × × × × × × × DIE LINKE 2) Gegenstand <strong>der</strong> 2011 2006 Verän<strong>der</strong>ung 2011 2006 Verän<strong>der</strong>ung Nachweisung <strong>Wahl</strong>kreis 01 Stuttgart I *) <strong>Wahl</strong>kreis 02 Stuttgart II *) 2 393 3,4 1 853 3,7 + 540 – 0,3 1 669 2,4 1 445 2,6 + 224 – 0,2 REP 368 0,5 733 1,5 – 365 – 1,0 474 0,7 916 1,7 – 442 – 1,0 DIE VIOLETTEN 113 0,2 × × + 113 + 0,2 × × × × × × FAMILIE × × × × × × × × × × × × NPD 192 0,3 7 0,0 + 185 + 0,3 293 0,4 210 0,4 + 83 – ödp 337 0,5 175 0,3 + 162 + 0,2 450 0,6 190 0,3 + 260 + 0,3 PBC × × 236 0,5 – 236 – 0,5 × × 277 0,5 – 277 – 0,5 Die PARTEI × × × × × × × × × × × × PIRATEN 1 385 2,0 × × + 1 385 + 2,0 1 128 1,6 × × + 1 128 + 1,6 RSB × × × × × × × × × × × × Einzelbewerber 76 0,1 × × + 76 + 0,1 × × × × × × Sonstige (nur 2006) × × 767 1,5 – 767 – 1,5 × × 899 1,6 – 899 – 1,6 *) Ergebnis <strong>von</strong> 2006 umgerechnet auf die <strong>Wahl</strong>kreiseinteilung <strong>der</strong> <strong>Landtag</strong>swahl 2011. 1) 2006: Deutschland. – 2) 2006: WASG (2007 Vereinigung WASG und Die Linke.). Land <strong>Baden</strong>-Württemberg 7 516 919 4 012 441 51 826 3 960 615 - 35 - 53,4 1,3 98,7 + 106 036 + 1036 716 + 12,8 + 17 217 + 0,1 + 1019 499 – 0,1