Download - Insurance Council of New Zealand
Download - Insurance Council of New Zealand
Download - Insurance Council of New Zealand

Create successful ePaper yourself
Turn your PDF publications into a flip-book with our unique Google optimized e-Paper software.
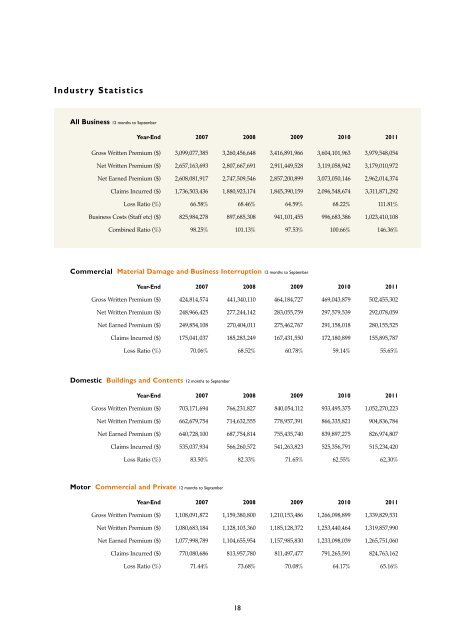
Industr y Statistics<br />
All Business 12 months to September<br />
Year-End 2007 2008 2009 2010 2011<br />
Gross Written Premium ($) 3,099,077,385 3,260,456,648 3,416,891,966 3,604,101,963 3,979,548,054<br />
Net Written Premium ($) 2,657,163,693 2,807,667,691 2,911,449,528 3,119,058,942 3,179,010,972<br />
Net Earned Premium ($) 2,608,081,917 2,747,509,546 2,857,200,899 3,073,050,146 2,962,014,374<br />
Claims Incurred ($) 1,736,503,436 1,880,923,174 1,845,390,159 2,096,548,674 3,311,871,292<br />
Loss Ratio (%) 66.58% 68.46% 64.59% 68.22% 111.81%<br />
Business Costs (Staff etc) ($) 825,984,278 897,685,308 941,101,455 996,683,386 1,023,410,108<br />
Combined Ratio (%) 98.25% 101.13% 97.53% 100.66% 146.36%<br />
Commercial Material Damage and Business Interruption 12 months to September<br />
Year-End 2007 2008 2009 2010 2011<br />
Gross Written Premium ($) 424,814,574 441,340,110 464,184,727 469,043,879 502,455,302<br />
Net Written Premium ($) 248,966,425 277,244,142 283,055,759 297,579,539 292,078,059<br />
Net Earned Premium ($) 249,854,108 270,404,011 275,462,767 291,158,018 280,155,525<br />
Claims Incurred ($) 175,041,037 185,283,249 167,431,550 172,180,899 155,895,787<br />
Loss Ratio (%) 70.06% 68.52% 60.78% 59.14% 55.65%<br />
Domestic Buildings and Contents 12 months to September<br />
Year-End 2007 2008 2009 2010 2011<br />
Gross Written Premium ($) 703,171,694 766,231,827 840,054,112 933,495,375 1,052,270,223<br />
Net Written Premium ($) 662,679,754 714,632,555 778,957,391 866,335,821 904,836,784<br />
Net Earned Premium ($) 640,728,100 687,754,814 755,435,740 839,897,275 826,974,807<br />
Claims Incurred ($) 535,037,934 566,260,572 541,263,823 525,356,791 515,234,420<br />
Loss Ratio (%) 83.50% 82.33% 71.65% 62.55% 62,30%<br />
Motor Commercial and Private 12 months to September<br />
Year-End 2007 2008 2009 2010 2011<br />
Gross Written Premium ($) 1,108,091,872 1,159,380,800 1,210,153,486 1,266,098,899 1,339,829,531<br />
Net Written Premium ($) 1,080,683,184 1,128,103,360 1,185,128,372 1,253,440,464 1,319,857,990<br />
Net Earned Premium ($) 1,077,998,789 1,104,655,954 1,157,985,830 1,233,098,039 1,265,751,060<br />
Claims Incurred ($) 770,080,686 813,957,780 811,497,477 791,265,591 824,763,162<br />
Loss Ratio (%) 71.44% 73.68% 70.08% 64.17% 65.16%<br />
18