Download - Insurance Council of New Zealand
Download - Insurance Council of New Zealand
Download - Insurance Council of New Zealand

Create successful ePaper yourself
Turn your PDF publications into a flip-book with our unique Google optimized e-Paper software.
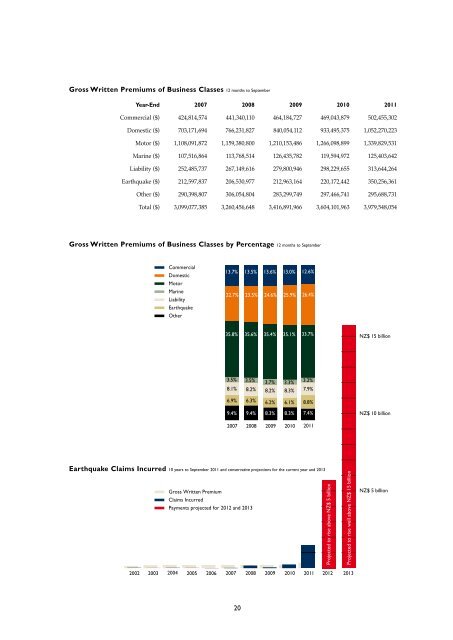
Gross Written Premiums <strong>of</strong> Business Classes 12 months to September<br />
Year-End 2007 2008 2009 2010 2011<br />
Commercial ($) 424,814,574 441,340,110 464,184,727 469,043,879 502,455,302<br />
Domestic ($) 703,171,694 766,231,827 840,054,112 933,495,375 1,052,270,223<br />
Motor ($) 1,108,091,872 1,159,380,800 1,210,153,486 1,266,098,899 1,339,829,531<br />
Marine ($) 107,516,864 113,768,514 126,435,782 119,594,972 125,403,642<br />
Liability ($) 252,485,737 267,149,616 279,800,946 298,229,655 313,644,264<br />
Earthquake ($) 212,597,837 206,530,977 212,963,164 220,172,442 350,256,361<br />
Other ($) 290,398,807 306,054,804 283,299,749 297,466,741 295,688,731<br />
Total ($) 3,099,077,385 3,260,456,648 3,416,891,966 3,604,101,963 3,979,548,054<br />
Gross Written Premiums <strong>of</strong> Business Classes by Percentage 12 months to September<br />
2002 2003 2004<br />
Commercial<br />
Domestic<br />
Motor<br />
Marine<br />
Liability<br />
Earthquake<br />
Other<br />
Gross Written Premium<br />
Claims Incurred<br />
Payments projected for 2012 and 2013<br />
13.7% 13.5% 13.6% 13.0%<br />
22.7% 23.5% 24.6% 25.9%<br />
35.8% 35.6% 35.4% 35.1%<br />
3.5% 3.5% 3.7% 3.3%<br />
8.1% 8.2% 8.2% 8.3%<br />
6.9% 6.3% 6.2% 6.1%<br />
9.4% 9.4% 8.3% 8.3%<br />
2007 2008 2009<br />
Earthquake Claims Incurred 10 years to September 2011 and conservative projections for the current year and 2013<br />
2010<br />
2005 2006 2007 2008 2009 2010 2011 2012 2013<br />
20<br />
12.6%<br />
26.4%<br />
33.7%<br />
3.2%<br />
7.9%<br />
8.8%<br />
7.4%<br />
2011<br />
Projected to rise above NZ$ 5 billion<br />
Projected to rise well above NZ$ 15 billion<br />
NZ$ 15 billion<br />
NZ$ 10 billion<br />
NZ$ 5 billion