ROOM ACOUSTIC PREDICTION MODELLING - Odeon
ROOM ACOUSTIC PREDICTION MODELLING - Odeon
ROOM ACOUSTIC PREDICTION MODELLING - Odeon

Create successful ePaper yourself
Turn your PDF publications into a flip-book with our unique Google optimized e-Paper software.
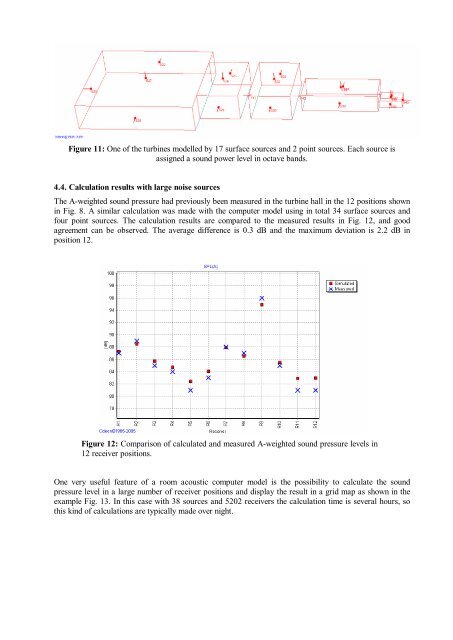
Figure 11: One of the turbines modelled by 17 surface sources and 2 point sources. Each source is<br />
assigned a sound power level in octave bands.<br />
4.4. Calculation results with large noise sources<br />
The A-weighted sound pressure had previously been measured in the turbine hall in the 12 positions shown<br />
in Fig. 8. A similar calculation was made with the computer model using in total 34 surface sources and<br />
four point sources. The calculation results are compared to the measured results in Fig. 12, and good<br />
agreement can be observed. The average difference is 0.3 dB and the maximum deviation is 2.2 dB in<br />
position 12.<br />
Figure 12: Comparison of calculated and measured A-weighted sound pressure levels in<br />
12 receiver positions.<br />
One very useful feature of a room acoustic computer model is the possibility to calculate the sound<br />
pressure level in a large number of receiver positions and display the result in a grid map as shown in the<br />
example Fig. 13. In this case with 38 sources and 5202 receivers the calculation time is several hours, so<br />
this kind of calculations are typically made over night.