

18 - World Journal of Gastroenterology
18 - World Journal of Gastroenterology
18 - World Journal of Gastroenterology

Create successful ePaper yourself
Turn your PDF publications into a flip-book with our unique Google optimized e-Paper software.
2610 ISSN 1007-9327 CN 14-1219/R <strong>World</strong> J Gastroenterol May 14, 2007 Volume 13 Number <strong>18</strong><br />
Mw<br />
97K<br />
66K<br />
43K<br />
31K<br />
20K<br />
P11021<br />
P07237<br />
P27797<br />
P07437<br />
P06576<br />
P08670<br />
P02570<br />
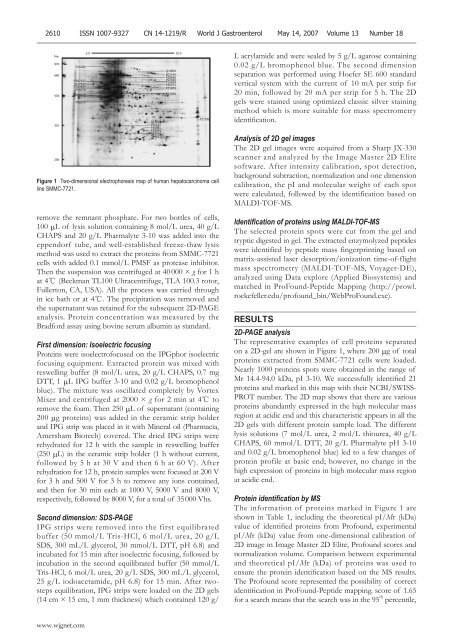
Figure 1 Two-dimensional electrophoresis map <strong>of</strong> human hepatocarcinoma cell<br />
line SMMC-7721.<br />
remove the remnant phosphate. For two bottles <strong>of</strong> cells,<br />
100 μL <strong>of</strong> lysis solution containing 8 mol/L urea, 40 g/L<br />
CHAPS and 20 g/L Pharmalyte 3-10 was added into the<br />
eppendorf tube, and well-established freeze-thaw lysis<br />
method was used to extract the proteins from SMMC-7721<br />
cells with added 0.1 mmol/L PMSF as protease inhibitor.<br />
Then the suspension was centrifuged at 40 000 × g for 1 h<br />
at 4℃ (Beckman TL100 Ultracentrifuge, TLA 100.3 rotor,<br />
Fullerton, CA, USA). All the process was carried through<br />
in ice bath or at 4℃. The precipitation was removed and<br />
the supernatant was retained for the subsequent 2D-PAGE<br />
analysis. Protein concentration was measured by the<br />
Bradford assay using bovine serum albumin as standard.<br />
First dimension: Isoelectric focusing<br />
Proteins were isoelectr<strong>of</strong>ocused on the IPGphor isoelectric<br />
focusing equipment. Extracted protein was mixed with<br />
reswelling buffer (8 mol/L urea, 20 g/L CHAPS, 0.7 mg<br />
DTT, 1 μL IPG buffer 3-10 and 0.02 g/L bromophenol<br />
blue). The mixture was oscillated completely by Vortex<br />
Mixer and centrifuged at 2000 × g for 2 min at 4℃ to<br />
remove the foam. Then 250 μL <strong>of</strong> supernatant (containing<br />
200 μg proteins) was added in the ceramic strip holder<br />
and IPG strip was placed in it with Mineral oil (Pharmacia,<br />
Amersham Biotech) covered. The dried IPG strips were<br />
rehydrated for 12 h with the sample in reswelling buffer<br />
(250 μL) in the ceramic strip holder (1 h without current,<br />
followed by 5 h at 30 V and then 6 h at 60 V). After<br />
rehydration for 12 h, protein samples were focused at 200 V<br />
for 3 h and 500 V for 3 h to remove any ions contained,<br />
and then for 30 min each at 1000 V, 5000 V and 8000 V,<br />
respectively, followed by 8000 V, for a total <strong>of</strong> 35 000 Vhs.<br />
Second dimension: SDS-PAGE<br />
IPG strips were removed into the first equilibrated<br />
buffer (50 mmol/L Tris-HCl, 6 mol/L urea, 20 g/L<br />
SDS, 300 mL/L glycerol, 30 mmol/L DTT, pH 6.8) and<br />
incubated for 15 min after isoelectric focusing, followed by<br />
incubation in the second equilibrated buffer (50 mmol/L<br />
Tris-HCl, 6 mol/L urea, 20 g/L SDS, 300 mL/L glycerol,<br />
25 g/L iodoacetamide, pH 6.8) for 15 min. After twosteps<br />
equilibration, IPG strips were loaded on the 2D gels<br />
(14 cm × 15 cm, 1 mm thickness) which contained 120 g/<br />
www.wjgnet.com<br />
3.0 10.0<br />
Q13011<br />
P35232<br />
P30081<br />
P30040<br />
Q13162<br />
32483377<br />
Q16891<br />
P02545<br />
P38646<br />
P02545<br />
P10809<br />
P30101<br />
P55809<br />
P31930<br />
P21796<br />
L acrylamide and were sealed by 5 g/L agarose containing<br />
0.02 g/L bromophenol blue. The second dimension<br />
separation was performed using Hoefer SE 600 standard<br />
vertical system with the current <strong>of</strong> 10 mA per strip for<br />
20 min, followed by 20 mA per strip for 5 h. The 2D<br />
gels were stained using optimized classic silver staining<br />
method which is more suitable for mass spectrometry<br />
identification.<br />
Analysis <strong>of</strong> 2D gel images<br />
The 2D gel images were acquired from a Sharp JX-330<br />
scanner and analyzed by the Image Master 2D Elite<br />
s<strong>of</strong>tware. After intensity calibration, spot detection,<br />
background subtraction, normalization and one dimension<br />
calibration, the pI and molecular weight <strong>of</strong> each spot<br />
were calculated, followed by the identification based on<br />
MALDI-TOF-MS.<br />
Identification <strong>of</strong> proteins using MALDI-TOF-MS<br />
The selected protein spots were cut from the gel and<br />
tryptic digested in gel. The extracted enzymolyzed peptides<br />
were identified by peptide mass fingerprinting based on<br />
matrix-assisted laser desorption/ionization time-<strong>of</strong>-flight<br />
mass spectrometry (MALDI-TOF-MS, Voyager-DE),<br />
analyzed using Data explore (Applied Biosystems) and<br />
matched in ProFound-Peptide Mapping (http://prowl.<br />
rockefeller.edu/pr<strong>of</strong>ound_bin/WebProFound.exe).<br />
RESULTS<br />
2D-PAGE analysis<br />
The representative examples <strong>of</strong> cell proteins separated<br />
on a 2D-gel are shown in Figure 1, where 200 μg <strong>of</strong> total<br />
proteins extracted from SMMC-7721 cells were loaded.<br />
Nearly 1000 proteins spots were obtained in the range <strong>of</strong><br />
Mr 14.4-94.0 kDa, pI 3-10. We successfully identified 21<br />
proteins and marked in this map with their NCBI/SWISS-<br />
PROT number. The 2D map shows that there are various<br />
proteins abundantly expressed in the high molecular mass<br />
region at acidic end and this characteristic appears in all the<br />
2D gels with different protein sample load. The different<br />
lysis solutions (7 mol/L urea, 2 mol/L thiourea, 40 g/L<br />
CHAPS, 60 mmol/L DTT, 20 g/L Pharmalyte pH 3-10<br />
and 0.02 g/L bromophenol blue) led to a few changes <strong>of</strong><br />
protein pr<strong>of</strong>ile at basic end; however, no change in the<br />
high expression <strong>of</strong> proteins in high molecular mass region<br />
at acidic end.<br />
Protein identification by MS<br />
The information <strong>of</strong> proteins marked in Figure 1 are<br />
shown in Table 1, including the theoretical pI/Mr (kDa)<br />
value <strong>of</strong> identified proteins from Pr<strong>of</strong>ound, experimental<br />
pI/Mr (kDa) value from one-dimensional calibration <strong>of</strong><br />
2D image in Image Master 2D Elite, Pr<strong>of</strong>ound scores and<br />
normalization volume. Comparison between experimental<br />
and theoretical pI/Mr (kDa) <strong>of</strong> proteins was used to<br />
ensure the protein identification based on the MS results.<br />
The Pr<strong>of</strong>ound score represented the possibility <strong>of</strong> correct<br />
identification in ProFound-Peptide mapping. score <strong>of</strong> 1.65<br />
for a search means that the search was in the 95 th percentile,


