Annual Report (PDF) - Feintool
Annual Report (PDF) - Feintool
Annual Report (PDF) - Feintool

Create successful ePaper yourself
Turn your PDF publications into a flip-book with our unique Google optimized e-Paper software.
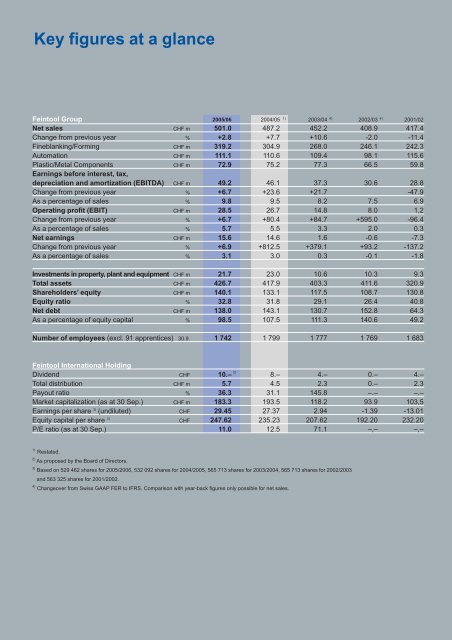
Key figures at a glance<br />
1)<br />
4) 4)<br />
<strong>Feintool</strong> Group 2005/06 2004/05 2003/04 2002/03 2001/02<br />
Net sales CHF m 501.0 487.2 452.2 408.9 417.4<br />
Change from previous year % +2.8 +7.7 +10.6 -2.0 -11.4<br />
Fineblanking/Forming CHF m 319.2 304.9 268.0 246.1 242.3<br />
Automation CHF m 111.1 110.6 109.4 98.1 115.6<br />
Plastic/Metal Components CHF m 72.9 75.2 77.3 66.5 59.8<br />
Earnings before interest, tax,<br />
depreciation and amortization (EBITDA) CHF m 49.2 46.1 37.3 30.6 28.8<br />
Change from previous year % +6.7 +23.6 +21.7 -47.9<br />
As a percentage of sales % 9.8 9.5 8.2 7.5 6.9<br />
Operating profit (EBIT) CHF m 28.5 26.7 14.8 8.0 1,2<br />
Change from previous year % +6.7 +80.4 +84.7 +595.0 -96.4<br />
As a percentage of sales % 5.7 5.5 3.3 2.0 0.3<br />
Net earnings CHF m 15.6 14.6 1.6 -0.6 -7.3<br />
Change from previous year % +6.9 +812.5 +379.1 +93.2 -137.2<br />
As a percentage of sales % 3.1 3.0 0.3 -0.1 -1.8<br />
Investments in property, plant and equipment CHF m 21.7 23.0 10.6 10.3 9.3<br />
Total assets CHF m 426.7 417.9 403.3 411.6 320.9<br />
Shareholders’ equity CHF m 140.1 133.1 117.5 108.7 130.8<br />
Equity ratio % 32.8 31.8 29.1 26.4 40.8<br />
Net debt CHF m 138.0 143.1 130.7 152.8 64.3<br />
As a percentage of equity capital % 98.5 107.5 111.3 140.6 49.2<br />
Number of employees (excl. 91 apprentices) 30.9. 1 742 1 799 1 777 1 769 1 683<br />
<strong>Feintool</strong> International Holding<br />
Dividend CHF 10.– 8.– 4.– 0.– 4.–<br />
Total distribution CHF m 5.7 4.5 2.3 0.– 2.3<br />
Payout ratio % 36.3 31.1 145.8 –.– –.–<br />
Market capitalization (as at 30 Sep.) CHF m 183.3 193.5 118.2 93.9 103,5<br />
Earnings per share 3) (undiluted) CHF 29.45 27.37 2.94 -1.39 -13.01<br />
Equity capital per share 3)<br />
2)<br />
CHF 247.62 235.23 207.62 192.20 232.20<br />
P/E ratio (as at 30 Sep.) 11.0 12.5 71.1 –,– –,–<br />
1) Restated.<br />
2)<br />
As proposed by the Board of Directors.<br />
3)<br />
Based on 529 462 shares for 2005/2006, 532 092 shares for 2004/2005, 565 713 shares for 2003/2004, 565 713 shares for 2002/2003<br />
and 563 325 shares for 2001/2002.<br />
4)<br />
Changeover from Swiss GAAP FER to IFRS. Comparison with year-back figures only possible for net sales.