Foreign Direct Investment in the United States. Transactions
Foreign Direct Investment in the United States. Transactions
Foreign Direct Investment in the United States. Transactions
You also want an ePaper? Increase the reach of your titles
YUMPU automatically turns print PDFs into web optimized ePapers that Google loves.
Digitized for FRASER<br />
Federal Reserve Bank of St.Louis<br />
-3-<br />
INVESTMENT BY SOURCE COUNTRY<br />
The major <strong>in</strong>dustrialized countries have traditionally been <strong>the</strong> source of most<br />
direct <strong>in</strong>vestment activity <strong>in</strong> <strong>the</strong> <strong>United</strong> <strong>States</strong>. This trend cont<strong>in</strong>ued <strong>in</strong> 1990<br />
as seven nations-Japan, <strong>the</strong> <strong>United</strong> K<strong>in</strong>gdom, France, West Germany,<br />
Canada, Italy, and Switzerland-accounted for 811 transactions or 80 percent<br />
of <strong>the</strong> total transactions, down from 81 percent <strong>in</strong> 1989. The identified<br />
aggregate value of <strong>the</strong> transactions by <strong>the</strong> seven countries-$51.4<br />
billion-represented 89 percent of <strong>the</strong> total identified value, as compared with<br />
88 percent <strong>in</strong> 1989. This identified aggregate value decl<strong>in</strong>ed by 22 percent<br />
from $65.5 billion <strong>in</strong> 1989, however.<br />
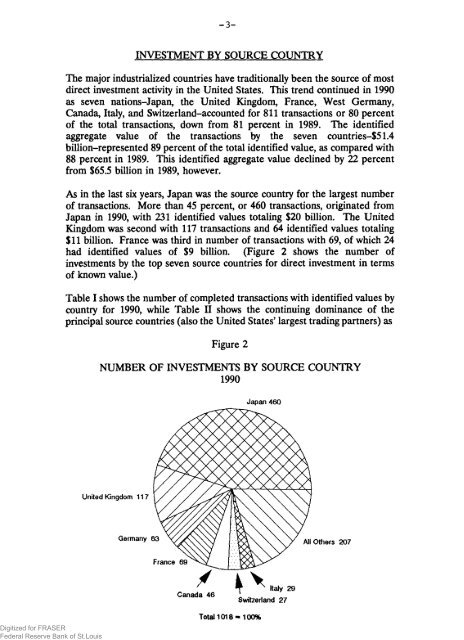
As <strong>in</strong> <strong>the</strong> last six years, Japan was <strong>the</strong> source country for <strong>the</strong> largest number<br />
of transactions. More than 45 percent, or 460 transactions, orig<strong>in</strong>ated from<br />
Japan <strong>in</strong> 1990, with 231 identified values total<strong>in</strong>g $20 billion. The <strong>United</strong><br />
K<strong>in</strong>gdom was second with 117 transactions and 64 identified values total<strong>in</strong>g<br />
$11 billion. France was third <strong>in</strong> number of transactions with 69, of which 24<br />
had identified values of $9 billion. (Figure 2 shows <strong>the</strong> number of<br />
<strong>in</strong>vestments by <strong>the</strong> top seven source countries for direct <strong>in</strong>vestment <strong>in</strong> terms<br />
of known value.)<br />
Table I shows <strong>the</strong> number of completed transactions with identified values by<br />
country for 1990, while Table II shows <strong>the</strong> cont<strong>in</strong>u<strong>in</strong>g dom<strong>in</strong>ance of <strong>the</strong><br />
pr<strong>in</strong>cipal source countries (also <strong>the</strong> <strong>United</strong> <strong>States</strong>’ largest trad<strong>in</strong>g partners) as<br />
Figure 2<br />
NUMBER OF INVESTMENTS BY SOURCE COUNTRY<br />
1990<br />
<strong>United</strong> K<strong>in</strong>gdom 117<br />
Germany<br />
Canada 46<br />
Total 1018 »100%<br />
Japan 460<br />
J N Italy 29<br />
Switzerland 27<br />
All O<strong>the</strong>rs 207


