Foreign Direct Investment in the United States. Transactions
Foreign Direct Investment in the United States. Transactions
Foreign Direct Investment in the United States. Transactions

Create successful ePaper yourself
Turn your PDF publications into a flip-book with our unique Google optimized e-Paper software.
Digitized for FRASER<br />
Federal Reserve Bank of St.Louis<br />
-37-<br />
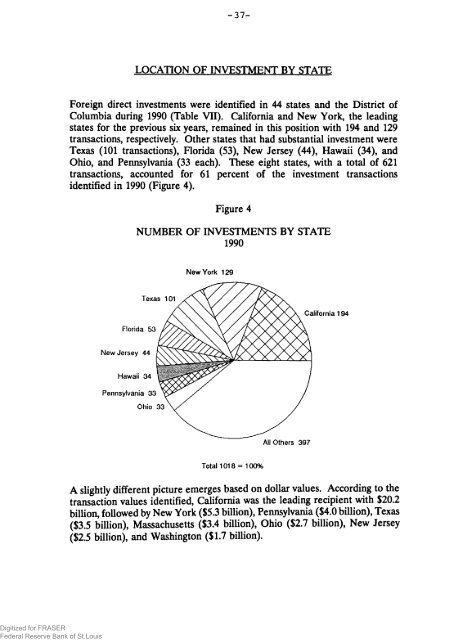
LOCATION OF INVESTMENT BY STATE<br />
<strong>Foreign</strong> direct <strong>in</strong>vestments were identified <strong>in</strong> 44 states and <strong>the</strong> District of<br />
Columbia dur<strong>in</strong>g 1990 (Table VII). California and New York, <strong>the</strong> lead<strong>in</strong>g<br />
states for <strong>the</strong> previous six years, rema<strong>in</strong>ed <strong>in</strong> this position with 194 and 129<br />
transactions, respectively. O<strong>the</strong>r states that had substantial <strong>in</strong>vestment were<br />
Texas (101 transactions), Florida (53), New Jersey (44), Hawaii (34), and<br />
Ohio, and Pennsylvania (33 each). These eight states, with a total of 621<br />
transactions, accounted for 61 percent of <strong>the</strong> <strong>in</strong>vestment transactions<br />
identified <strong>in</strong> 1990 (Figure 4).<br />
Figure 4<br />
NUMBER OF INVESTMENTS BY STATE<br />
1990<br />
New York 129<br />
Total 1018= 100%<br />
A slightly different picture emerges based on dollar values. Accord<strong>in</strong>g to <strong>the</strong><br />
transaction values identified, California was <strong>the</strong> lead<strong>in</strong>g recipient with $20.2<br />
billion, followed by New York ($5.3 billion), Pennsylvania ($4.0 billion), Texas<br />
($3.5 billion), Massachusetts ($3.4 billion), Ohio ($2.7 billion), New Jersey<br />
($2.5 billion), and Wash<strong>in</strong>gton ($1.7 billion).