Foreign Direct Investment in the United States. Transactions
Foreign Direct Investment in the United States. Transactions
Foreign Direct Investment in the United States. Transactions

Create successful ePaper yourself
Turn your PDF publications into a flip-book with our unique Google optimized e-Paper software.
Digitized for FRASER<br />
Federal Reserve Bank of St.Louis<br />
-17-<br />
INVESTMENT BY INDUSTRY<br />
The manufactur<strong>in</strong>g sector cont<strong>in</strong>ued to dom<strong>in</strong>ate <strong>the</strong> number of foreign direct<br />
<strong>in</strong>vestment transactions and aggregate values, as it has done <strong>in</strong> past years. In<br />
1990, <strong>the</strong>re were 430 transactions with 214 identified values that totaled $25.5<br />
billion. With<strong>in</strong> <strong>the</strong> manufactur<strong>in</strong>g sector, chemicals and allied products had<br />
<strong>the</strong> most <strong>in</strong>vestments by a large marg<strong>in</strong>, followed by stone, clay, and glass<br />
products, and rubber and miscellaneous plastics products.<br />
The services sector aga<strong>in</strong> was <strong>the</strong> second most attractive area to foreign<br />
<strong>in</strong>vestors; <strong>the</strong>re were 119 transactions with 72 identified values that totaled<br />
$14.0 billion. The real estate <strong>in</strong>dustry (<strong>in</strong>clud<strong>in</strong>g hotels) also attracted a large<br />
number of foreign <strong>in</strong>vestors. There were 147 transactions with 115 available<br />
values that totaled $7.0 billion.<br />
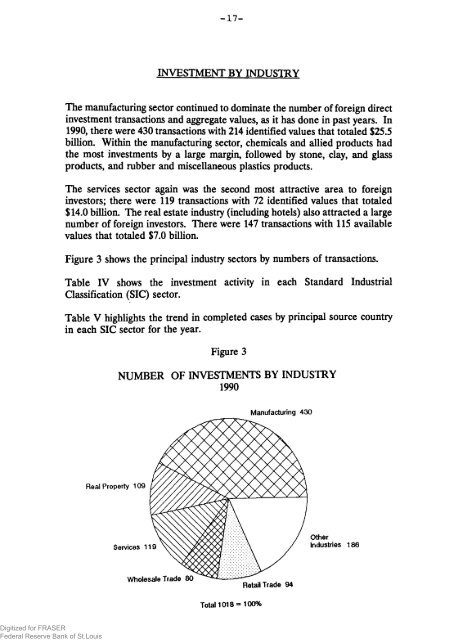
Figure 3 shows <strong>the</strong> pr<strong>in</strong>cipal <strong>in</strong>dustry sectors by numbers of transactions.<br />
Table IV shows <strong>the</strong> <strong>in</strong>vestment activity <strong>in</strong> each Standard Industrial<br />
Classification (SIC) sector.<br />
Table V highlights <strong>the</strong> trend <strong>in</strong> completed cases by pr<strong>in</strong>cipal source country<br />
<strong>in</strong> each SIC sector for <strong>the</strong> year.<br />
Real Property 109<br />
Figure 3<br />
NUMBER OF INVESTMENTS BY INDUSTRY<br />
1990<br />
Services V<br />
W holsim w —<br />
Total 1018 =* 100%<br />
Manufactur<strong>in</strong>g 430<br />
Retail Trade 94<br />
O<strong>the</strong>r<br />
Industries 186