Interim Report January–March 2012 - Tele2
Interim Report January–March 2012 - Tele2
Interim Report January–March 2012 - Tele2

Create successful ePaper yourself
Turn your PDF publications into a flip-book with our unique Google optimized e-Paper software.
<strong>Interim</strong> <strong>Report</strong><br />
January-March <strong>2012</strong><br />
Q1 <strong>2012</strong> Highlights<br />
Net sales growth for the<br />
group amounted to 8 percent<br />
excluding exchange rate<br />
differences<br />
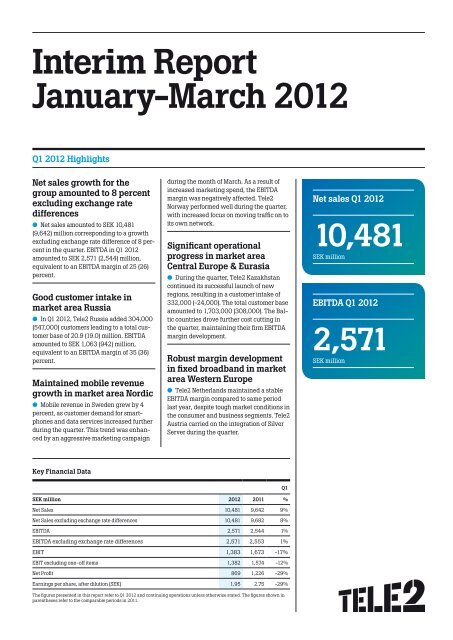
● Net sales amounted to SEK 10,481<br />
(9,642) million corresponding to a growth<br />
excluding exchange rate difference of 8 percent<br />
in the quarter. EBITDA in Q1 <strong>2012</strong><br />
amounted to SEK 2,571 (2,544) million,<br />
equivalent to an EBITDA margin of 25 (26)<br />
percent.<br />
Good customer intake in<br />
market area Russia<br />
● In Q1 <strong>2012</strong>, <strong>Tele2</strong> Russia added 304,000<br />
(547,000) customers leading to a total customer<br />
base of 20.9 (19.0) million. EBITDA<br />
amounted to SEK 1,063 (942) million,<br />
equivalent to an EBITDA margin of 35 (36)<br />
percent.<br />
Maintained mobile revenue<br />
growth in market area Nordic<br />
● Mobile revenue in Sweden grew by 4<br />
percent, as customer demand for smartphones<br />
and data services increased further<br />
during the quarter. This trend was enhanced<br />
by an aggressive marketing campaign<br />
Key Financial Data<br />
during the month of March. As a result of<br />
increased marketing spend, the EBITDA<br />
margin was negatively affected. <strong>Tele2</strong><br />
Norway performed well during the quarter,<br />
with increased focus on moving traffic on to<br />
its own network.<br />
Significant operational<br />
progress in market area<br />
Central Europe & Eurasia<br />
● During the quarter, <strong>Tele2</strong> Kazakhstan<br />
continued its successful launch of new<br />
regions, resulting in a customer intake of<br />
332,000 (24,000). The total customer base<br />
amounted to 1,703,000 (308,000). The Baltic<br />
countries drove further cost cutting in<br />
the quarter, maintaining their firm EBITDA<br />
margin development.<br />
Robust margin development<br />
in fixed broadband in market<br />
area Western Europe<br />
● <strong>Tele2</strong> Netherlands maintained a stable<br />
EBITDA margin compared to same period<br />
last year, despite tough market conditions in<br />
the consumer and business segments. <strong>Tele2</strong><br />
Austria carried on the integration of Silver<br />
Server during the quarter.<br />
SEK million <strong>2012</strong> 2011 %<br />
Net Sales 10,481 9,642 9%<br />
Net Sales excluding exchange rate differences 10,481 9,682 8%<br />
EBITDA 2,571 2,544 1%<br />
EBITDA excluding exchange rate differences 2,571 2,553 1%<br />
EBIT 1,383 1,673 17%<br />
EBIT excluding oneoff items 1,382 1,574 12%<br />
Net Profit 869 1,226 29%<br />
Earnings per share, after dilution (SEK) 1.95 2.75 29%<br />
The figures presented in this report refer to Q1 <strong>2012</strong> and continuing operations unless otherwise stated. The figures shown in<br />
parentheses refer to the comparable periods in 2011.<br />
Q1<br />
Net sales Q1 <strong>2012</strong><br />
10,481<br />
SEK million<br />
EBITDA Q1 <strong>2012</strong><br />
2,571<br />
SEK million
CEO comment<br />
The first quarter of <strong>2012</strong> was as challenging as expected; many of the structural trends foreseen<br />
in our industry are now materializing. At <strong>Tele2</strong>, we concentrated our efforts on maintaining strong<br />
customer momentum and continued to show solid revenue growth in our main markets.<br />
We embrace the accelerating move from<br />
voice to data and migration from prepaid to<br />
postpaid. We believe this is a natural evolution<br />
likely to improve the operational performance<br />
of mobile operators over the medium<br />
term. More immediate and readily evident in<br />
Q1 <strong>2012</strong> are additional costs associated with<br />
the transition from traditional voice to a<br />
more data centric emerging business model.<br />
Still, the first quarter of <strong>2012</strong> has continued<br />
to show solid revenue growth in our<br />
main markets. We concentrated our efforts<br />
on maintaining strong customer momentum<br />
within our entire mobile arena.<br />
Our achievements in Russia again proved<br />
satisfactory in revenue and customer intake.<br />
Our Russian operation added more than<br />
300,000 customers in Q1 <strong>2012</strong> and ARPU development was more<br />
robust than we had indicated previously. Nevertheless, the easing of<br />
EBITDA margins, which we anticipated from seasonal marketingrelated<br />
costs, was greater as we accelerated customer intake, especially<br />
in more strategic regions. The operational benefits of a larger<br />
customer base at the beginning the year should be visible in subsequent<br />
quarters. On the regulatory side, <strong>Tele2</strong> completed its tests of<br />
LTE technology over 1800 MHz frequencies on own network in<br />
Omsk, and demonstrated as predicted that LTE and GSM can coexist<br />
over defined spectrum without causing deterioration of voice quality.<br />
Further, speeds of up to 75 Mbps (2040 Mbps on average<br />
downlink) were reached over LTE. The Radio Research and Development<br />
Institute (NIIR) will now analyse the results and write a recommendation<br />
to the State Radio Frequency Commission (SRFC),<br />
which will then take a formal decision on whether to allow LTE on<br />
1800MHz in Russia. We look forward to the authorities’ conclusions,<br />
expected during <strong>2012</strong>, and believe that they will confirm the regulatory<br />
bodies’ support for regional operators.<br />
Our Nordic operations experienced a competitive quarter. In Sweden,<br />
the impact of the transition from voice to data in our industry is<br />
real and can be felt today. With fierce competition in the market, we<br />
needed to execute our strategy by protecting our price and value<br />
position; we are aware that this bears a cost that we shall address<br />
internally in coming quarters. The price war waged indicates a<br />
change in the context of our business; we must continue to adjust to<br />
this new reality organizationally, effectively and efficiently. The<br />
“Smartphones will<br />
enable us to grow with<br />
customer needs, to<br />
serve their changing<br />
requirements with<br />
greater access and<br />
consistently closer<br />
customer care.”<br />
integration of Network Norway is well under<br />
way. We are presently working on our brand<br />
positioning and have already seen evidence<br />
of emerging lower price competition during<br />
this quarter.<br />
Our operations in the Netherlands are<br />
delivering stable EBITDA margins within<br />
fixed broadband. We are still evaluating the<br />
potential of 4G networks with the auction<br />
taking place only in October. <strong>Tele2</strong> Austria<br />
reinforced its focus in the B2B market by<br />
integrating the local Business Provider<br />
Silver Server.<br />
The growth in the market area Central<br />
Europe & Eurasia was mainly driven by<br />
<strong>Tele2</strong> Kazakhstan‘s robust performance<br />
during the quarter. The Kazakh operation<br />
added more than 300 000 customers, taking its subscriber base to<br />
1.7 million, and successfully launched two new regions. We see<br />
good traction and a strong demand for our services in the market:<br />
we are on our way to surpassing the upper end of our guidance at<br />
yearend. The development of <strong>Tele2</strong> Croatia’s operation in Q1 <strong>2012</strong><br />
is disappointing; we have made organizational changes to promote<br />
a fresh start, with the aim of gaining momentum in the market<br />
through revenue share and radically improved profitability.<br />
We are in the midst of transformation and increased challenges in<br />
our industry, with <strong>Tele2</strong> embracing change and introducing full<br />
data service bundles, while competitors still resist. As I see it, smartphones<br />
will enable us to grow with consumer needs, to service their<br />
changing requirements with greater access and consistently closer<br />
customer care. Furthermore, through data enabled networks, we<br />
will be able to manage traffic more intelligently and effectively and<br />
to introduce more agile pricing alongside quality of service. There is<br />
real and fundamental value in our two major assets: access to the<br />
network and access to the customer. We should manage to charge<br />
for them profitably.<br />
Indeed, there are lots of changes – and with them many new<br />
opportunities for those operators ready to add value. And for sure,<br />
<strong>Tele2</strong> is well positioned to capitalize on those opportunities.<br />
Mats Granryd<br />
President and CEO, <strong>Tele2</strong> AB<br />
<strong>Tele2</strong> – <strong>Interim</strong> <strong>Report</strong> <strong>January–March</strong> <strong>2012</strong> 2 (30)
Financial Overview<br />
<strong>Tele2</strong>’s financial performance is driven by its relentless focus on developing mobile services on its<br />
own infrastructure, complemented in certain countries by fixed broadband services and businesstobusiness<br />
offerings. Mobile sales, which grew compared to the same period last year, and greater<br />
efforts to develop mobile services on own infrastructure have further improved <strong>Tele2</strong>’s EBITDA contribution.<br />
The group will concentrate on maximizing the return from fixedline operations, as their<br />
customer base continues to decline.<br />
Net customer intake amounted to 559,000 (399,000) in Q1 <strong>2012</strong>.<br />
The customer intake in mobile services amounted to 679,000<br />
(522,000). This trend was mainly driven by a good customer intake<br />
in <strong>Tele2</strong> Kazakhstan, complemented by solid customer intake in<br />
<strong>Tele2</strong> Russia, whose customer bases grew by 332,000 (24,000)<br />
and 304,000 (547,000) customers respectively. The fixed broadband<br />
customer base lost 22,000 (4,000) customers in Q1 <strong>2012</strong>,<br />
primarily attributable to <strong>Tele2</strong>’s operations in the Netherlands and<br />
in Germany. As expected, the number of fixed telephony customers<br />
fell in Q1 <strong>2012</strong>. On March 31, <strong>2012</strong> the total customer base amounted<br />
to 34,759,000 (31,238,000) thanks to a continued growth in mobile<br />
services.<br />
Net sales in Q1 <strong>2012</strong> amounted to SEK 10,481 (9,642) million corresponding<br />
to a growth excluding exchange rate differences and oneoff<br />
items of 8 percent. The revenue development was mainly a result<br />
of sustained success in mobile services and the integration of Network<br />
Norway, which contributed with SEK 547 million in the quarter.<br />
EBITDA in Q1 <strong>2012</strong> amounted to SEK 2,571 (2,544) million, equivalent<br />
to an EBITDA margin of 25 (26) percent. The EBITDA development<br />
was negatively affected by significant marketing efforts in<br />
both <strong>Tele2</strong> Sweden and <strong>Tele2</strong> Russia as a response to increased<br />
competition.<br />
Net sales<br />
MSEK<br />
12,000<br />
10,000<br />
8,000<br />
6,000<br />
4,000<br />
2,000<br />
0<br />
1) See section EBIT on page 20.<br />
EBIT in Q1 <strong>2012</strong> amounted to SEK 1,382 (1,574) million excluding<br />
oneoff items 1) . Including oneoff items, EBIT amounted to SEK 1,383<br />
(1,673) million. The EBIT development was negatively impacted by<br />
the integration of Network Norway and also an accelerated depreciation<br />
of network equipment in the Baltic region in preparation of a<br />
network replacement amounting to SEK 69 million (Note 2).<br />
Profit before tax in Q1 <strong>2012</strong> amounted to SEK 1,205 (1,599) million.<br />
Net profit in Q1 <strong>2012</strong> amounted to SEK 869 (1,226) million. <strong>Report</strong>ed<br />
tax for Q1 <strong>2012</strong> amounted to SEK 336 (373) million. Tax payment<br />
affecting cash flow amounted to SEK 202 (225) million.<br />
Cash flow after CAPEX in Q1 <strong>2012</strong> amounted to SEK 1,066 (1,166)<br />
million.<br />
CAPEX in Q1 <strong>2012</strong> amounted to SEK 1,043 (1,313) million, driven<br />
mainly by further network expansion in Sweden, Russia and<br />
Kazakhstan.<br />
Net debt amounted to SEK 12,714 (2,152) million on March 31, <strong>2012</strong>,<br />
or 1.13 times 12month rolling EBITDA. <strong>Tele2</strong>’s available liquidity<br />
amounted to SEK 15,656 (16,847) million.<br />
EBITDA / EBITDA margin<br />
MSEK / Percent<br />
Q1 Q2 Q3 Q4 Q1<br />
0<br />
Q1 Q2 Q3 Q4 Q1<br />
2011 <strong>2012</strong> 2011 <strong>2012</strong><br />
3,000<br />
2,500<br />
2,000<br />
1,500<br />
1,000<br />
500<br />
30<br />
25<br />
20<br />
15<br />
10<br />
<strong>Tele2</strong> – <strong>Interim</strong> <strong>Report</strong> <strong>January–March</strong> <strong>2012</strong> 3 (30)<br />
5<br />
0
FINANCIAl GuIDANCE<br />
<strong>Tele2</strong>’s objective is to maintain a healthy balance between growth<br />
regions and more mature markets and to be established in Europe<br />
and Eurasia. The group will secure licences through strong local<br />
connections within the business and political communities in all its<br />
markets. <strong>Tele2</strong>’s core markets are characterized by:<br />
• An established Best Deal position.<br />
• The capability to reach a top 2 position in terms of customer market<br />
share, in an individual country or region.<br />
• A mobile operation based on own infrastructure should return at<br />
least 35 percent EBITDA margin.<br />
• All operations in the group should have at least 24 percent return<br />
on capital employed (ROCE).<br />
<strong>Tele2</strong> group forward looking statement<br />
The following assumptions should be taken into account when estimating<br />
<strong>2012</strong> results for the group:<br />
• <strong>Tele2</strong> forecasts a corporate tax rate of approximately 24 percent<br />
excluding oneoff items. The tax payment will affect cash flow by<br />
approximately SEK 1,200 million.<br />
• <strong>Tele2</strong> forecasts a capex level of approximately SEK 5,500 (earlier<br />
SEK 6,000) million.<br />
<strong>Tele2</strong> Sweden forward looking statement<br />
The following assumptions should be taken into account when<br />
estimating the operational performance of the Swedish mobile<br />
operations in <strong>2012</strong>:<br />
• <strong>Tele2</strong> expects mobile service revenue to grow by approximately<br />
3–5 (earlier 2–4) percent.<br />
• <strong>Tele2</strong> expects an EBITDA margin of between 30–32 (earlier<br />
33–35) percent assuming a stable market environment.<br />
<strong>Tele2</strong> Norway forward looking statement<br />
The following assumptions should be taken into account when<br />
estimating the operational performance of the total operations in<br />
Norway in <strong>2012</strong>:<br />
• <strong>Tele2</strong> expects a total revenue of between SEK 5,000–5,200<br />
million.<br />
• <strong>Tele2</strong> expects an EBITDA margin of between 2–3 percent.<br />
• <strong>Tele2</strong> expects capex of between SEK 850–950 million.<br />
<strong>Tele2</strong> Russia forward looking statement<br />
The following assumptions should be taken into account when estimating<br />
the operational performance of the total operations in Russia<br />
in <strong>2012</strong>:<br />
• <strong>Tele2</strong> expects the subscriber base to reach 21.5–22 million.<br />
SIGNIFICANT EVENTS IN THE QuARTER<br />
■ <strong>Tele2</strong> Lithuania was awarded a mobile license in Lithuania of<br />
2 x 20 MHz in the 2.6 GHz frequency band.<br />
■ <strong>Tele2</strong> Latvia was awarded a mobile license in Latvia of 2 x 20 MHz<br />
in the 2.6 GHz frequency band for SEK 9 million.<br />
■ <strong>Tele2</strong> Russia and the State Radio Institute successfully finalized<br />
the tests of LTE technology over 1800 MHz frequencies in Omsk.<br />
■ <strong>Tele2</strong> AB completed the issuance of NOK 1.3 billion in the<br />
Norwegian bond market.<br />
■ <strong>Tele2</strong> Russia completed a RUB 7 billion bond issue.<br />
• <strong>Tele2</strong> expects a percentage growth of ARPU in low single digits<br />
(earlier to remain stable) in local currency.<br />
• <strong>Tele2</strong> expects an EBITDA margin of between 37–39<br />
(earlier 39–40) percent.<br />
• <strong>Tele2</strong> expects capex of between SEK 1,300–1,500 million.<br />
<strong>Tele2</strong> Kazakhstan forward looking statement<br />
The following assumptions should be taken into account when<br />
estimating the operational performance of the total operations in<br />
Kazakhstan in <strong>2012</strong>:<br />
• <strong>Tele2</strong> expects the subscriber base to reach 2.5–2.7 (earlier 2.3–<br />
2.5) million.<br />
• <strong>Tele2</strong> expects an EBITDA contribution of between SEK –350 to<br />
–400 (earlier –325 to –375) million.<br />
• <strong>Tele2</strong> expects capex of between SEK 550–600 million.<br />
• <strong>Tele2</strong> expects to reach EBITDA breakeven by 2H 2013.<br />
• <strong>Tele2</strong> expects to reach a longterm mobile customer market share<br />
of 30 percent.<br />
<strong>Tele2</strong> Croatia forward looking statement<br />
The following assumptions should be taken into account when estimating<br />
the operational performance of the Croatian mobile operations<br />
in <strong>2012</strong>:<br />
• <strong>Tele2</strong> expects Croatia to reach an EBITDA margin of 20 percent by<br />
Q3 2013.<br />
Shareholder remuneration<br />
<strong>Tele2</strong> will seek to pay a progressive ordinary dividend of 50 percent<br />
or more of net income excluding oneoff items. Extraordinary dividends<br />
and the authority to purchase <strong>Tele2</strong>’s own shares will be<br />
sought when the anticipated total return to shareholders is deemed<br />
to be greater than the achievable returns from the deployment of the<br />
capital within the group’s operating segments or the acquisition of<br />
assets within <strong>Tele2</strong>’s economic requirements.<br />
In respect of the financial year 2011, the Board of <strong>Tele2</strong> AB has<br />
decided to recommend to the Annual General Meeting (AGM) in May<br />
<strong>2012</strong> a total dividend payment of SEK 13.00 (27.00) per ordinary A<br />
or B share, to be comprised of an ordinary dividend of SEK 6.50<br />
(6.00) and an extraordinary dividend of SEK 6.50 (21.00).<br />
Balance sheet<br />
<strong>Tele2</strong> has a target net debt to EBITDA ratio of between 1.25 and 1.75<br />
times over the medium term. The group’s longer term financial leverage<br />
should be in line with the industry and the markets in which<br />
it operates, and reflect the status of its operations, future strategic<br />
opportunities and contingent liabilities.<br />
■ <strong>Tele2</strong> AB completed a first issue under a Swedish Commercial<br />
Paper Program.<br />
■ <strong>Tele2</strong> Estonia completed the acquisition of telecommunication<br />
service provider Televörgu AS for SEK 222 million (Note 9).<br />
Significant subsequent events<br />
■ <strong>Tele2</strong> Russia issued a RUB 6 billion bond issue.<br />
■ <strong>Tele2</strong> AB established an EMTN programme.<br />
<strong>Tele2</strong> – <strong>Interim</strong> <strong>Report</strong> <strong>January–March</strong> <strong>2012</strong> 4 (30)
SEK million Q1 <strong>2012</strong> Q1 2011 FY 2011<br />
Mobile 1)<br />
Net customer intake (thousands) 679 522 3,413<br />
Net sales 7,861 6,730 29,668<br />
EBITDA 1,919 1,907 8,440<br />
EBIT 1,024 1,271 5,625<br />
CAPEX 786 930 4,727<br />
Fixed broadband1) Net customer intake (thousands) 22 4 70<br />
Net sales 1,462 1,510 6,022<br />
EBITDA 361 332 1,475<br />
EBIT 133 107 535<br />
CAPEX 118 163 643<br />
Fixed telephony1) Net customer intake (thousands) 98 119 573<br />
Net sales 784 974 3,655<br />
EBITDA 248 265 1,090<br />
EBIT 220 220 911<br />
CAPEX 10 17 70<br />
Total<br />
Net customer intake (thousands) 559 399 2,770<br />
Net sales 10,481 9,642 41,001<br />
EBITDA 2,571 2,544 11,212<br />
EBIT2) 1,383 1,673 7,050<br />
CAPEX 1,043 1,313 6,105<br />
EBT 1,205 1,599 6,376<br />
Net profit 869 1,226 4,904<br />
Cash flow from operating activities 1,896 2,182 9,690<br />
Cash flow after CAPEX 1,066 1,166 4,118<br />
1) Exluding oneoff items (see sections Net sales and EBIT on pages 16 and 20).<br />
2) Total EBIT includes result from sale of operations and other oneoff items stated under the segment reporting section of EBIT (page 20).<br />
Net sales per product area, Q1 <strong>2012</strong><br />
Percent<br />
Mobile 75%<br />
Fixed broadband 14%<br />
Fixed telephony 7%<br />
Other 4%<br />
Net sales per country, Q1 <strong>2012</strong><br />
Percent<br />
Sweden 29%<br />
Russia 29%<br />
Netherlands 13%<br />
Norway 11%<br />
Austria 3%<br />
Lithuania 3%<br />
Croatia 3%<br />
Latvia 2%<br />
Germany 2%<br />
Estonia 2%<br />
Kazakhstan 2%<br />
Other 1%<br />
<strong>Tele2</strong> – <strong>Interim</strong> <strong>Report</strong> <strong>January–March</strong> <strong>2012</strong> 5 (30)
Overview by region<br />
EXTERNAl SAlES lESS EXCHANGE RATE FluCTuATIONS<br />
<strong>2012</strong> 2011 2011<br />
Q1 Q1 * Growth Full Year<br />
Sweden 3,071 3,069 0% 12,575<br />
Norway 1,135 703 61% 3,319<br />
Russia 3,048 2,625 16% 11,463<br />
Estonia 208 189 10% 839<br />
Lithuania 290 282 3% 1,254<br />
Latvia 238 262 9% 1,094<br />
Croatia 267 271 1% 1,301<br />
Kazakhstan 165 30 450% 346<br />
Netherlands 1,350 1,473 8% 5,823<br />
Germany 254 290 12% 1,096<br />
Austria 354 343 3% 1,377<br />
Other 101 145 30% 514<br />
10,481 9,682 8% 41,001<br />
FX effects 40 1%<br />
Total 10,481 9,642 9% 41,001<br />
* Adjusted for fluctuations in exchange rates.<br />
NORDIC<br />
The Nordic market area delivers strong cash flow to the <strong>Tele2</strong> group<br />
and is the test bed for new services.<br />
Sweden<br />
Mobile Q1 <strong>2012</strong> was characterized by increased competition dominated<br />
by aggressive marketing campaigns in March. Despite being<br />
challenged, <strong>Tele2</strong> Sweden successfully defended its price leadership<br />
position in a dynamic market through a temporary campaign<br />
that ran from 8 of March to 11 of April. The campaign generated in<br />
total 148,000 gross postpaid customers of which 65,000 in the<br />
month of March. During the quarter, <strong>Tele2</strong> Sweden maintained its<br />
efforts to move existing prepaid customers into postpaid bundles.<br />
Furthermore, a higher level of <strong>Tele2</strong> customers prolonged their postpaid<br />
contracts with the company, further to the attractive service<br />
packages offered to the market during the quarter. The prepaid to<br />
postpaid migration in the market is clearly visible as mobile postpaid<br />
net intake for the quarter was 51,000 (35,000), while mobile<br />
prepaid net intake was 74,000 (35,000). The underlying growth<br />
for the total intake was mainly driven by customers’ continued<br />
demand for smartphones, boosted by the temporary campaign on<br />
postpaid subscriptions. The smartphone installed base continued to<br />
grow, due to the increased sales of lowend smartphones.<br />
The mobile EBITDA margin reached 28 (33) percent in the quarter.<br />
The margin was primarily affected by increased sales cost<br />
related to the temporary campaign on postpaid subscription including<br />
a subsidized smartphone.<br />
MoU for the mobile operations in Sweden was 241 (247) and a<br />
blended ARPU of SEK 180 (183) was reported in the quarter. MoU in<br />
the postpaid segment was 291 (293) and ARPU amounted to SEK<br />
233 (238).<br />
<strong>Tele2</strong> Sweden continued the rollout of the combined 2G and 4G<br />
networks in the joint venture Net4Mobililty, covering at the end of<br />
Q1 <strong>2012</strong> 110 municipalities and 5.7 million people, with what will<br />
become the most extensive 4G network in the country.<br />
In the Business segment, Q1 showed continued improved intake<br />
in the Communication as a Service area, as well as a growth in customer<br />
base and overall EBITDA above expectations.<br />
EBITDA lESS EXCHANGE RATE FluCTuATIONS<br />
<strong>2012</strong> 2011 2011<br />
Q1 Q1 * Growth Full Year<br />
Sweden 774 840 8% 3,665<br />
Norway 25 40 38% 20<br />
Russia 1,063 952 12% 4,480<br />
Estonia 57 51 12% 234<br />
Lithuania 121 113 7% 451<br />
Latvia 88 86 2% 380<br />
Croatia 7 1 600% 78<br />
Kazakhstan 97 73 33% –401<br />
Netherlands 409 415 1% 1,806<br />
Germany 91 84 8% 352<br />
Austria 82 81 1% 325<br />
Other 49 37 32% –178<br />
2,571 2,553 1% 11,212<br />
FX effects 9 0%<br />
Total 2,571 2,544 1% 11,212<br />
Fixed Broadband <strong>Tele2</strong> Sweden experienced further growth in<br />
profitability during the quarter, mainly driven by reduced operational<br />
costs and increased prices in the ADSL and Coaxial cable segments.<br />
The EBITDA margin for the fixed broadband segment was<br />
9 (3) percent.<br />
Fixed Telephony <strong>Tele2</strong> Sweden reported an EBITDA margin of<br />
25 (22) percent during the first quarter, and saw, as expected, a<br />
continued decrease in demand for fixed telephony.<br />
Norway<br />
Mobile In the quarter, <strong>Tele2</strong> Norway reported revenues of SEK<br />
1,060 (597) million, impacted by the acquisition of Network Norway.<br />
The revenue from the acquired company amounted to SEK 547 million<br />
in Q1 <strong>2012</strong>.<br />
<strong>Tele2</strong> Norway has had a successful quarter with a good net intake<br />
and satisfactory profitability. In the residential market, sales campaigns<br />
focused on smartphones bundled with fixedprice subscriptions.<br />
All brands have been aiming to increase the share of fixedprice<br />
subscriptions in order to secure revenue streams.<br />
<strong>Tele2</strong> Norway reached an EBITDA contribution of SEK 15 (21) million<br />
in Q1 <strong>2012</strong>, heavily impacted by the reduction in termination<br />
rates. However, the operational performance was helped by more<br />
traffic volume being moved to our own network.<br />
The rollout is progressing according to plan with SEK 99 (35)<br />
million in CAPEX in Q1 <strong>2012</strong>.<br />
Fixed Telephony Fixed telephony showed a stable development of<br />
revenue and profitability during Q1 <strong>2012</strong>. Fixed telephony had an<br />
EBITDA contribution of SEK 10 (18) million in the first quarter.<br />
<strong>Tele2</strong> – <strong>Interim</strong> <strong>Report</strong> <strong>January–March</strong> <strong>2012</strong> 6 (30)
RuSSIA<br />
The Russian operation is <strong>Tele2</strong>’s most significant growth engine.<br />
The company has GSM licences in 43 regions covering approximately<br />
62 million inhabitants. <strong>Tele2</strong> Russia’s strategy is to have<br />
a balanced approach to rolling out new regions, while maintaining<br />
a stable profitability in the more mature regions.<br />
Mobile The overall operational development in the quarter was<br />
affected by seasonally higher marketing spend in the beginning of<br />
the year, resulting in a strong customer intake but also in a lower<br />
EBITDA contribution. The higher marketing spend was due to a<br />
higher level of active initiatives in tariff promotion and SIMcard<br />
sales meant to strengthen the company’s price leadership position,<br />
especially in more strategic regions. By accelerating the customer<br />
growth in the first quarter, <strong>Tele2</strong> Russia will benefit from additional<br />
operational leverage throughout the rest of the year. EBITDA<br />
amounted to SEK 1,063 (942) million, equivalent to a margin of 35<br />
(36) percent.<br />
The total customer base grew by 304,000 (547,000) in Q1 <strong>2012</strong>.<br />
During the last 12 months, <strong>Tele2</strong> Russia’s customer base has grown<br />
by 1,955,000 new users, proving that there is a continued solid<br />
demand for the group’s services despite competitors’ introduction<br />
of 3G services. The total customer base amounted to 20,940,000<br />
(18,985,000) at the end of Q1 <strong>2012</strong>. The churn level of the total customer<br />
base was stable during the quarter in spite of severe and sustained<br />
competitive pressure. <strong>Tele2</strong> Russia will maintain its effort to<br />
be best in class in customer retention and continue to work with a<br />
commission structure to the retail channels in order to further<br />
enhance the quality of customer intake.<br />
Despite an impact from customer base growth in new regions<br />
with lower initial service usage, and generally high competitive<br />
pressure throughout <strong>Tele2</strong> Russia’s footprint, MoU for the total operations<br />
increased by 7 percent compared to the yearearlier period,<br />
amounting to 246 (229). ARPU was SEK 49 (46) or RUB 218 (209).<br />
On the regulatory side, <strong>Tele2</strong> has gained a better understanding<br />
of the Russian market and set clear operational priorities in a complex<br />
environment. During the quarter, <strong>Tele2</strong> Russia completed successful<br />
tests of LTE technology over 1800 MHz frequencies on its<br />
own network in Omsk. The tests were performed according to a<br />
methodology developed by the Radio Research and Development<br />
Institute (NIIR) and with the assistance of its experts. The conclusions<br />
of the technology neutrality study of the Russian 1800 spectrum<br />
are expected during <strong>2012</strong>. <strong>Tele2</strong> believes that the regulatory<br />
authorities will maintain their established support to the regional<br />
operators and enable them to provide essential futureproof data<br />
services.<br />
<strong>Tele2</strong> Russia will keep looking for possibilities to carefully expand<br />
its operations through new licences as well as by complementary<br />
acquisitions.<br />
CENTRAl EuROPE AND EuRASIA<br />
<strong>Tele2</strong>’s Baltic operations will remain focused on generating a strong<br />
cash flow contribution as the economies in the region stabilize.<br />
<strong>Tele2</strong> Croatia’s operation is a challenger, as it offers the Best Deal in<br />
both mobile telephony and mobile broadband. <strong>Tele2</strong> Kazakhstan’s<br />
operation is the latest growth opportunity for the group.<br />
Estonia<br />
Mobile Mobile business showed positive operational development<br />
in Q1 <strong>2012</strong>, as year on year EBITDA grew by 6 percent. Nevertheless,<br />
net intake was negative in the residential postpaid segment due to<br />
heavy competition and aggressive telemarketing campaigns from<br />
other operators.<br />
<strong>Tele2</strong> Estonia started in the quarter to focus more intensely on the<br />
corporate and wholesale segments. The current market share<br />
within the business segment was approximately 18 percent in 2011,<br />
allowing for further growth.<br />
<strong>Tele2</strong> Estonia acquired Televörgu AS from Eesti Energy during Q1<br />
<strong>2012</strong>. Televörgu AS operates optical fibre network across Estonia.<br />
The acquisition will contribute to strengthening <strong>Tele2</strong>’s position in<br />
the Estonian market, providing unlimited access to backbone infrastructure<br />
for own needs until 2025 (Note 9).<br />
lithuania<br />
Mobile <strong>Tele2</strong> Lithuania kept demonstrating stable financial<br />
performance during the quarter, in spite of a demanding economic<br />
climate.<br />
Thanks to successful sales and marketing activities, <strong>Tele2</strong> Lithuania<br />
achieved a positive customer intake during the quarter. More<br />
specifically, improvements can be attributed to good postpaid churn<br />
management. As a result, the quarterly churn number decreased<br />
compared to the same quarter last year.<br />
Revenue increased compared to the same period last year despite<br />
a negative impact derived from lower interconnect rates.<br />
In Q1 <strong>2012</strong>, EBITDA grew compared to last year helped by better<br />
cost control and higher revenue generation.<br />
<strong>Tele2</strong> Lithuania will keep focusing on growing its market share in<br />
the business segment, benefiting from general price sensitivity<br />
among private companies and stateowned organizations. Furthermore,<br />
<strong>Tele2</strong> will continue to capitalize on the mobile broadband<br />
sales growth momentum.<br />
latvia<br />
Mobile Although operating in a highly competitive market, <strong>Tele2</strong><br />
Latvia delivered solid financial performance in Q1 <strong>2012</strong>. Increased<br />
operational efficiency, uptake of data packages and a high level of<br />
customer satisfaction leading to lower churn resulted in improved<br />
EBITDA contribution. The revenue development was impacted by<br />
lower termination rates during the quarter, resulting in a revenue<br />
decline.<br />
<strong>Tele2</strong> Latvia focused on the development of products and sales<br />
performance, while further developing infrastructure in terms of<br />
coverage, capacity and data capabilities.<br />
The company will continue to strengthen its market position by<br />
maintaining its price leadership and concentrating its efforts on the<br />
postpaid and corporate customer segments.<br />
<strong>Tele2</strong> – <strong>Interim</strong> <strong>Report</strong> <strong>January–March</strong> <strong>2012</strong> 7 (30)
Croatia<br />
Mobile The development of <strong>Tele2</strong> Croatia’s operation in Q1 <strong>2012</strong><br />
was below expectations. As a result, the company made organizational<br />
changes to promote a fresh start, with the aim of gaining<br />
momentum in the market through revenue share and improved<br />
profitability.<br />
In Q1 <strong>2012</strong>, <strong>Tele2</strong> Croatia added 12,000 (17,000) customers in<br />
combination with a positive EBITDA result. The EBITDA contribution<br />
was driven by continued positive development in domestic revenue<br />
market share with a particular focus on the high growth postpaid<br />
smartphone segment, the business postpaid segment, and the prepaid<br />
voice segment.<br />
The increase in customer generated revenue was offset by lower<br />
termination rates during the quarter, resulting in a revenue decline.<br />
The gross margin continued to improve from the network rollout<br />
reducing <strong>Tele2</strong> Croatia’s reliance on national roaming.<br />
Kazakhstan<br />
Mobile In Q1 <strong>2012</strong>, <strong>Tele2</strong> Kazakhstan continued to launch new<br />
regions and to develop its existing operations. In March, <strong>Tele2</strong> successfully<br />
launched the SouthKazakhstan region (Shymkent city),<br />
the most populated region in Kazakhstan, and the Zhambyl region<br />
(Taraz city), another region with a population of more than 1 million.<br />
In existing regions, <strong>Tele2</strong> introduced new attractive tariff plans and<br />
organized a series of minilaunches in towns, while working on<br />
building regional distribution networks and brand awareness. In<br />
Q2 <strong>2012</strong>, <strong>Tele2</strong> will launch the remaining regions Kyzylorda and<br />
Atyrau.<br />
At the end of March, <strong>Tele2</strong> Kazakhstan introduced offers for business<br />
clients, targeted at small and medium enterprises.<br />
Launches in new regions and further development in existing<br />
regions were supported by network deployment. Net intake was<br />
332,000 (24,000), taking the total active customer base to<br />
1,703,000.<br />
Further network expansion, quality and coverage improvement,<br />
especially in small towns and rural areas, will allow the company to<br />
increase its commercial activity and attract new customers in different<br />
regions of Kazakhstan.<br />
Lastly, <strong>Tele2</strong> Kazakhstan will continue to strengthen its price<br />
leadership position by further developing marketing and sales<br />
activities.<br />
WESTERN EuROPE<br />
<strong>Tele2</strong>’s operations in Western Europe lead the group in business to<br />
business services and consumer fixed broadband.<br />
Netherlands<br />
<strong>Tele2</strong> Netherlands’ underlying revenue and cash flow performance<br />
during Q1 <strong>2012</strong> was in line with the previous quarters. Higher<br />
expansion costs, caused by growing mobile intake in retail and<br />
successful SME partner sales, resulted in lower EBITDA levels.<br />
Mobile <strong>Tele2</strong> Netherlands increased its focus on mobile operations<br />
and continued to benefit from the addition of new retail and online<br />
distribution channels. In Q1 <strong>2012</strong>, the mobile customer base grew<br />
mainly through intake in the high value postpaid segment, driven<br />
by a new marketing campaign called SmartMix. This new tariff plan<br />
offers customers the freedom to compose their own mix of voice and<br />
data, thereby setting <strong>Tele2</strong> apart from other providers in the Dutch<br />
market. Prepaid intake continued to show stable performance.<br />
Fixed Broadband <strong>Tele2</strong> encountered fierce competition in the residential<br />
broadband market but managed to slow the impact on its<br />
customer base by means of successful campaigns. Customers preferred<br />
bundled services over single play products. In the business<br />
segment, <strong>Tele2</strong> Netherlands showed an increasing intake of new<br />
business contracts, mainly driven by an extensive partner sales program<br />
in the SME segment.<br />
Fixed Telephony Both customer base and usage declined in line<br />
with market trends. <strong>Tele2</strong> continued to focus on retention and<br />
migration to broadband products in order to maximize value.<br />
Germany<br />
During Q1 <strong>2012</strong>, <strong>Tele2</strong> Germany kept its focus on intensifying activities<br />
in the mobile segment, on customer base management and on<br />
operational excellence within the fixed telephony and broadband<br />
segments. This resulted in both a stabilization of the customer base<br />
and an overall improved profitability.<br />
Mobile The demand for cost effective home telephony (via mobile<br />
network) products continued to show positive trends in Q1 <strong>2012</strong>,<br />
resulting in a net intake fully in line with expectations. The same<br />
trend was visible for the internet and telephony home product based<br />
on UMTS/3G backhaul. The efficiency of all sales and provisioning<br />
processes was monitored and managed closely to keep profitability<br />
at a stable level.<br />
Fixed Broadband <strong>Tele2</strong> Germany’s continuous efforts and activities<br />
in retention and customer base management led to a stable<br />
profitability in the broadband segment during the quarter.<br />
Fixed Telephony The market segments “Call by Call” and Carrier<br />
PreSelection were still declining in Q1 <strong>2012</strong>. But advancing saturation<br />
of the broadband market was accompanied by a slowdown of<br />
this decline in voice only. <strong>Tele2</strong> Germany maintained its solid position<br />
in the market during the quarter and once again achieved very<br />
satisfying profitability in the fixed telephony segment.<br />
Austria<br />
In the first quarter of <strong>2012</strong>, <strong>Tele2</strong> Austria reinforced its focus in the<br />
business market by integrating the local Business Provider Silver<br />
Server, which enjoys a competitive position in the area of Vienna.<br />
The Austrian operation’s continued healthy financial development is<br />
the direct result of a focused product portfolio and stringent cost<br />
control efforts across the company.<br />
Fixed Broadband Data revenue growth increased slightly due to<br />
newly won contracts and higher usage of existing customers. Following<br />
the strategy of moving from volume to value in the residential<br />
segment, new retention offers based on value segmentation<br />
have been provided to broadband customers.<br />
Fixed Telephony Cross and upselling voice packages with additional<br />
binding prolongation remained the primary activity on voice<br />
packages during the quarter, offsetting the lower minutes of use and<br />
stabilizing the voice revenues.<br />
<strong>Tele2</strong> – <strong>Interim</strong> <strong>Report</strong> <strong>January–March</strong> <strong>2012</strong> 8 (30)
OTHER ITEMS<br />
Risks and uncertainty factors<br />
<strong>Tele2</strong>’s operations are affected by a number of external factors. The<br />
risk factors considered to be most significant to <strong>Tele2</strong>’s future development<br />
are operating risks such as the availability of frequencies<br />
and telecom licences, operations in Russia and Kazakhstan, network<br />
sharing with other parties, integration of new business models,<br />
destructive price competition, changes in regulatory legislation,<br />
and financial risks such as currency risk, interest risk, liquidity risk<br />
and credit risk. In addition to the risks described in <strong>Tele2</strong>’s annual<br />
report for 2011 (see Directors’ report and Note 2 of the report for a<br />
detailed description of <strong>Tele2</strong>’s risk exposure and risk management),<br />
no additional significant risks are estimated to have developed.<br />
COMPANy DISClOSuRE<br />
<strong>Tele2</strong> AB (publ) Annual General Meeting <strong>2012</strong><br />
The <strong>2012</strong> Annual General Meeting will be held on May 7, at 1 p.m.<br />
CET at the Hotel Rival, Mariatorget 3 in Stockholm.<br />
Shareholders who wish to participate in the Annual General<br />
Meeting shall have their names entered in the register of shareholders<br />
maintained by Euroclear Sweden AB on Monday 30 April <strong>2012</strong>,<br />
and notify the company of their intention to participate by no later<br />
than 1.00 p.m. on Monday 30 April <strong>2012</strong>. The notification can be<br />
made on the company’s website, www.tele2.com, by telephone<br />
+46 (0) 771 246 400 or in writing to the company.<br />
Other<br />
<strong>Tele2</strong> will release the financial and operating results for the period<br />
ending June 30, <strong>2012</strong> on July 19, <strong>2012</strong>.<br />
Stockholm, April 19, <strong>2012</strong><br />
<strong>Tele2</strong> AB<br />
Mats Granryd<br />
President and CEO<br />
Review <strong>Report</strong><br />
This interim report have not been subject to specific review by the<br />
company’s auditors.<br />
<strong>Tele2</strong> – <strong>Interim</strong> <strong>Report</strong> <strong>January–March</strong> <strong>2012</strong> 9 (30)
TElEPHONE CONFERENCE<br />
<strong>Tele2</strong> will host a conference call, with an interactive presentation, for the global financial community<br />
at 10.45 am CET (09.45 am UK time/04.45 am NY time) on Thursday, April 19, <strong>2012</strong>. The<br />
conference call will be held in English and also made available as an audiocast on <strong>Tele2</strong>’s dedicated<br />
Q1 <strong>2012</strong> website, reports.tele2.com/<strong>2012</strong>/Q1.<br />
Dial-in information<br />
To ensure that you are connected to the conference call, please dial in a few minutes before the<br />
start of the conference call to register your attendance.<br />
Dial-in numbers<br />
Sweden: +46 8 505 598 53<br />
UK: +44 203 043 24 36<br />
US: +1 866 458 40 87<br />
CONTACTS<br />
Mats Granryd<br />
President & CEO<br />
Telephone: +46 (0)8 562 000 60<br />
lars Nilsson<br />
CFO<br />
Telephone: +46 (0)8 562 000 60<br />
lars Torstensson<br />
Group Director, Corporate Communication<br />
Telephone: +46 (0)8 562 000 42<br />
<strong>Tele2</strong> AB<br />
Company registration nr: 5564108917<br />
Skeppsbron 18<br />
P.O. Box 2094<br />
SE103 13 Stockholm<br />
Sweden<br />
Tel +46 (0)8 562 000 60<br />
www.tele2.com<br />
VISIT OuR WEBSITE: www.tele2.com<br />
APPENDICES<br />
Income statement<br />
Comprehensive income<br />
Change in shareholders’ equity<br />
Balance sheet<br />
Cash flow statement<br />
Number of customers<br />
Net sales<br />
Internal sales<br />
EBITDA<br />
EBIT<br />
CAPEX<br />
Key ratios<br />
Parent company<br />
Notes<br />
TElE2 IS ONE OF EuROPE’S lEADING TElECOM OPERATORS, AlWAyS PROVIDING THE BEST DEAl. We have 35 million customers in 11<br />
countries. <strong>Tele2</strong> offers mobile services, fixed broadband and telephony, data network services, cable TV and content services. Ever since<br />
Jan Stenbeck founded the company in 1993, it has been a tough challenger to the former government monopolies and other established<br />
providers. <strong>Tele2</strong> has been listed on the NASDAQ OMX Stockholm since 1996. In 2011, we had net sales of SEK 41 billion and reported an<br />
operating profit (EBITDA) of SEK 11.2 billion.<br />
<strong>Tele2</strong> – <strong>Interim</strong> <strong>Report</strong> <strong>January–March</strong> <strong>2012</strong> 10 (30)
Income statement<br />
SEK million Note<br />
CONTINuING OPERATIONS<br />
<strong>2012</strong><br />
Jan 1–Mar 31<br />
2011<br />
Jan 1–Mar 31<br />
2011<br />
Full year<br />
Net sales 10,481 9,642 41,001<br />
Operating expenses 2 –9,142 –8,103 –34,178<br />
Other operating income 3 56 204 392<br />
Other operating expenses –12 –70 –165<br />
Operating profit, EBIT 1,383 1,673 7,050<br />
Interest income/costs –178 –41 –483<br />
Exchange rate differences, external –13 –9 –24<br />
Exchange rate differences, intragroup 53 17 13<br />
Other financial items –40 –41 –180<br />
Profit after financial items, EBT 1,205 1,599 6,376<br />
Tax on profit 4 –336 –373 –1,472<br />
NET PROFIT FROM CONTINuING OPERATIONS 869 1,226 4,904<br />
DISCONTINuED OPERATIONS<br />
Net loss from discontinued operations 9 – –13 –7<br />
NET PROFIT 869 1,213 4,897<br />
ATTRIBUTABLE TO<br />
Equity holders of the parent company 869 1,213 4,897<br />
Earnings per share (SEK) 8 1.96 2.73 11.03<br />
Earnings per share, after dilution (SEK) 8 1.95 2.72 10.98<br />
FROM CONTINUING OPERATIONS<br />
Earnings per share (SEK) 8 1.96 2.76 11.05<br />
Earnings per share, after dilution (SEK) 8 1.95 2.75 11.00<br />
<strong>Tele2</strong> – <strong>Interim</strong> <strong>Report</strong> <strong>January–March</strong> <strong>2012</strong> 11 (30)
Comprehensive income<br />
SEK million<br />
<strong>2012</strong><br />
Jan 1–Mar 31<br />
2011<br />
Jan 1–Mar 31<br />
2011<br />
Full year<br />
Net profit 869 1,213 4,897<br />
OTHER COMPREHENSIVE INCOME<br />
Components not to be reclassified to net profit:<br />
Withholding taxes on dividends – – –153<br />
Actuarial losses on defined benefit pension plans – – –59<br />
Actuarial losses on defined benefit pension plans, tax effect – – 15<br />
Total components not to be reclassified to net profit – – –197<br />
Components to be reclassified to net profit:<br />
Exchange rate differences 47 –189 –163<br />
Exchange rate differences, tax effect –145 41 17<br />
Reclassification to net profit of cumulative exchange rate differences from divested companies – 1 11<br />
Gain/loss on cash flow hedges 46 9 –133<br />
Gain/loss on cash flow hedges, tax effect –12 –2 35<br />
Total components to be reclassified to net profit –64 –140 –233<br />
Other comprehensive income for the period, net of tax –64 –140 –430<br />
TOTAl COMPREHENSIVE INCOME FOR THE PERIOD 805 1,073 4,467<br />
ATTRIBUTABLE TO<br />
Equity holders of the parent company 805 1,073 4,467<br />
Change in shareholders’ equity<br />
Mar 31, <strong>2012</strong> Mar 31, 2011 Dec 31, 2011<br />
Attributable to Attributable to Attributable to<br />
equity<br />
Total equity<br />
Total equity<br />
Total<br />
holders of non share holders of non share holders of non share <br />
the parent controlling holders’ the parent controlling holders’ the parent controlling holders’<br />
SEK million Note company interests equity company interests equity company interests equity<br />
Shareholders’ equity, January 1 21,449 3 21,452 28,872 3 28,875 28,872 3 28,875<br />
Effect of restatement<br />
Adjusted shareholders’ equity,<br />
11 – – – – – – – – –<br />
January 1 21,449 3 21,452 28,872 3 28,875 28,872 3 28,875<br />
Costs for stock options 8 10 – 10 7 – 7 44 – 44<br />
New share issues – – – 11 – 11 13 – 13<br />
Sale of own shares 8 4 – 4 22 – 22 46 – 46<br />
Repurchase of own shares – – – – – – –2 – –2<br />
Dividends<br />
Comprehensive income for<br />
8 – – – – – – –11,991 – –11,991<br />
the period<br />
SHAREHOlDERS’ EQuITy,<br />
805 – 805 1,073 – 1,073 4,467 – 4,467<br />
END OF PERIOD 22,268 3 22,271 29,985 3 29,988 21,449 3 21,452<br />
<strong>Tele2</strong> – <strong>Interim</strong> <strong>Report</strong> <strong>January–March</strong> <strong>2012</strong> 12 (30)
Balance sheet<br />
SEK million Note Mar 31, <strong>2012</strong> Mar 31, 2011 Dec 31, 2011 Dec 31, 2010<br />
ASSETS<br />
NON-CuRRENT ASSETS<br />
(see Note 11)<br />
Goodwill 9 10,504 10,043 10,510 10,154<br />
Other intangible assets 9, 6 5,108 3,304 5,131 3,223<br />
Intangible assets 15,612 13,347 15,641 13,377<br />
Tangible assets 18,684 17,434 18,422 17,442<br />
Financial assets 122 94 163 73<br />
Deferred tax assets 4 2,669 3,178 2,977 3,296<br />
NON-CuRRENT ASSETS 37,087 34,053 37,203 34,188<br />
CuRRENT ASSETS<br />
Materials and supplies 481 321 486 273<br />
Current receivables 8,422 6,796 8,084 6,642<br />
Shortterm investments 59 143 65 112<br />
Cash and cash equivalents 7 546 1,504 1,026 870<br />
CuRRENT ASSETS 9,508 8,764 9,661 7,897<br />
ASSETS 46,595 42,817 46,864 42,085<br />
EQuITy AND lIABIlITIES<br />
SHAREHOlDERS' EQuITy<br />
Attributable to equity holders of the parent company 22,268 29,985 21,449 28,872<br />
Noncontrolling interests 3 3 3 3<br />
SHAREHOlDERS' EQuITy 8 22,271 29,988 21,452 28,875<br />
lONG-TERM lIABIlITIES<br />
Interestbearing liabilities 10 7,822 1,277 12,968 1,908<br />
Noninterestbearing liabilities 1,148 927 1,114 851<br />
lONG-TERM lIABIlITIES 8,970 2,204 14,082 2,759<br />
SHORT-TERM lIABIlITIES<br />
Interestbearing liabilities 10 5,524 2,532 1,696 2,516<br />
Noninterestbearing liabilities 9,830 8,093 9,634 7,935<br />
SHORT-TERM lIABIlITIES 15,354 10,625 11,330 10,451<br />
EQuITy AND lIABIlITIES 46,595 42,817 46,864 42,085<br />
<strong>Tele2</strong> – <strong>Interim</strong> <strong>Report</strong> <strong>January–March</strong> <strong>2012</strong> 13 (30)
Cash flow statement<br />
SEK million Note<br />
OPERATING ACTIVITIES<br />
<strong>2012</strong><br />
Jan 1–Mar 31<br />
2011<br />
Jan 1–Mar 31<br />
2011<br />
Full year<br />
Cash flow from operations, excluding paid taxes 2,517 2,664 10,895 2,517 2,643 2,902 2,686 2,664 2,375<br />
Taxes paid –202 –225 –948 –202 –163 –235 –325 –225 –160<br />
Changes in working capital –419 –257 –257 –419 –52 59 –7 –257 –348<br />
CASH FlOW FROM OPERATING ACTIVITIES 1,896 2,182 9,690 1,896 2,428 2,726 2,354 2,182 1,867<br />
INVESTING ACTIVITIES<br />
Capital expenditure in intangible and<br />
tangible assets, CAPEX 6 –830 –1,016 –5,572 –830 –1,753 –1,142 –1,661 –1,016 –1,334<br />
Cash flow after CAPEX 1,066 1,166 4,118 1,066 675 1,584 693 1,166 533<br />
Acquisition of shares and participations 9 –224 – –1,589 –224 –1,553 1 –37 – –469<br />
Sale of shares and participations 9 – – 8 – –7 36 –21 – 146<br />
Other financial assets 26 3 18 26 – 14 1 3 –<br />
Cash flow from investing activities –1,028 –1,013 –7,135 –1,028 –3,313 –1,091 –1,718 –1,013 –1,657<br />
CASH FlOW AFTER INVESTING ACTIVITIES 868 1,169 2,555 868 –885 1,635 636 1,169 210<br />
FINANCING ACTIVITIES<br />
Change of loans, net –1,351 –667 9,351 –1,351 –925 –796 11,739 –667 –1,229<br />
Dividends 8 – – –11,991 – – – –11,991 – –<br />
New share issues – 11 13 – 2 – – 11 –<br />
Sale of own shares 8 4 22 46 4 4 – 20 22 141<br />
Repurchase of own shares<br />
Shareholders contribution from<br />
– – –2 – –2 – – – –<br />
noncontrolling interests – 106 105 – 1 – –2 106 100<br />
Cash flow from financing activities<br />
NET CHANGE IN CASH AND CASH<br />
–1,347 –528 –2,478 –1,347 –920 –796 –234 –528 –988<br />
EQuIVAlENTS –479 641 77 –479 –1,805 839 402 641 –778<br />
Cash and cash equivalents at<br />
beginning of period<br />
Exchange rate differences in cash<br />
1,026 870 870 1,026 2,812 1,978 1,504 870 1,564<br />
and cash equivalents<br />
CASH AND CASH EQuIVAlENTS<br />
–1 –7 79 –1 19 –5 72 –7 84<br />
AT END OF THE PERIOD 546 1,504 1,026 546 1,026 2,812 1,978 1,504 870<br />
For additional cash flow information please refer to Note 7.<br />
<strong>2012</strong><br />
Q1<br />
2011<br />
Q4<br />
2011<br />
Q3<br />
2011<br />
Q2<br />
2011<br />
Q1<br />
2010<br />
Q4<br />
<strong>Tele2</strong> – <strong>Interim</strong> <strong>Report</strong> <strong>January–March</strong> <strong>2012</strong> 14 (30)
Number of customers<br />
by thousands Note<br />
Number of customers Net intake<br />
<strong>2012</strong><br />
Mar 31<br />
2011<br />
Mar 31<br />
<strong>2012</strong><br />
Jan 1–<br />
Mar 31<br />
2011<br />
Jan 1–<br />
Mar 31<br />
2011<br />
Full year<br />
Sweden<br />
Mobile 3,703 3,615 –21 8 117 –21 –25 95 39 8 20<br />
Fixed broadband 479 490 5 4 –12 5 2 –11 –7 4 18<br />
Fixed telephony 510 623 –34 –28 –107 –34 –27 –26 –26 –28 –21<br />
Norway<br />
4,692 4,728 –50 –16 –2 –50 –50 58 6 –16 17<br />
Mobile 1,082 505 16 8 3 16 –12 –1 8 8 10<br />
Fixed telephony 89 100 –3 –3 –11 –3 –2 –3 –3 –3 –5<br />
Russia<br />
1,171 605 13 5 –8 13 –14 –4 5 5 5<br />
Mobile 1 20,940 18,985 304 547 2,198 304 250 681 720 547 755<br />
Estonia<br />
20,940 18,985 304 547 2,198 304 250 681 720 547 755<br />
Mobile 506 467 2 –1 22 2 1 1 21 –1 –4<br />
Fixed telephony 6 10 –2 –1 –3 –2 –1 –1 – –1 –<br />
lithuania<br />
512 477 – –2 19 – – – 21 –2 –4<br />
Mobile 1,730 1,667 9 –18 36 9 –2 22 34 –18 1<br />
Fixed telephony 2 2 – – – – – – – – –<br />
latvia<br />
1,732 1,669 9 –18 36 9 –2 22 34 –18 1<br />
Mobile 1,010 1,016 –9 –11 –8 –9 –31 14 20 –11 –25<br />
Croatia<br />
1,010 1,016 –9 –11 –8 –9 –31 14 20 –11 –25<br />
Mobile 1 722 755 12 17 –28 12 –117 45 27 17 1<br />
Kazakhstan<br />
722 755 12 17 –28 12 –117 45 27 17 1<br />
Mobile 1,703 308 332 –24 1,039 332 249 459 355 –24 114<br />
Netherlands<br />
1,703 308 332 –24 1,039 332 249 459 355 –24 114<br />
Mobile 340 334 13 –4 –11 13 2 –5 –4 –4 –13<br />
Fixed broadband 457 507 –18 –3 –35 –18 –12 –16 –4 –3 –3<br />
Fixed telephony 169 221 –13 –12 –51 –13 –11 –15 –13 –12 –17<br />
Germany<br />
966 1,062 –18 –19 –97 –18 –21 –36 –21 –19 –33<br />
Mobile 66 – 21 – 45 21 31 14 – – –<br />
Fixed broadband 93 112 –7 –4 –16 –7 –5 –5 –2 –4 –5<br />
Fixed telephony 808 1,126 –27 –56 –347 –27 –174 –16 –101 –56 –83<br />
Austria<br />
967 1,238 –13 –60 –318 –13 –148 –7 –103 –60 –88<br />
Fixed broadband 132 129 –2 –1 –7 –2 –2 –2 –2 –1 –<br />
Fixed telephony 212 266 –19 –19 –54 –19 –11 –14 –10 –19 –15<br />
TOTAl<br />
344 395 –21 –20 –61 –21 –13 –16 –12 –20 –15<br />
Mobile 31,802 27,652 679 522 3,413 679 346 1,325 1,220 522 859<br />
Fixed broadband 1,161 1,238 –22 –4 –70 –22 –17 –34 –15 –4 10<br />
Fixed telephony 1,796 2,348 –98 –119 –573 –98 –226 –75 –153 –119 –141<br />
TOTAl NET INTAKE 34,759 31,238 559 399 2,770 559 103 1,216 1,052 399 728<br />
Acquired companies 9 14 – 577 14 577 – – – 75<br />
Divested companies – –44 –44 – – – – –44 –<br />
TOTAl NuMBER OF CuSTOMERS 34,759 31,238 573 355 3,303 573 680 1,216 1,052 355 803<br />
<strong>2012</strong><br />
Q1<br />
2011<br />
Q4<br />
2011<br />
Q3<br />
2011<br />
Q2<br />
2011<br />
Q1<br />
2010<br />
Q4<br />
<strong>Tele2</strong> – <strong>Interim</strong> <strong>Report</strong> <strong>January–March</strong> <strong>2012</strong> 15 (30)
Net sales<br />
SEK million Note<br />
<strong>2012</strong><br />
Jan 1–Mar 31<br />
2011<br />
Jan 1–Mar 31<br />
2011<br />
Full year<br />
Sweden<br />
Mobile 2,378 2,287 9,533 2,378 2,442 2,434 2,370 2,287 2,300<br />
Fixed broadband 365 382 1,530 365 376 377 395 382 390<br />
Fixed telephony 304 379 1,408 304 323 342 364 379 423<br />
Other operations 27 22 110 27 17 33 38 22 30<br />
3,074 3,070 12,581 3,074 3,158 3,186 3,167 3,070 3,143<br />
Norway<br />
Mobile 1,060 597 2,981 1,060 1,128 639 617 597 666<br />
Fixed broadband 1 2 6 1 1 2 1 2 2<br />
Fixed telephony 83 92 365 83 90 91 92 92 94<br />
Other operations 1 – 9 1 9 – – – –<br />
1,145 691 3,361 1,145 1,228 732 710 691 762<br />
Russia<br />
Mobile 3,048 2,598 11,463 3,048 2,988 3,015 2,862 2,598 2,646<br />
3,048 2,598 11,463 3,048 2,988 3,015 2,862 2,598 2,646<br />
Estonia<br />
Mobile 196 188 834 196 219 220 207 188 217<br />
Fixed telephony 2 1 5 2 1 1 2 1 2<br />
Other operations 10 11 28 10 – 7 10 11 12<br />
208 200 867 208 220 228 219 200 231<br />
lithuania<br />
Mobile 291 283 1,261 291 337 336 305 283 322<br />
Fixed broadband – 2 2 – – – – 2 6<br />
291 285 1,263 291 337 336 305 285 328<br />
latvia<br />
Mobile 240 262 1,103 240 274 291 276 262 303<br />
240 262 1,103 240 274 291 276 262 303<br />
Croatia<br />
Mobile 267 277 1,301 267 319 382 323 277 335<br />
267 277 1,301 267 319 382 323 277 335<br />
Kazakhstan<br />
Mobile 165 29 346 165 161 115 41 29 37<br />
165 29 346 165 161 115 41 29 37<br />
Netherlands<br />
Mobile 185 215 844 185 215 201 213 215 210<br />
Fixed broadband 813 848 3,388 813 841 851 848 848 908<br />
Fixed telephony 180 220 823 180 192 197 214 220 239<br />
Other operations 172 194 771 172 207 181 189 194 213<br />
1,350 1,477 5,826 1,350 1,455 1,430 1,464 1,477 1,570<br />
Germany<br />
Mobile 36 – 26 36 21 5 – – –<br />
Fixed broadband 56 66 254 56 61 63 64 66 71<br />
Fixed telephony 162 213 802 162 190 198 201 213 255<br />
Other operations – 12 14 – – –1 3 12 20<br />
254 291 1,096 254 272 265 268 291 346<br />
Austria<br />
Fixed broadband 227 210 842 227 213 210 209 210 219<br />
Fixed telephony 63 78 294 63 70 72 74 78 83<br />
Other operations 64 56 241 64 60 64 61 56 66<br />
354 344 1,377 354 343 346 344 344 368<br />
Other<br />
Other operations 101 185 662 101 154 157 166 185 193<br />
101 185 662 101 154 157 166 185 193<br />
TOTAl<br />
Mobile 7,866 6,736 29,692 7,866 8,104 7,638 7,214 6,736 7,036<br />
Fixed broadband 1,462 1,510 6,022 1,462 1,492 1,503 1,517 1,510 1,596<br />
Fixed telephony 794 983 3,697 794 866 901 947 983 1,096<br />
Other operations 375 480 1,835 375 447 441 467 480 534<br />
10,497 9,709 41,246 10,497 10,909 10,483 10,145 9,709 10,262<br />
Internal sales, elimination –16 –67 –245 –16 –57 –54 –67 –67 –77<br />
10,481 9,642 41,001 10,481 10,852 10,429 10,078 9,642 10,185<br />
Oneoff items – – – – – – – – –6<br />
TOTAl 10,481 9,642 41,001 10,481 10,852 10,429 10,078 9,642 10,179<br />
<strong>2012</strong><br />
Q1<br />
2011<br />
Q4<br />
2011<br />
Q3<br />
2011<br />
Q2<br />
2011<br />
Q1<br />
2010<br />
Q4<br />
<strong>Tele2</strong> – <strong>Interim</strong> <strong>Report</strong> <strong>January–March</strong> <strong>2012</strong> 16 (30)
Internal sales<br />
SEK million<br />
Sweden<br />
<strong>2012</strong><br />
Jan 1–Mar 31<br />
2011<br />
Jan 1–Mar 31<br />
2011<br />
Full year<br />
Mobile 2 1 6 2 2 – 3 1 2<br />
Other operations 1 – – 1 – – – – 1<br />
Norway<br />
<strong>2012</strong><br />
Q1<br />
2011<br />
Q4<br />
2011<br />
Q3<br />
2011<br />
Q2<br />
2011<br />
Q1<br />
3 1 6 3 2 – 3 1 3<br />
Fixed telephony 10 9 42 10 12 11 10 9 6<br />
Estonia<br />
10 9 42 10 12 11 10 9 6<br />
Other operations – 11 28 – – 7 10 11 12<br />
lithuania<br />
– 11 28 – – 7 10 11 12<br />
Mobile 1 3 9 1 1 3 2 3 3<br />
latvia<br />
1 3 9 1 1 3 2 3 3<br />
Mobile 2 2 9 2 1 3 3 2 2<br />
Netherlands<br />
2 2 9 2 1 3 3 2 2<br />
Other operations – 1 3 – – – 2 1 –<br />
Other<br />
– 1 3 – – – 2 1 –<br />
Other operations – 40 148 – 41 30 37 40 51<br />
TOTAl<br />
– 40 148 – 41 30 37 40 51<br />
Mobile 5 6 24 5 4 6 8 6 7<br />
Fixed telephony 10 9 42 10 12 11 10 9 6<br />
Other operations 1 52 179 1 41 37 49 52 64<br />
TOTAl 16 67 245 16 57 54 67 67 77<br />
2010<br />
Q4<br />
<strong>Tele2</strong> – <strong>Interim</strong> <strong>Report</strong> <strong>January–March</strong> <strong>2012</strong> 17 (30)
EBITDA<br />
SEK million Note<br />
Sweden<br />
<strong>2012</strong><br />
Jan 1–Mar 31<br />
2011<br />
Jan 1–Mar 31<br />
2011<br />
Full year<br />
Mobile 2 656 744 3,160 656 798 799 819 744 741<br />
Fixed broadband 2 32 11 111 32 14 43 43 11 –2<br />
Fixed telephony 2 76 83 348 76 89 80 96 83 98<br />
Other operations 10 2 46 10 10 15 19 2 16<br />
Norway<br />
<strong>2012</strong><br />
Q1<br />
2011<br />
Q4<br />
2011<br />
Q3<br />
2011<br />
Q2<br />
2011<br />
Q1<br />
774 840 3,665 774 911 937 977 840 853<br />
Mobile 2 15 21 –47 15 –67 –20 19 21 34<br />
Fixed broadband – – 3 – 1 2 – – –<br />
Fixed telephony 10 18 67 10 15 16 18 18 14<br />
Other operations – – –3 – –3 – – – –<br />
Russia<br />
25 39 20 25 –54 –2 37 39 48<br />
Mobile 1,063 942 4,480 1,063 1,209 1,214 1,115 942 899<br />
Estonia<br />
1,063 942 4,480 1,063 1,209 1,214 1,115 942 899<br />
Mobile 54 51 234 54 58 68 57 51 50<br />
Other operations 3 – – 3 – – – – 1<br />
lithuania<br />
57 51 234 57 58 68 57 51 51<br />
Mobile 121 113 451 121 123 123 92 113 96<br />
Fixed broadband – – – – – – – – 1<br />
latvia<br />
121 113 451 121 123 123 92 113 97<br />
Mobile 88 85 380 88 94 98 103 85 88<br />
88 85 380 88 94 98 103 85 88<br />
Croatia<br />
Mobile 7 1 78 7 24 43 10 1 3<br />
Kazakhstan<br />
7 1 78 7 24 43 10 1 3<br />
Mobile –97 –71 –401 –97 –110 –101 –119 –71 –74<br />
Netherlands<br />
–97 –71 –401 –97 –110 –101 –119 –71 –74<br />
Mobile 2 – 21 115 – 21 37 36 21 57<br />
Fixed broadband 2 273 261 1,131 273 305 295 270 261 260<br />
Fixed telephony 2 58 61 229 58 57 55 56 61 48<br />
Other operations 2 78 73 331 78 118 78 62 73 68<br />
Germany<br />
409 416 1,806 409 501 465 424 416 433<br />
Mobile 12 – –10 12 9 –12 –7 – –<br />
Fixed broadband 8 13 45 8 13 12 7 13 –<br />
Fixed telephony 72 71 317 72 82 86 78 71 107<br />
Other operations –1 – – –1 – – – – –2<br />
Austria<br />
91 84 352 91 104 86 78 84 105<br />
Fixed broadband 48 47 185 48 54 43 41 47 44<br />
Fixed telephony 32 32 129 32 33 33 31 32 36<br />
Other operations 2 2 11 2 5 4 – 2 3<br />
Other<br />
82 81 325 82 92 80 72 81 83<br />
Other operations –49 –37 –178 –49 –79 –25 –37 –37 –20<br />
TOTAl<br />
–49 –37 –178 –49 –79 –25 –37 –37 –20<br />
Mobile 1,919 1,907 8,440 1,919 2,159 2,249 2,125 1,907 1,894<br />
Fixed broadband 361 332 1,475 361 387 395 361 332 303<br />
Fixed telephony 248 265 1,090 248 276 270 279 265 303<br />
Other operations 43 40 207 43 51 72 44 40 66<br />
TOTAl 2,571 2,544 11,212 2,571 2,873 2,986 2,809 2,544 2,566<br />
2010<br />
Q4<br />
<strong>Tele2</strong> – <strong>Interim</strong> <strong>Report</strong> <strong>January–March</strong> <strong>2012</strong> 18 (30)
EBIT<br />
SEK million Note<br />
<strong>2012</strong><br />
Jan 1–Mar 31<br />
2011<br />
Jan 1–Mar 31<br />
2011<br />
Full year<br />
Sweden<br />
Mobile 2 352 481 2,050 352 507 521 541 481 467<br />
Fixed broadband 2 –43 –62 –239 –43 –90 –36 –51 –62 –79<br />
Fixed telephony 2 66 72 301 66 78 67 84 72 86<br />
Other operations – –7 8 – 1 4 10 –7 7<br />
375 484 2,120 375 496 556 584 484 481<br />
Norway<br />
Mobile 2 –89 8 –147 –89 –127 –34 6 8 21<br />
Fixed broadband – – 3 – 1 2 – – –<br />
Fixed telephony 9 18 62 9 13 16 15 18 13<br />
Other operations – – –3 – –3 – – – –<br />
–80 26 –85 –80 –116 –16 21 26 34<br />
Russia<br />
Mobile 831 730 3,584 831 966 994 894 730 688<br />
831 730 3,584 831 966 994 894 730 688<br />
Estonia<br />
Mobile 2 23 36 166 23 40 49 41 36 32<br />
Other operations 2 – – 2 – – – – 1<br />
25 36 166 25 40 49 41 36 33<br />
lithuania<br />
Mobile 2 78 92 366 78 101 102 71 92 74<br />
78 92 366 78 101 102 71 92 74<br />
latvia<br />
Mobile 2 32 65 286 32 62 77 82 65 67<br />
32 65 286 32 62 77 82 65 67<br />
Croatia<br />
Mobile –23 –27 –42 –23 –7 12 –20 –27 –25<br />
–23 –27 –42 –23 –7 12 –20 –27 –25<br />
Kazakhstan<br />
Mobile 2 –177 –132 –720 –177 –239 –168 –181 –132 –114<br />
–177 –132 –720 –177 –239 –168 –181 –132 –114<br />
Netherlands<br />
Mobile 2 –11 18 97 –11 15 32 32 18 51<br />
Fixed broadband 2 149 133 630 149 180 170 147 133 101<br />
Fixed telephony 2 53 48 173 53 41 41 43 48 29<br />
Other operations 2 60 46 228 60 90 55 37 46 30<br />
251 245 1,128 251 326 298 259 245 211<br />
Germany<br />
Mobile 8 – –15 8 4 –12 –7 – –<br />
Fixed broadband 4 10 35 4 12 9 4 10 –4<br />
Fixed telephony 69 60 282 69 78 76 68 60 97<br />
Other operations –1 – – –1 – – – – –2<br />
80 70 302 80 94 73 65 70 91<br />
Austria<br />
Fixed broadband 23 26 106 23 35 25 20 26 19<br />
Fixed telephony 23 22 93 23 25 23 23 22 27<br />
Other operations –3 –5 –14 –3 –1 –2 –6 –5 –4<br />
43 43 185 43 59 46 37 43 42<br />
Other<br />
Other operations –53 –58 –236 –53 –93 –26 –59 –58 –54<br />
–53 –58 –236 –53 –93 –26 –59 –58 –54<br />
TOTAl<br />
Mobile 1,024 1,271 5,625 1,024 1,322 1,573 1,459 1,271 1,261<br />
Fixed broadband 133 107 535 133 138 170 120 107 37<br />
Fixed telephony 220 220 911 220 235 223 233 220 252<br />
Other operations 5 –24 –17 5 –6 31 –18 –24 –22<br />
1,382 1,574 7,054 1,382 1,689 1,997 1,794 1,574 1,528<br />
Oneoff items 1 99 –4 1 –26 –20 –57 99 –253<br />
TOTAl 1,383 1,673 7,050 1,383 1,663 1,977 1,737 1,673 1,275<br />
<strong>2012</strong><br />
Q1<br />
2011<br />
Q4<br />
2011<br />
Q3<br />
2011<br />
Q2<br />
2011<br />
Q1<br />
2010<br />
Q4<br />
<strong>Tele2</strong> – <strong>Interim</strong> <strong>Report</strong> <strong>January–March</strong> <strong>2012</strong> 19 (30)
EBIT, cont.<br />
SEK million Note<br />
<strong>2012</strong><br />
Jan 1–Mar 31<br />
2011<br />
Jan 1–Mar 31<br />
SPECIFICATION OF ITEMS BETWEEN EBITDA AND EBIT<br />
2011<br />
Full year<br />
EBITDA 2,571 2,544 11,212 2,571 2,873 2,986 2,809 2,544 2,566<br />
Sale of operations 1 –38 –43 1 –1 –2 –2 –38 –<br />
Acquisition costs 9 – –2 –46 – –25 –18 –1 –2 –<br />
Sale of joint ventures – – – – – – – – –247<br />
Other oneoff items 2, 3 – 139 85 – – – –54 139 –6<br />
Total one-off items 1 99 –4 1 –26 –20 –57 99 –253<br />
Depreciation/amortization and<br />
other impairment<br />
Result from shares in<br />
–1,188 –970 –4,159 –1,188 –1,184 –989 –1,016 –970 –1,037<br />
associated companies –1 – 1 –1 – – 1 – –1<br />
EBIT 1,383 1,673 7,050 1,383 1,663 1,977 1,737 1,673 1,275<br />
<strong>2012</strong><br />
Q1<br />
2011<br />
Q4<br />
2011<br />
Q3<br />
2011<br />
Q2<br />
2011<br />
Q1<br />
2010<br />
Q4<br />
<strong>Tele2</strong> – <strong>Interim</strong> <strong>Report</strong> <strong>January–March</strong> <strong>2012</strong> 20 (30)
CAPEX<br />
SEK million Note<br />
Sweden<br />
<strong>2012</strong><br />
Jan 1–Mar 31<br />
2011<br />
Jan 1–Mar 31<br />
2011<br />
Full year<br />
Mobile 223 398 1,096 223 404 116 178 398 175<br />
Fixed broadband 29 68 245 29 67 43 67 68 76<br />
Fixed telephony 2 – 2 2 – 2 – – 1<br />
Other operations 6 12 24 6 7 6 –1 12 6<br />
<strong>2012</strong><br />
Q1<br />
2011<br />
Q4<br />
2011<br />
Q3<br />
2011<br />
Q2<br />
2011<br />
Q1<br />
260 478 1,367 260 478 167 244 478 258<br />
Norway<br />
Mobile 99 35 282 99 139 41 67 35 107<br />
Fixed telephony 2 2 6 2 2 1 1 2 1<br />
Russia<br />
101 37 288 101 141 42 68 37 108<br />
Mobile 281 262 2,010 281 575 662 511 262 632<br />
Estonia<br />
281 262 2,010 281 575 662 511 262 632<br />
Mobile 13 27 83 13 17 21 18 27 15<br />
lithuania<br />
13 27 83 13 17 21 18 27 15<br />
Mobile 16 20 114 16 39 31 24 20 32<br />
Fixed broadband – – – – – – – – 1<br />
latvia<br />
16 20 114 16 39 31 24 20 33<br />
Mobile 18 30 91 18 20 20 21 30 35<br />
Croatia<br />
18 30 91 18 20 20 21 30 35<br />
Mobile 5 31 102 5 19 24 28 31 64<br />
Kazakhstan<br />
5 31 102 5 19 24 28 31 64<br />
Mobile 6 120 125 902 120 262 52 463 125 168<br />
Netherlands<br />
120 125 902 120 262 52 463 125 168<br />
Mobile 2 2 9 2 4 2 1 2 3<br />
Fixed broadband 82 89 360 82 92 90 89 89 94<br />
Fixed telephony 2 10 41 2 13 9 9 10 14<br />
Other operations 6 13 44 6 11 9 11 13 10<br />
Germany<br />
92 114 454 92 120 110 110 114 121<br />
Mobile 9 – 38 9 9 20 9 – –<br />
Fixed broadband – – 1 – – – 1 – 2<br />
Fixed telephony 1 – – 1 – – – – 1<br />
Austria<br />
10 – 39 10 9 20 10 – 3<br />
Fixed broadband 7 6 37 7 18 8 5 6 12<br />
Fixed telephony 3 5 21 3 8 5 3 5 7<br />
Other operations 2 2 13 2 6 3 2 2 4<br />
Other<br />
12 13 71 12 32 16 10 13 23<br />
Other operations 115 176 584 115 138 126 144 176 120<br />
TOTAl<br />
115 176 584 115 138 126 144 176 120<br />
Mobile 786 930 4,727 786 1,488 989 1,320 930 1,231<br />
Fixed broadband 118 163 643 118 177 141 162 163 185<br />
Fixed telephony 10 17 70 10 23 17 13 17 24<br />
Other operations 129 203 665 129 162 144 156 203 140<br />
TOTAl 1,043 1,313 6,105 1,043 1,850 1,291 1,651 1,313 1,580<br />
2010<br />
Q4<br />
<strong>Tele2</strong> – <strong>Interim</strong> <strong>Report</strong> <strong>January–March</strong> <strong>2012</strong> 21 (30)
CAPEX, cont.<br />
SEK million<br />
<strong>2012</strong><br />
Jan 1–Mar 31<br />
2011<br />
Jan 1–Mar 31<br />
2011<br />
Full year<br />
ADDITIONAL CASH FLOW INFORMATION<br />
CAPEX according to cash flow statement 830 1,016 5,572 830 1,753 1,142 1,661 1,016 1,334<br />
This year’s unpaid CAPEX and<br />
paid CAPEX from previous year 193 292 294 193 98 74 –170 292 257<br />
Sales price in cash flow statement 20 5 239 20 –1 75 160 5 –11<br />
CAPEX according to balance sheet 1,043 1,313 6,105 1,043 1,850 1,291 1,651 1,313 1,580<br />
<strong>2012</strong><br />
Q1<br />
2011<br />
Q4<br />
2011<br />
Q3<br />
2011<br />
Q2<br />
2011<br />
Q1<br />
2010<br />
Q4<br />
<strong>Tele2</strong> – <strong>Interim</strong> <strong>Report</strong> <strong>January–March</strong> <strong>2012</strong> 22 (30)
Key ratios<br />
SEK million<br />
CONTINuING OPERATIONS<br />
<strong>2012</strong><br />
Jan 1–Mar 31<br />
2011<br />
Jan 1–Mar 31<br />
2011 2010 2009 2008<br />
Net sales 10,481 9,642 41,001 40,585 39,836 38,630<br />
Number of customers (by thousands) 34,759 31,238 34,186 30,883 26,579 24,018<br />
EBITDA 2,571 2,544 11,212 10,643 9,621 8,452<br />
EBIT 1,383 1,673 7,050 7,022 5,781 3,026<br />
EBT 1,205 1,599 6,376 6,639 5,236 1,893<br />
Net profit 869 1,226 4,904 6,481 4,755 1,758<br />
Key ratios<br />
EBITDA margin, % 24.5 26.4 27.3 26.6 24.2 21.8<br />
EBIT margin, % 13.2 17.4 17.2 17.3 14.5 7.8<br />
Value per share (SEK)<br />
Earnings 1.96 2.76 11.05 14.69 10.72 3.91<br />
Earnings after dilution 1.95 2.75 11.00 14.63 10.70 3.91<br />
TOTAl<br />
Shareholders’ equity 22,271 29,988 21,452 28,875 28,823 28,405<br />
Shareholders’ equity after dilution 22,272 29,996 21,455 28,894 28,823 28,415<br />
Total assets 46,595 42,817 46,864 42,085 43,005 49,697<br />
Cash flow from operating activities 1,896 2,182 9,690 9,966 9,427 8,088<br />
Cash flow after CAPEX 1,066 1,166 4,118 6,008 4,635 3,037<br />
Available liquidity 15,656 16,847 9,986 13,254 12,520 17,248<br />
Net debt 12,714 2,152 13,518 3,417 4,013 7,012<br />
Investments in intangible and tangible assets, CAPEX 1,043 1,313 6,105 4,095 4,891 5,066<br />
Investments in shares, shortterm investments etc 198 –3 1,563 1,424 –3,709 –2,342<br />
Key ratios<br />
Equity/assets ratio, % 48 70 46 69 67 57<br />
Debt/equity ratio, multiple 0.57 0.07 0.63 0.12 0.14 0.25<br />
Return on shareholders’ equity, % 15.9 16.5 19.5 24.0 16.4 8.9<br />
Return on shareholders’ equity after dilution, % 15.9 16.5 19.5 24.0 16.4 8.9<br />
Return on capital employed, % 15.5 20.0 20.4 22.2 16.7 12.8<br />
Average interest rate, % 5.7 5.9 6.2 7.3 5.9 6.2<br />
Value per share (SEK)<br />
Earnings 1.96 2.73 11.03 15.70 10.61 5.53<br />
Earnings after dilution 1.95 2.72 10.98 15.64 10.59 5.53<br />
Shareholders’ equity 50.13 67.62 48.33 65.44 65.31 63.93<br />
Shareholders’ equity after dilution 49.87 67.36 48.09 65.23 65.18 63.90<br />
Cash flow from operating activities 4.27 4.92 21.83 22.59 21.41 18.23<br />
Dividend, ordinary 6.501) 6.00 3.85 3.50<br />
Extraordinary dividend 6.501) 21.00 2.00 1.50<br />
Market price at closing day 135.00 145.80 133.90 139.60 110.20 69.00<br />
1) Proposed dividend<br />
<strong>Tele2</strong> – <strong>Interim</strong> <strong>Report</strong> <strong>January–March</strong> <strong>2012</strong> 23 (30)
Parent company<br />
INCOME STATEMENT<br />
SEK million<br />
<strong>2012</strong><br />
Jan 1–Mar 31<br />
2011<br />
Jan 1–Mar 31<br />
Net sales 11 12<br />
Administrative expenses –25 –30<br />
Operating loss, EBIT –14 –18<br />
Exchange rate difference on financial items 25 3<br />
Net interest expenses and other financial items 15 12<br />
Profit/loss after financial items, EBT 26 –3<br />
Tax on profit/loss –7 –<br />
NET PROFIT/lOSS 19 –3<br />
BAlANCE SHEET<br />
SEK million Note Mar 31, <strong>2012</strong> Dec 31, 2011<br />
ASSETS<br />
FIXED ASSETS<br />
Financial assets 35,485 33,908<br />
FIXED ASSETS 35,485 33,908<br />
CuRRENT ASSETS<br />
Current receivables 25 4,512<br />
Cash and cash equivalents 7 3<br />
CuRRENT ASSETS 32 4,515<br />
ASSETS 35,517 38,423<br />
EQuITy AND lIABIlITIES<br />
SHAREHOlDERS' EQuITy<br />
Restricted equity 8 17,546 17,546<br />
Unrestricted equity 8 12,485 12,428<br />
SHAREHOlDERS' EQuITy 30,031 29,974<br />
lONG-TERM lIABIlITIES<br />
Interestbearing liabilities 10 1,525 8,221<br />
lONG-TERM lIABIlITIES 1,525 8,221<br />
SHORT-TERM lIABIlITIES<br />
Interestbearing liabilities 10 3,904 172<br />
Noninterestbearing liabilities 57 56<br />
SHORT-TERM lIABIlITIES 3,961 228<br />
EQuITy AND lIABIlITIES 35,517 38,423<br />
<strong>Tele2</strong> – <strong>Interim</strong> <strong>Report</strong> <strong>January–March</strong> <strong>2012</strong> 24 (30)
Notes<br />
ACCOuNTING PRINCIPlES AND DEFINITIONS<br />
The interim report for the group was prepared in accordance with IAS<br />
34 and the Swedish Annual Accounts Act, and the interim report for the<br />
parent company was prepared in accordance with the Swedish Annual<br />
Accounts Act and the Swedish Financial <strong>Report</strong>ing Board recommendation<br />
RFR 2 <strong>Report</strong>ing for legal entities and its statements.<br />
New and amended IFRS standards and IFRIC interpretations<br />
The amended IFRS standards and IFRIC interpretations, which became<br />
effective January 1, <strong>2012</strong>, have had no material effect on the consolidated<br />
financial statements.<br />
At January 1, <strong>2012</strong> <strong>Tele2</strong> changed the accounting principles for joint<br />
ventures from the equity method to proportionate consolidation, with<br />
retrospective application. The effects on the financial statements are<br />
stated in Note 11.<br />
From January 1, <strong>2012</strong> internal sales within segments (countries) are<br />
not reported in net sales and internal sales for respective segment. The<br />
comparable periods are restated. The effects on the financial statements<br />
are stated in Note 12.<br />
In all other respects, <strong>Tele2</strong> has presented its interim report in accordance<br />
with the accounting principles and calculation methods used in<br />
the 2011 Annual <strong>Report</strong>. Description of these principles and definitions<br />
are found in the 2011 Annual <strong>Report</strong>.<br />
NOTE 1 CUSTOMERS<br />
In Q4 2011, number of customers in Russia and Croatia decreased by<br />
96,000 and 60,000 customers respectively, as a onetime adjustment,<br />
due to changes in IT systems.<br />
NOTE 2 OPERATING EXPENSES<br />
During <strong>2012</strong> and 2013, the Baltic countries will upgrade/replace their<br />
existing networks. As a result of the upgrade/replacement, to reflect the<br />
shorter remaining useful life of related equipment, accelerated depreciations<br />
are reported from Q1 <strong>2012</strong> of SEK 13 (Estonia), 22 (Lithuania)<br />
and 34 (Latvia) million.<br />
In Q4 2011, Kazakhstan was negatively affected by SEK 59 million<br />
due to impairment loss of obsolete equipment.<br />
In Q3 and Q4 2011, the mobile operation in Norway was negatively<br />
affected by SEK 7 and 53 million respectively, due to restructuring<br />
costs in connection with the acquisition of Network Norway.<br />
In Q3 2011, Sweden was negatively affected by SEK 45 million due<br />
to restructuring costs, of which SEK 34 million related to mobile, SEK 6<br />
million to fixed broadband and SEK 5 million to fixed telephony.<br />
In Q2 2011, Sweden was negatively affected by SEK 54 million in<br />
relation to future rental costs for mobile sites to be dismantled. The<br />
negative effect has been reported as a oneoff item.<br />
In Q2 2011, Netherlands was negatively affected by SEK 48 million<br />
due to restructuring costs related to the acquisition of BBned in 2010.<br />
NOTE 3 OTHER OPERATING INCOME<br />
In Q1 2011, other operating income in Sweden increased by SEK 139<br />
million relating to compensations in connection with the transferring<br />
and disposal of assets related to the 4G net cooperation. The positive<br />
effect has been reported as a oneoff item.<br />
NOTE 4 TAXES<br />
In Q4 2011, net taxes were positively affected by SEK 108 million as a<br />
result of a valuation of deferred tax assets related to BBned in Netherlands.<br />
In Q1 2011, net taxes were positively affected by a revaluation of the<br />
deferred tax assets in Netherlands of SEK 62 million, and negatively<br />
affected by SEK 35 million as a result of a reassessment of the deferred<br />
tax liability in Estonia.<br />
NOTE 5 CONTINGENT LIABILITIES<br />
SEK million Mar 31, <strong>2012</strong> Dec 31, 2011<br />
Disputes 380 263<br />
Total contingent liabilities 380 263<br />
Network Norway is the defendant in a dispute before the District Court<br />
of Asker and Bærum regarding alleged exclusivity undertakings in its<br />
national roaming agreement with Telenor Mobil, where Telenor Mobil<br />
claims that Network Norway is in breach of this alleged undertaking<br />
since <strong>Tele2</strong> Norway has a national roaming agreement with TeliaSonera<br />
Norge. Network Norway has disputed Telenor Mobil’s claim in its<br />
entirety and based on current information, our assessment is that it is<br />
more likely than not that Network Norway will win. At March 31, <strong>2012</strong><br />
the disputed amount was SEK 128 million. No dates have yet been set<br />
and we estimate that the District Court will give its ruling in H1 2013.<br />
<strong>Tele2</strong> is the defendant in an arbitration regarding a dispute relating<br />
to a Share Option Agreement and related issues where the claimant has<br />
put forward claims of SEK 252 million. We estimate that the arbitration<br />
award will be announced during the Q2 <strong>2012</strong>. Based on current<br />
information, our assessment is that it is more likely than not that we<br />
will win.<br />
Additional contractual commitments and liabilities related to joint<br />
ventures are stated in Note 30 in the Annual <strong>Report</strong> for 2011.<br />
NOTE 6 CAPEX<br />
In Q2, 2011, Kazakhstan acquired additional frequencies in the 2100<br />
MHz band which affected CAPEX and the cash flow statement by SEK<br />
218 million.<br />
NOTE 7 TRANSACTIONS WITH RELATED PARTIES<br />
<strong>Tele2</strong>’s share of liquid funds in joint ventures, for which <strong>Tele2</strong> has<br />
limited disposal rights, amounted at each closing date to the amounts<br />
stated below and was included in the group’s cash and cash equivalents.<br />
SEK million<br />
<strong>2012</strong><br />
Mar 31<br />
2011<br />
Dec 31<br />
2011<br />
Sep 30<br />
2011<br />
Jun 30<br />
2011<br />
Mar 31<br />
2010<br />
Dec 31<br />
Cash and cash equivalents<br />
at end of the<br />
period in joint ventures 31 50 26 58 61 36<br />
Apart from transactions with joint ventures, no other significant related<br />
party transactions were carried out during <strong>2012</strong>. Related parties are<br />
presented in Note 38 of the 2011 Annual <strong>Report</strong>.<br />
<strong>Tele2</strong> – <strong>Interim</strong> <strong>Report</strong> <strong>January–March</strong> <strong>2012</strong> 25 (30)
NOTE 8 SHARES AND INCENTIVE PROGRAMS (LTI)<br />
Mar 31, <strong>2012</strong> Dec 31, 2011<br />
Number of shares<br />
–outstanding, basic 444,186,959 444,149,959<br />
–in own custody 4,596,380 4,633,380<br />
–weighted average 444,170,103 443,851,976<br />
–after dilution 446,472,049 446,492,847<br />
–after dilution, weighted average 446,492,929 446,136,419<br />
DIVIDEND<br />
<strong>Tele2</strong>’s Board of Directors intends to propose an increase of the ordinary<br />
dividend with 8 percent to SEK 6.50 per share in respect of the<br />
financial year 2011 at the Annual General Meeting in <strong>2012</strong> and an<br />
extraordinary dividend of SEK 6.50 per share.<br />
In Q2 2011, <strong>Tele2</strong> paid to its shareholders a dividend of SEK 27 (5.85)<br />
per share for 2010, of which the ordinary dividend amounted to SEK<br />
6.00 (3.85) per share and the extraordinary dividend amounted to<br />
SEK 21.00 (2.00) per share. This corresponded to a total of SEK 11,991<br />
(2,580) million, of which an ordinary dividend of SEK 2,665 (1,698)<br />
million and an extraordinary dividend SEK 9,326 (882) million.<br />
SAlE OF SHARES<br />
As a result of stock options in the LTI 2007 being exercised during Q1<br />
<strong>2012</strong>, <strong>Tele2</strong> sold Bshares in own custody of 37,000, resulting in an<br />
increase of shareholders’ equity of SEK 4 million.<br />
REClASSIFICATION<br />
In Q1 <strong>2012</strong>, 1,194 class A shares were reclassified into class B shares<br />
in <strong>Tele2</strong>.<br />
INCENTIVE PROGRAM (lTI)<br />
Additional information related to LTI programs are presented in Note 34<br />
of the 2011 Annual <strong>Report</strong>.<br />
lTI 2011<br />
Number of share rights<br />
<strong>2012</strong><br />
Jan 1–Mar 31<br />
Cumulative<br />
from start<br />
Allocated June 17, 2011 1,053,936<br />
Outstanding as of January 1, <strong>2012</strong> 992,936<br />
Forfeited –17,976 –78,976<br />
Total outstanding share rights 974,960 974,960<br />
lTI 2010<br />
Number of share rights<br />
<strong>2012</strong><br />
Jan 1–Mar 31<br />
Cumulative<br />
from start<br />
Allocated June 9, 2010 873,120<br />
Outstanding as of January 1, <strong>2012</strong> 858,057<br />
Allocated, compensation for dividend – 123,089<br />
Forfeited –17,100 –155,252<br />
Total outstanding share rights 840,957 840,957<br />
lTI 2009<br />
Number of share rights<br />
<strong>2012</strong><br />
Jan 1–Mar 31<br />
Cumulative<br />
from start<br />
Allocated June 1, 2009 656,160<br />
Outstanding as of January 1, <strong>2012</strong> 484,196<br />
Allocated, compensation for dividend – 92,096<br />
Forfeited –17,944 –282,004<br />
Total outstanding share rights 466,252 466,252<br />
The exercise of the share rights in LTI 2009 was conditional upon the<br />
fulfilment of certain retention and performance based conditions,<br />
measured from April 1, 2009 until March 31, <strong>2012</strong>. The outcome of<br />
these decided performance conditions was in accordance with below:<br />
Retention and performance based conditions<br />
Minimum<br />
hurdle<br />
(20%)<br />
Stretch<br />
target<br />
(100%)<br />
Performance<br />
outcome<br />
Allot<br />
ment<br />
Series A Total Shareholder Return <strong>Tele2</strong> (TSR) ≥ 0% 156.2% 100%<br />
Series B Average normalised Return on Capital<br />
Employed (ROCE) 14% 17% 22.0% 100%<br />
Series C Total Shareholder Return <strong>Tele2</strong> (TSR)<br />
compared to a peer group > 0% ≥ 10% 65.2% 100%<br />
lTI 2007<br />
Number of options<br />
<strong>2012</strong><br />
Jan 1–Mar 31<br />
Cumulative<br />
from start<br />
Allocated August 28, 2007 3,552,000<br />
Outstanding as of January 1, <strong>2012</strong> 59,000<br />
Forfeited – –1,023,000<br />
Exercised –37,000 –2,507,000<br />
Total outstanding stock options 22,000 22,000<br />
Weighted average share price for stock options at date of exercise<br />
amounted to SEK 132.25 (149.19) during <strong>2012</strong>.<br />
Stock options in LTI 2007 can be exercised until August <strong>2012</strong>. The<br />
exercise price is SEK 116.60.<br />
SEK 1 million was paid to the programme participants in connection<br />
with the exercise during <strong>2012</strong>, as a compensation for the extraordinary<br />
dividend of SEK 21.00 paid during 2011.<br />
NOTE 9 BUSINESS ACQUISITIONS AND DIVESTMENTS<br />
Acquisitions and divestments of shares and participations affecting<br />
cash flow were as follows:<br />
<strong>2012</strong><br />
SEK million<br />
Jan 1–Mar 31<br />
Acquisitions<br />
Televõrgu, Estonia –222<br />
Group companies –222<br />
Capital contribution to associated companies –2<br />
Associated companies and other securities –2<br />
Total net of acquisitions and dividend –224<br />
Divestments<br />
Officer, Norway 1<br />
Settlements of previous years’ divestments –1<br />
Total divestments –<br />
TOTAl CASH FlOW EFFECT, NET –224<br />
ACQuISITIONS<br />
Televõrgu, Estonia<br />
On February 17, <strong>2012</strong> <strong>Tele2</strong> acquired 100 percent of the Estonian telecommunication<br />
service provider Televõrgu AS for SEK 222 million.<br />
Televõrgu is a provider of transmission and mobile internet services<br />
based on a fibre optical network and a CDMA based 3G wireless network.<br />
The acquisition of Televõrgu will give <strong>Tele2</strong> Estonia a stronger<br />
presence among business customers in the Estonian market, and full<br />
control over its transmission network until 2025.<br />
Goodwill in connection with the acquisition is related to <strong>Tele2</strong>’s<br />
expectation to benefit from cost savings and cost control, since Televõrgu<br />
is a provider of leased lines and transmission services to <strong>Tele2</strong>.<br />
In addition, the acquisition expects to give <strong>Tele2</strong> a stronger presence<br />
among business customers and expand data transmission services in<br />
the Estonian market.<br />
Televõrgu has affected net sales of SEK 13 million and EBITDA of SEK<br />
4 million. Total acquisition costs of SEK 1 million have been reported in<br />
the income statement.<br />
<strong>Tele2</strong> – <strong>Interim</strong> <strong>Report</strong> <strong>January–March</strong> <strong>2012</strong> 26 (30)
CONT. NOTE 9<br />
Net assets at the time of acquisition<br />
Fair value of assets, liabilities and contingent liabilities included in the<br />
operations acquired before March 31, <strong>2012</strong>, are stated below:<br />
SEK million Televõrgu, Estonia<br />
Customer agreements 20<br />
Beneficial and renting rights 78<br />
Tangible assets 63<br />
Material and supplies 1<br />
Current receivables 18<br />
Cash and cash equivalents 3<br />
Deferred tax liabilities –17<br />
Shortterm liabilities –35<br />
Acquired net assets 131<br />
Goodwill 65<br />
Purchase price shares 196<br />
Payment for debt in acquired companies 26<br />
Purchase price adjustment, not yet received 1<br />
223<br />
Exchange rate differences 2<br />
Less: cash in acqired companies –3<br />
NET EFFECT ON GROuP CASH ASSETS 222<br />
The information above and the pro forma below are to be viewed as<br />
preliminary.<br />
DIVESTMENTS<br />
Officer, Norway<br />
In Q1 <strong>2012</strong>, stores in Officer, Norway, were divested for SEK 1 million.<br />
Other divestments<br />
Other cash flow changes include settlements of price adjustments in<br />
the amount of SEK –1 million for divestments which have not been<br />
classified as discontinued operations.<br />
PRO FORMA<br />
The table below shows how the acquired companies and operations on<br />
March 31, <strong>2012</strong> would have affected <strong>Tele2</strong>’s net sales and result if they<br />
had been acquired on January 1, <strong>2012</strong>.<br />
SEK million<br />
<strong>Tele2</strong><br />
group 1)<br />
Jan 1–Mar 31 <strong>2012</strong><br />
Acquired<br />
operations <strong>Tele2</strong><br />
Televõrgu,<br />
Estonia<br />
group,<br />
pro forma<br />
Net sales 10,481 19 10,500<br />
EBITDA 2,571 8 2,579<br />
Net profit<br />
1) Continuing operation<br />
869 –20 849<br />
DISCONTINuED OPERATIONS<br />
Discontinued operations include settlements of sales costs and price<br />
adjustments for discontinued operations sold during the past years.<br />
SEK million<br />
<strong>2012</strong><br />
Q1<br />
2011<br />
Full<br />
year<br />
Discontinued operation<br />
2011<br />
Q4<br />
2011<br />
Q3<br />
2011<br />
Q2<br />
2011<br />
Q1<br />
2010<br />
Q4<br />
Income statement<br />
Net sales – – – – – – –<br />
Profit/loss before tax – –7 – 1 5 –13 410<br />
Taxes – – – – – – –6<br />
Net profit/loss – –7 – 1 5 –13 404<br />
Cash flow statement<br />
Operating activities – – – – – – –<br />
Investing activities – 3 – 39 –16 –20 418<br />
Change in cash and<br />
cash equivalents – 3 – 39 –16 –20 418<br />
NOTE 10 FINANCING<br />
<strong>Tele2</strong> announced on April 16, <strong>2012</strong> that <strong>Tele2</strong> AB established a Euro<br />
MediumTerm Note Programme (bonds) registered on the Luxembourg<br />
Stock Exchange for Notes. The programme will form the basis<br />
for <strong>Tele2</strong>’s future medium and long term debt issuance in both international<br />
and domestic markets. The programme enables <strong>Tele2</strong> to issue<br />
bonds and notes up to a total aggregate amount of EUR 3 billion.<br />
In Q1, <strong>2012</strong>, <strong>Tele2</strong> AB carried out a first issue under a recently established<br />
Swedish commercial paper program. The program enables<br />
<strong>Tele2</strong> to issue commercial papers up to a total amount of SEK 3 billion.<br />
Commercial papers can be issued with tenors up to 12 months under<br />
the program. The commercial paper program is a complement to <strong>Tele2</strong>’s<br />
core funding. The reported value of the commercial paper amounted at<br />
March 31, <strong>2012</strong> to SEK 1.9 billion.<br />
In Q1, <strong>2012</strong>, <strong>Tele2</strong> AB issued a NOK 1.3 billion bond in the Norwegian<br />
bond market. The amount is split between a 3 year bond of NOK<br />
300 million priced at NIBOR +1.70 percent and a 5 year bond of NOK 1<br />
billion priced at NIBOR +2.35 percent. The reported value of the bond<br />
amounted at March 31, <strong>2012</strong> to SEK 1.5 billion.<br />
In Q1, <strong>2012</strong> (Q2, 2011), <strong>Tele2</strong> Russia issued a 7 (13) billion rouble bond<br />
with 2 (3) tranches. The bond has a final maturity of 10 (10) years and a<br />
put option providing for an effective tenor of 2 (5) years. The coupon rate<br />
for the period is 8.90 (8.40) percent per annum with semiannual coupon<br />
payments. The reported value of the bonds amounted at March 31,<br />
<strong>2012</strong> (June 30, 2011) to SEK 4.5 (2.9) billion. <strong>Tele2</strong> announced on April<br />
16, <strong>2012</strong> that <strong>Tele2</strong> Russia issued a 6 billion rouble bond (1 tranche).<br />
The bond has a final maturity of 10 years and a put option providing for<br />
an effective tenor of 3 years. The coupon rate is 9.10 percent per annum<br />
with semiannual coupon payments.<br />
<strong>Tele2</strong> – <strong>Interim</strong> <strong>Report</strong> <strong>January–March</strong> <strong>2012</strong> 27 (30)
NOTE 11 CHANGED ACCOUNTING PRINCIPLE FOR<br />
JOINT VENTURES<br />
On January 1, <strong>2012</strong> <strong>Tele2</strong> changed the accounting principles for joint<br />
ventures from the equity method to proportionate consolidation, with<br />
retrospective application.<br />
The International Accounting Standards Board (IASB) has issued a<br />
new standard for joint arrangements, IFRS 11 (not yet adopted by the<br />
EU). IFRS 11 is focusing on the rights and obligations that exist between<br />
the parties. This is determinative when deciding which type of joint<br />
arrangement exists. A joint arrangement is a construction where two<br />
or more parties contractually agree on joint control. Joint control is<br />
the contractually agreed sharing of control of an arrangement, which<br />
exists only when decisions about the relevant activities require unanimous<br />
consent of the parties sharing control. It is not only the legal form<br />
of the arrangement that should be considered. There are two types of<br />
joint arrangements: joint operations and joint ventures. A joint operation<br />
arises when the joint control owners have rights to the assets and<br />
obligations for the liabilities that are connected to the investment. A<br />
joint venture applies to the case where the joint control parties have<br />
rights to the net assets of the investment. Depending on whether the<br />
arrangement is a joint operation or a joint venture, different accounting<br />
principles shall be applied. According to the new standard, only<br />
the equity method is allowed when consolidating joint ventures, i.e.<br />
proportionate consolidation is no longer allowed. The parties in a joint<br />
operation shall report their assets, liabilities, revenues and expenses<br />
and their share of joint assets, liabilities, revenues and expenses.<br />
<strong>Tele2</strong> reviewed in 2011 its joint ventures, and the major part of these<br />
was classified as joint operations according to IFRS 11. As a consequence,<br />
<strong>Tele2</strong> changed accounting principle already from January 1,<br />
<strong>2012</strong>, within the current IAS 31 Interests in Joint Ventures, from the<br />
equity method to proportionate consolidation for joint ventures. The<br />
decision was additionally based on the fact that <strong>Tele2</strong> Sweden is<br />
building its 3G and 4G networks in joint ventures and that proportionate<br />
consolidation was expected to give a more true and fair view. The<br />
change of accounting principle increased the net sales, EBITDA, assets<br />
and liabilities of the group and had a minor effect on operating profit<br />
and net cash flows. The change had no effect on net profit or shareholders’<br />
equity.<br />
The effects from the change of accounting principle are stated below.<br />
Income statement<br />
2011 2010 2011 2011 2011 2011 2010<br />
SEK million<br />
CONTINuING OPERATIONS<br />
Full year Full year Q4 Q3 Q2 Q1 Q4<br />
Net sales 251 421 13 89 80 69 70<br />
Operating expenses<br />
Result from shares<br />
in associated companies<br />
–215 –373 –22 –67 –65 –61 –59<br />
and joint ventures –16 –145 2 – –8 –10 –99<br />
Other operating income 62 31 30 5 11 16 7<br />
Operating profit/loss, EBIT 82 –66 23 27 18 14 –81<br />
Interest income/costs<br />
Profit/loss after financial<br />
–75 –30 –23 –24 –16 –12 –15<br />
items, EBT 7 –96 – 3 2 2 –96<br />
Tax on profit/loss –7 96 – –3 –2 –2 96<br />
NET PROFIT/lOSS – – – – – – –<br />
Balance sheet<br />
SEK million<br />
Dec 31,<br />
2011<br />
Sep 30,<br />
2011<br />
Jun 30,<br />
2011<br />
Mar 31,<br />
2011<br />
Dec 31,<br />
2010<br />
ASSETS<br />
FIXED ASSETS<br />
Goodwill – 147 147 142 144<br />
Other intangible assets 450 264 265 265 32<br />
Intangible assets 450 411 412 407 176<br />
Tangible assets 2,189 2,550 2,518 2,384 2,312<br />
Financial assets –2,529 –2,516 –1,403 –1,126 –1,068<br />
Deferred tax assets 91 91 91 92 96<br />
FIXED ASSETS 201 536 1,618 1,757 1,516<br />
CuRRENT ASSETS<br />
Current receivables 104 134 134 155 164<br />
Cash and cash equivalents 50 26 58 61 36<br />
CuRRENT ASSETS 154 160 192 216 200<br />
ASSETS 355 696 1,810 1,973 1,716<br />
EQuITy AND lIABIlITIES<br />
lONG-TERM lIABIlITIES<br />
Interestbearing liabilities – 332 287 247 216<br />
lONG-TERM lIABIlITIES – 332 287 247 216<br />
SHORT-TERM lIABIlITIES<br />
Interestbearing liabilities – – 1,171 1,187 1,260<br />
Noninterestbearing liabilities 355 364 352 539 240<br />
SHORT-TERM lIABIlITIES 355 364 1,523 1,726 1,500<br />
EQuITy AND lIABIlITIES 355 696 1,810 1,973 1,716<br />
Cash flow statement<br />
2011 2010<br />
Full year Full year<br />
SEK million<br />
OPERATING ACTIVITIES<br />
Cash flow from operations,<br />
less paid taxes 285 314 59 69 82 75 64<br />
Changes in working capital<br />
CASH FlOW FROM OPERATING<br />
157 42 54 –18 68 53 26<br />
ACTIVITIES 442 356 113 51 150 128 90<br />
2011<br />
Q4<br />
2011<br />
Q3<br />
2011<br />
Q2<br />
2011<br />
Q1<br />
2010<br />
Q4<br />
INVESTING ACTIVITIES<br />
Capital expenditure in intangible<br />
and tangible assets, CAPEX –905 –355 –353 –69 –400 –83 –171<br />
Cash flow after CAPEX<br />
Acquisition of shares and<br />
–463 1 –240 –18 –250 45 –81<br />
participations<br />
Changes of longterm receivables<br />
–372 118 –12 –375 – 15 –<br />
from joint ventures 1,999 200 276 1,487 234 2 200<br />
Cash flow from investing activities<br />
CASH FlOW AFTER INVESTING<br />
722 –37 –89 1,043 –166 –66 29<br />
ACTIVITIES 1,164 319 24 1,094 –16 62 119<br />
FINANCING ACTIVITIES<br />
Change of loans, net<br />
Cash flow from<br />
–1,150 –393 – –1,126 13 –37 –134<br />
financing activities<br />
NET CHANGE IN CASH<br />
–1,150 –393 – –1,126 13 –37 –134<br />
AND CASH EQuIVAlENTS 14 –74 24 –32 –3 25 –15<br />
Cash and cash equivalents at<br />
beginning of period<br />
CASH AND CASH EQuIVAlENTS<br />
36 110 26 58 61 36 51<br />
AT END OF THE PERIOD 50 36 50 26 58 61 36<br />
<strong>Tele2</strong> – <strong>Interim</strong> <strong>Report</strong> <strong>January–March</strong> <strong>2012</strong> 28 (30)
CONT. NOTE 11<br />
Net sales<br />
SEK million<br />
2011 2010<br />
Full year Full year<br />
2011<br />
Q4<br />
2011<br />
Q3<br />
2011<br />
Q2<br />
2011<br />
Q1<br />
2010<br />
Q4<br />
Sweden<br />
Mobile 222 382 40 70 61 51 62<br />
Other operations –4 –11 2 –2 –3 –1 –4<br />
Norway<br />
218 371 42 68 58 50 58<br />
Mobile 74 66 – 27 24 23 19<br />
TOTAl<br />
74 66 – 27 24 23 19<br />
Mobile 296 448 40 97 85 74 81<br />
Other operations –4 –11 2 –2 –3 –1 –4<br />
292 437 42 95 82 73 77<br />
Internal sales, elimination –41 –16 –29 –6 –2 –4 –7<br />
TOTAl 251 421 13 89 80 69 70<br />
Internal sales<br />
2011 2010 2011 2011 2011 2011 2010<br />
SEK million<br />
Sweden<br />
Full year Full year Q4 Q3 Q2 Q1 Q4<br />
Mobile 16 12 8 4 2 2 5<br />
Other operations 25 4 21 2 – 2 2<br />
TOTAl 41 16 29 6 2 4 7<br />
EBITDA<br />
2011 2010 2011 2011 2011 2011 2010<br />
SEK million<br />
Sweden<br />
Full year Full year Q4 Q3 Q2 Q1 Q4<br />
Mobile 318 345 82 76 85 75 72<br />
Norway<br />
318 345 82 76 85 75 72<br />
Mobile 42 14 – 17 13 12 6<br />
42 14 – 17 13 12 6<br />
TOTAl 360 359 82 93 98 87 78<br />
EBIT<br />
2011 2010 2011 2011 2011 2011 2010<br />
SEK million<br />
Sweden<br />
Full year Full year Q4 Q3 Q2 Q1 Q4<br />
Mobile 66 18 23 19 14 10 6<br />
Norway<br />
66 18 23 19 14 10 6<br />
Mobile 16 12 – 8 4 4 9<br />
16 12 – 8 4 4 9<br />
82 30 23 27 18 14 15<br />
Oneoff items – –96 – – – – –96<br />
TOTAl 82 –66 23 27 18 14 –81<br />
SPECIFICATION OF ITEMS BETWEEN EBITDA AND EBIT<br />
2011 2010 2011 2011 2011 2011 2010<br />
SEK million<br />
Full year Full year Q4 Q3 Q2 Q1 Q4<br />
EBITDA<br />
Oneoff items in result from<br />
360 359 82 93 98 87 78<br />
shares in joint ventures<br />
Depreciation/amortization and<br />
– –96 – – – – –96<br />
other impairment<br />
Result from shares in associated<br />
–262 –280 –61 –66 –72 –63 –60<br />
companies and joint ventures –16 –49 2 – –8 –10 –3<br />
EBIT 82 –66 23 27 18 14 –81<br />
CAPEX<br />
2011 2010 2011 2011 2011 2011 2010<br />
SEK million<br />
Sweden<br />
Full year Full year Q4 Q3 Q2 Q1 Q4<br />
Mobile 882 254 356 56 127 343 155<br />
Norway<br />
882 254 356 56 127 343 155<br />
Mobile 130 190 1 36 62 31 105<br />
130 190 1 36 62 31 105<br />
TOTAl 1,012 444 357 92 189 374 260<br />
SEK million<br />
2011 2010<br />
Full year Full year<br />
ADDITIONAL CASH FLOW INFORMATION<br />
2011<br />
Q4<br />
2011<br />
Q3<br />
2011<br />
Q2<br />
2011<br />
Q1<br />
2010<br />
Q4<br />
CAPEX according to<br />
cash flow statement<br />
This year unpaid CAPEX and paid<br />
905 355 353 69 400 83 171<br />
CAPEX from previous year<br />
CAPEX according to balance<br />
107 89 4 23 –211 291 89<br />
sheet 1,012 444 357 92 189 374 260<br />
KEy RATIOS<br />
SEK million 2011 2010 2009 2008<br />
Net sales 251 421 400 300<br />
EBITDA 360 359 227 225<br />
EBIT 82 –66 45 120<br />
EBT 7 –96 – –<br />
Total assets 355 1,716 2,268 2,360<br />
Cash flow from operating activities 442 356 309 192<br />
Cash flow after CAPEX –463 1 –143 –251<br />
Available liquidity 50 440 110 35<br />
Net debt<br />
Investments in intangible and tangible<br />
2,149 1,726 1,842 2,060<br />
assets, CAPEX<br />
Investments in shares, shortterm<br />
1,012 444 452 443<br />
investments etc –1,627 –318 –352 –87<br />
Key ratios<br />
EBITDA margin, % 0.7 0.6 –0.4 0.4<br />
EBIT margin, % 0.1 –0.3 – 0.2<br />
Equity/assets ratio, % – –3 –4 –3<br />
Debt/equity ratio, multiple 0.10 0.06 0.06 0.08<br />
Return on capital employed, % –0.4 –1.4 –0.9 –0.1<br />
Average interest rate, % –0.5 –2.7 –1.1 –<br />
Value per share (SEK)<br />
Cash flow from operating activities 0.99 0.81 0.70 0.43<br />
<strong>Tele2</strong> – <strong>Interim</strong> <strong>Report</strong> <strong>January–March</strong> <strong>2012</strong> 29 (30)
NOTE 12 CHANGED ACCOUNTING PRINCIPLE FOR<br />
INTERNAL SALE<br />
From January 1, <strong>2012</strong> internal sales within the segments (countries)<br />
are not reported in net sales and internal sales for respective segment.<br />
The comparable periods are restated. The effects to the financial<br />
statements are stated below.<br />
2011 2011 2011 2011 2011 2010 2010<br />
SEK million<br />
Internal net sales<br />
Sweden<br />
Full year Q4 Q3 Q2 Q1 Full year Q4<br />
–mobile –410 –148 –97 –86 –79 –235 –73<br />
–fixed broadband –14 –5 –4 –4 –1 –14 –2<br />
–other operations –31 –21 –3 –3 –4 –26 –2<br />
–455 –174 –104 –93 –84 –275 –77<br />
Norway, mobile –32 –32 – – – – –<br />
Russia, mobile<br />
Netherlands<br />
–206 –49 –66 –60 –31 –154 –39<br />
–fixed broadband –8 –2 –1 –3 –2 –12 –3<br />
–other operations –51 –17 –15 –10 –9 –3 –3<br />
–59 –19 –16 –13 –11 –15 –6<br />
Other, other operations<br />
TOTAl<br />
–4 – –1 – –3 –11 1<br />
–mobile –648 –229 –163 –146 –110 –389 –112<br />
–fixed broadband –22 –7 –5 –7 –3 –26 –5<br />
–other operations –86 –38 –19 –13 –16 –40 –4<br />
–756 –274 –187 –166 –129 –455 –121<br />
Internal sales, elimination 756 274 187 166 129 455 121<br />
Net sales – – – – – – –<br />
<strong>Tele2</strong> – <strong>Interim</strong> <strong>Report</strong> <strong>January–March</strong> <strong>2012</strong> 30 (30)