Interim Report January–March 2012 - Tele2
Interim Report January–March 2012 - Tele2
Interim Report January–March 2012 - Tele2

Create successful ePaper yourself
Turn your PDF publications into a flip-book with our unique Google optimized e-Paper software.
NOTE 11 CHANGED ACCOUNTING PRINCIPLE FOR<br />
JOINT VENTURES<br />
On January 1, <strong>2012</strong> <strong>Tele2</strong> changed the accounting principles for joint<br />
ventures from the equity method to proportionate consolidation, with<br />
retrospective application.<br />
The International Accounting Standards Board (IASB) has issued a<br />
new standard for joint arrangements, IFRS 11 (not yet adopted by the<br />
EU). IFRS 11 is focusing on the rights and obligations that exist between<br />
the parties. This is determinative when deciding which type of joint<br />
arrangement exists. A joint arrangement is a construction where two<br />
or more parties contractually agree on joint control. Joint control is<br />
the contractually agreed sharing of control of an arrangement, which<br />
exists only when decisions about the relevant activities require unanimous<br />
consent of the parties sharing control. It is not only the legal form<br />
of the arrangement that should be considered. There are two types of<br />
joint arrangements: joint operations and joint ventures. A joint operation<br />
arises when the joint control owners have rights to the assets and<br />
obligations for the liabilities that are connected to the investment. A<br />
joint venture applies to the case where the joint control parties have<br />
rights to the net assets of the investment. Depending on whether the<br />
arrangement is a joint operation or a joint venture, different accounting<br />
principles shall be applied. According to the new standard, only<br />
the equity method is allowed when consolidating joint ventures, i.e.<br />
proportionate consolidation is no longer allowed. The parties in a joint<br />
operation shall report their assets, liabilities, revenues and expenses<br />
and their share of joint assets, liabilities, revenues and expenses.<br />
<strong>Tele2</strong> reviewed in 2011 its joint ventures, and the major part of these<br />
was classified as joint operations according to IFRS 11. As a consequence,<br />
<strong>Tele2</strong> changed accounting principle already from January 1,<br />
<strong>2012</strong>, within the current IAS 31 Interests in Joint Ventures, from the<br />
equity method to proportionate consolidation for joint ventures. The<br />
decision was additionally based on the fact that <strong>Tele2</strong> Sweden is<br />
building its 3G and 4G networks in joint ventures and that proportionate<br />
consolidation was expected to give a more true and fair view. The<br />
change of accounting principle increased the net sales, EBITDA, assets<br />
and liabilities of the group and had a minor effect on operating profit<br />
and net cash flows. The change had no effect on net profit or shareholders’<br />
equity.<br />
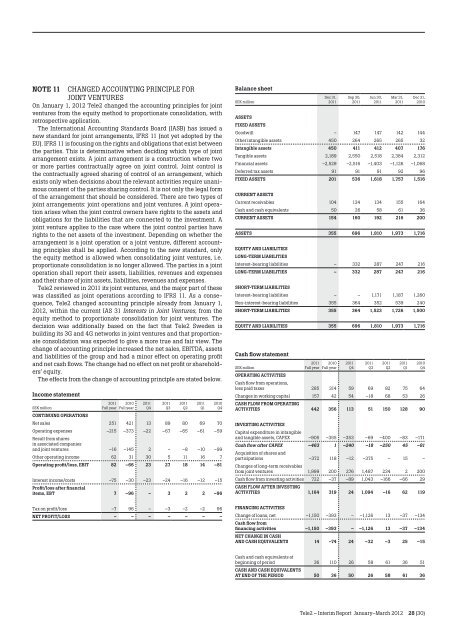
The effects from the change of accounting principle are stated below.<br />
Income statement<br />
2011 2010 2011 2011 2011 2011 2010<br />
SEK million<br />
CONTINuING OPERATIONS<br />
Full year Full year Q4 Q3 Q2 Q1 Q4<br />
Net sales 251 421 13 89 80 69 70<br />
Operating expenses<br />
Result from shares<br />
in associated companies<br />
–215 –373 –22 –67 –65 –61 –59<br />
and joint ventures –16 –145 2 – –8 –10 –99<br />
Other operating income 62 31 30 5 11 16 7<br />
Operating profit/loss, EBIT 82 –66 23 27 18 14 –81<br />
Interest income/costs<br />
Profit/loss after financial<br />
–75 –30 –23 –24 –16 –12 –15<br />
items, EBT 7 –96 – 3 2 2 –96<br />
Tax on profit/loss –7 96 – –3 –2 –2 96<br />
NET PROFIT/lOSS – – – – – – –<br />
Balance sheet<br />
SEK million<br />
Dec 31,<br />
2011<br />
Sep 30,<br />
2011<br />
Jun 30,<br />
2011<br />
Mar 31,<br />
2011<br />
Dec 31,<br />
2010<br />
ASSETS<br />
FIXED ASSETS<br />
Goodwill – 147 147 142 144<br />
Other intangible assets 450 264 265 265 32<br />
Intangible assets 450 411 412 407 176<br />
Tangible assets 2,189 2,550 2,518 2,384 2,312<br />
Financial assets –2,529 –2,516 –1,403 –1,126 –1,068<br />
Deferred tax assets 91 91 91 92 96<br />
FIXED ASSETS 201 536 1,618 1,757 1,516<br />
CuRRENT ASSETS<br />
Current receivables 104 134 134 155 164<br />
Cash and cash equivalents 50 26 58 61 36<br />
CuRRENT ASSETS 154 160 192 216 200<br />
ASSETS 355 696 1,810 1,973 1,716<br />
EQuITy AND lIABIlITIES<br />
lONG-TERM lIABIlITIES<br />
Interestbearing liabilities – 332 287 247 216<br />
lONG-TERM lIABIlITIES – 332 287 247 216<br />
SHORT-TERM lIABIlITIES<br />
Interestbearing liabilities – – 1,171 1,187 1,260<br />
Noninterestbearing liabilities 355 364 352 539 240<br />
SHORT-TERM lIABIlITIES 355 364 1,523 1,726 1,500<br />
EQuITy AND lIABIlITIES 355 696 1,810 1,973 1,716<br />
Cash flow statement<br />
2011 2010<br />
Full year Full year<br />
SEK million<br />
OPERATING ACTIVITIES<br />
Cash flow from operations,<br />
less paid taxes 285 314 59 69 82 75 64<br />
Changes in working capital<br />
CASH FlOW FROM OPERATING<br />
157 42 54 –18 68 53 26<br />
ACTIVITIES 442 356 113 51 150 128 90<br />
2011<br />
Q4<br />
2011<br />
Q3<br />
2011<br />
Q2<br />
2011<br />
Q1<br />
2010<br />
Q4<br />
INVESTING ACTIVITIES<br />
Capital expenditure in intangible<br />
and tangible assets, CAPEX –905 –355 –353 –69 –400 –83 –171<br />
Cash flow after CAPEX<br />
Acquisition of shares and<br />
–463 1 –240 –18 –250 45 –81<br />
participations<br />
Changes of longterm receivables<br />
–372 118 –12 –375 – 15 –<br />
from joint ventures 1,999 200 276 1,487 234 2 200<br />
Cash flow from investing activities<br />
CASH FlOW AFTER INVESTING<br />
722 –37 –89 1,043 –166 –66 29<br />
ACTIVITIES 1,164 319 24 1,094 –16 62 119<br />
FINANCING ACTIVITIES<br />
Change of loans, net<br />
Cash flow from<br />
–1,150 –393 – –1,126 13 –37 –134<br />
financing activities<br />
NET CHANGE IN CASH<br />
–1,150 –393 – –1,126 13 –37 –134<br />
AND CASH EQuIVAlENTS 14 –74 24 –32 –3 25 –15<br />
Cash and cash equivalents at<br />
beginning of period<br />
CASH AND CASH EQuIVAlENTS<br />
36 110 26 58 61 36 51<br />
AT END OF THE PERIOD 50 36 50 26 58 61 36<br />
<strong>Tele2</strong> – <strong>Interim</strong> <strong>Report</strong> <strong>January–March</strong> <strong>2012</strong> 28 (30)