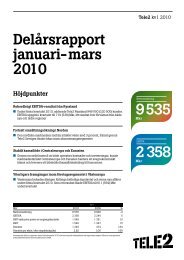
Interim Report January–March 2012 - Tele2
Interim Report January–March 2012 - Tele2
Interim Report January–March 2012 - Tele2
You also want an ePaper? Increase the reach of your titles
YUMPU automatically turns print PDFs into web optimized ePapers that Google loves.
Key ratios<br />
SEK million<br />
CONTINuING OPERATIONS<br />
<strong>2012</strong><br />
Jan 1–Mar 31<br />
2011<br />
Jan 1–Mar 31<br />
2011 2010 2009 2008<br />
Net sales 10,481 9,642 41,001 40,585 39,836 38,630<br />
Number of customers (by thousands) 34,759 31,238 34,186 30,883 26,579 24,018<br />
EBITDA 2,571 2,544 11,212 10,643 9,621 8,452<br />
EBIT 1,383 1,673 7,050 7,022 5,781 3,026<br />
EBT 1,205 1,599 6,376 6,639 5,236 1,893<br />
Net profit 869 1,226 4,904 6,481 4,755 1,758<br />
Key ratios<br />
EBITDA margin, % 24.5 26.4 27.3 26.6 24.2 21.8<br />
EBIT margin, % 13.2 17.4 17.2 17.3 14.5 7.8<br />
Value per share (SEK)<br />
Earnings 1.96 2.76 11.05 14.69 10.72 3.91<br />
Earnings after dilution 1.95 2.75 11.00 14.63 10.70 3.91<br />
TOTAl<br />
Shareholders’ equity 22,271 29,988 21,452 28,875 28,823 28,405<br />
Shareholders’ equity after dilution 22,272 29,996 21,455 28,894 28,823 28,415<br />
Total assets 46,595 42,817 46,864 42,085 43,005 49,697<br />
Cash flow from operating activities 1,896 2,182 9,690 9,966 9,427 8,088<br />
Cash flow after CAPEX 1,066 1,166 4,118 6,008 4,635 3,037<br />
Available liquidity 15,656 16,847 9,986 13,254 12,520 17,248<br />
Net debt 12,714 2,152 13,518 3,417 4,013 7,012<br />
Investments in intangible and tangible assets, CAPEX 1,043 1,313 6,105 4,095 4,891 5,066<br />
Investments in shares, shortterm investments etc 198 –3 1,563 1,424 –3,709 –2,342<br />
Key ratios<br />
Equity/assets ratio, % 48 70 46 69 67 57<br />
Debt/equity ratio, multiple 0.57 0.07 0.63 0.12 0.14 0.25<br />
Return on shareholders’ equity, % 15.9 16.5 19.5 24.0 16.4 8.9<br />
Return on shareholders’ equity after dilution, % 15.9 16.5 19.5 24.0 16.4 8.9<br />
Return on capital employed, % 15.5 20.0 20.4 22.2 16.7 12.8<br />
Average interest rate, % 5.7 5.9 6.2 7.3 5.9 6.2<br />
Value per share (SEK)<br />
Earnings 1.96 2.73 11.03 15.70 10.61 5.53<br />
Earnings after dilution 1.95 2.72 10.98 15.64 10.59 5.53<br />
Shareholders’ equity 50.13 67.62 48.33 65.44 65.31 63.93<br />
Shareholders’ equity after dilution 49.87 67.36 48.09 65.23 65.18 63.90<br />
Cash flow from operating activities 4.27 4.92 21.83 22.59 21.41 18.23<br />
Dividend, ordinary 6.501) 6.00 3.85 3.50<br />
Extraordinary dividend 6.501) 21.00 2.00 1.50<br />
Market price at closing day 135.00 145.80 133.90 139.60 110.20 69.00<br />
1) Proposed dividend<br />
<strong>Tele2</strong> – <strong>Interim</strong> <strong>Report</strong> <strong>January–March</strong> <strong>2012</strong> 23 (30)


