Interim Report January–March 2012 - Tele2
Interim Report January–March 2012 - Tele2
Interim Report January–March 2012 - Tele2

Create successful ePaper yourself
Turn your PDF publications into a flip-book with our unique Google optimized e-Paper software.
Financial Overview<br />
<strong>Tele2</strong>’s financial performance is driven by its relentless focus on developing mobile services on its<br />
own infrastructure, complemented in certain countries by fixed broadband services and businesstobusiness<br />
offerings. Mobile sales, which grew compared to the same period last year, and greater<br />
efforts to develop mobile services on own infrastructure have further improved <strong>Tele2</strong>’s EBITDA contribution.<br />
The group will concentrate on maximizing the return from fixedline operations, as their<br />
customer base continues to decline.<br />
Net customer intake amounted to 559,000 (399,000) in Q1 <strong>2012</strong>.<br />
The customer intake in mobile services amounted to 679,000<br />
(522,000). This trend was mainly driven by a good customer intake<br />
in <strong>Tele2</strong> Kazakhstan, complemented by solid customer intake in<br />
<strong>Tele2</strong> Russia, whose customer bases grew by 332,000 (24,000)<br />
and 304,000 (547,000) customers respectively. The fixed broadband<br />
customer base lost 22,000 (4,000) customers in Q1 <strong>2012</strong>,<br />
primarily attributable to <strong>Tele2</strong>’s operations in the Netherlands and<br />
in Germany. As expected, the number of fixed telephony customers<br />
fell in Q1 <strong>2012</strong>. On March 31, <strong>2012</strong> the total customer base amounted<br />
to 34,759,000 (31,238,000) thanks to a continued growth in mobile<br />
services.<br />
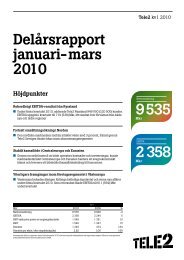
Net sales in Q1 <strong>2012</strong> amounted to SEK 10,481 (9,642) million corresponding<br />
to a growth excluding exchange rate differences and oneoff<br />
items of 8 percent. The revenue development was mainly a result<br />
of sustained success in mobile services and the integration of Network<br />
Norway, which contributed with SEK 547 million in the quarter.<br />
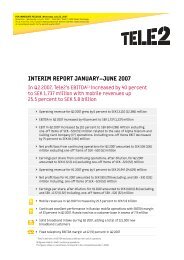
EBITDA in Q1 <strong>2012</strong> amounted to SEK 2,571 (2,544) million, equivalent<br />
to an EBITDA margin of 25 (26) percent. The EBITDA development<br />
was negatively affected by significant marketing efforts in<br />
both <strong>Tele2</strong> Sweden and <strong>Tele2</strong> Russia as a response to increased<br />
competition.<br />
Net sales<br />
MSEK<br />
12,000<br />
10,000<br />
8,000<br />
6,000<br />
4,000<br />
2,000<br />
0<br />
1) See section EBIT on page 20.<br />
EBIT in Q1 <strong>2012</strong> amounted to SEK 1,382 (1,574) million excluding<br />
oneoff items 1) . Including oneoff items, EBIT amounted to SEK 1,383<br />
(1,673) million. The EBIT development was negatively impacted by<br />
the integration of Network Norway and also an accelerated depreciation<br />
of network equipment in the Baltic region in preparation of a<br />
network replacement amounting to SEK 69 million (Note 2).<br />
Profit before tax in Q1 <strong>2012</strong> amounted to SEK 1,205 (1,599) million.<br />
Net profit in Q1 <strong>2012</strong> amounted to SEK 869 (1,226) million. <strong>Report</strong>ed<br />
tax for Q1 <strong>2012</strong> amounted to SEK 336 (373) million. Tax payment<br />
affecting cash flow amounted to SEK 202 (225) million.<br />
Cash flow after CAPEX in Q1 <strong>2012</strong> amounted to SEK 1,066 (1,166)<br />
million.<br />
CAPEX in Q1 <strong>2012</strong> amounted to SEK 1,043 (1,313) million, driven<br />
mainly by further network expansion in Sweden, Russia and<br />
Kazakhstan.<br />
Net debt amounted to SEK 12,714 (2,152) million on March 31, <strong>2012</strong>,<br />
or 1.13 times 12month rolling EBITDA. <strong>Tele2</strong>’s available liquidity<br />
amounted to SEK 15,656 (16,847) million.<br />
EBITDA / EBITDA margin<br />
MSEK / Percent<br />
Q1 Q2 Q3 Q4 Q1<br />
0<br />
Q1 Q2 Q3 Q4 Q1<br />
2011 <strong>2012</strong> 2011 <strong>2012</strong><br />
3,000<br />
2,500<br />
2,000<br />
1,500<br />
1,000<br />
500<br />
30<br />
25<br />
20<br />
15<br />
10<br />
<strong>Tele2</strong> – <strong>Interim</strong> <strong>Report</strong> <strong>January–March</strong> <strong>2012</strong> 3 (30)<br />
5<br />
0