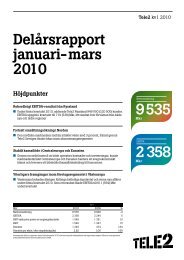
Interim Report January–March 2012 - Tele2
Interim Report January–March 2012 - Tele2
Interim Report January–March 2012 - Tele2
Create successful ePaper yourself
Turn your PDF publications into a flip-book with our unique Google optimized e-Paper software.
CONT. NOTE 11<br />
Net sales<br />
SEK million<br />
2011 2010<br />
Full year Full year<br />
2011<br />
Q4<br />
2011<br />
Q3<br />
2011<br />
Q2<br />
2011<br />
Q1<br />
2010<br />
Q4<br />
Sweden<br />
Mobile 222 382 40 70 61 51 62<br />
Other operations –4 –11 2 –2 –3 –1 –4<br />
Norway<br />
218 371 42 68 58 50 58<br />
Mobile 74 66 – 27 24 23 19<br />
TOTAl<br />
74 66 – 27 24 23 19<br />
Mobile 296 448 40 97 85 74 81<br />
Other operations –4 –11 2 –2 –3 –1 –4<br />
292 437 42 95 82 73 77<br />
Internal sales, elimination –41 –16 –29 –6 –2 –4 –7<br />
TOTAl 251 421 13 89 80 69 70<br />
Internal sales<br />
2011 2010 2011 2011 2011 2011 2010<br />
SEK million<br />
Sweden<br />
Full year Full year Q4 Q3 Q2 Q1 Q4<br />
Mobile 16 12 8 4 2 2 5<br />
Other operations 25 4 21 2 – 2 2<br />
TOTAl 41 16 29 6 2 4 7<br />
EBITDA<br />
2011 2010 2011 2011 2011 2011 2010<br />
SEK million<br />
Sweden<br />
Full year Full year Q4 Q3 Q2 Q1 Q4<br />
Mobile 318 345 82 76 85 75 72<br />
Norway<br />
318 345 82 76 85 75 72<br />
Mobile 42 14 – 17 13 12 6<br />
42 14 – 17 13 12 6<br />
TOTAl 360 359 82 93 98 87 78<br />
EBIT<br />
2011 2010 2011 2011 2011 2011 2010<br />
SEK million<br />
Sweden<br />
Full year Full year Q4 Q3 Q2 Q1 Q4<br />
Mobile 66 18 23 19 14 10 6<br />
Norway<br />
66 18 23 19 14 10 6<br />
Mobile 16 12 – 8 4 4 9<br />
16 12 – 8 4 4 9<br />
82 30 23 27 18 14 15<br />
Oneoff items – –96 – – – – –96<br />
TOTAl 82 –66 23 27 18 14 –81<br />
SPECIFICATION OF ITEMS BETWEEN EBITDA AND EBIT<br />
2011 2010 2011 2011 2011 2011 2010<br />
SEK million<br />
Full year Full year Q4 Q3 Q2 Q1 Q4<br />
EBITDA<br />
Oneoff items in result from<br />
360 359 82 93 98 87 78<br />
shares in joint ventures<br />
Depreciation/amortization and<br />
– –96 – – – – –96<br />
other impairment<br />
Result from shares in associated<br />
–262 –280 –61 –66 –72 –63 –60<br />
companies and joint ventures –16 –49 2 – –8 –10 –3<br />
EBIT 82 –66 23 27 18 14 –81<br />
CAPEX<br />
2011 2010 2011 2011 2011 2011 2010<br />
SEK million<br />
Sweden<br />
Full year Full year Q4 Q3 Q2 Q1 Q4<br />
Mobile 882 254 356 56 127 343 155<br />
Norway<br />
882 254 356 56 127 343 155<br />
Mobile 130 190 1 36 62 31 105<br />
130 190 1 36 62 31 105<br />
TOTAl 1,012 444 357 92 189 374 260<br />
SEK million<br />
2011 2010<br />
Full year Full year<br />
ADDITIONAL CASH FLOW INFORMATION<br />
2011<br />
Q4<br />
2011<br />
Q3<br />
2011<br />
Q2<br />
2011<br />
Q1<br />
2010<br />
Q4<br />
CAPEX according to<br />
cash flow statement<br />
This year unpaid CAPEX and paid<br />
905 355 353 69 400 83 171<br />
CAPEX from previous year<br />
CAPEX according to balance<br />
107 89 4 23 –211 291 89<br />
sheet 1,012 444 357 92 189 374 260<br />
KEy RATIOS<br />
SEK million 2011 2010 2009 2008<br />
Net sales 251 421 400 300<br />
EBITDA 360 359 227 225<br />
EBIT 82 –66 45 120<br />
EBT 7 –96 – –<br />
Total assets 355 1,716 2,268 2,360<br />
Cash flow from operating activities 442 356 309 192<br />
Cash flow after CAPEX –463 1 –143 –251<br />
Available liquidity 50 440 110 35<br />
Net debt<br />
Investments in intangible and tangible<br />
2,149 1,726 1,842 2,060<br />
assets, CAPEX<br />
Investments in shares, shortterm<br />
1,012 444 452 443<br />
investments etc –1,627 –318 –352 –87<br />
Key ratios<br />
EBITDA margin, % 0.7 0.6 –0.4 0.4<br />
EBIT margin, % 0.1 –0.3 – 0.2<br />
Equity/assets ratio, % – –3 –4 –3<br />
Debt/equity ratio, multiple 0.10 0.06 0.06 0.08<br />
Return on capital employed, % –0.4 –1.4 –0.9 –0.1<br />
Average interest rate, % –0.5 –2.7 –1.1 –<br />
Value per share (SEK)<br />
Cash flow from operating activities 0.99 0.81 0.70 0.43<br />
<strong>Tele2</strong> – <strong>Interim</strong> <strong>Report</strong> <strong>January–March</strong> <strong>2012</strong> 29 (30)


