Interim Report January–March 2012 - Tele2
Interim Report January–March 2012 - Tele2
Interim Report January–March 2012 - Tele2

Create successful ePaper yourself
Turn your PDF publications into a flip-book with our unique Google optimized e-Paper software.
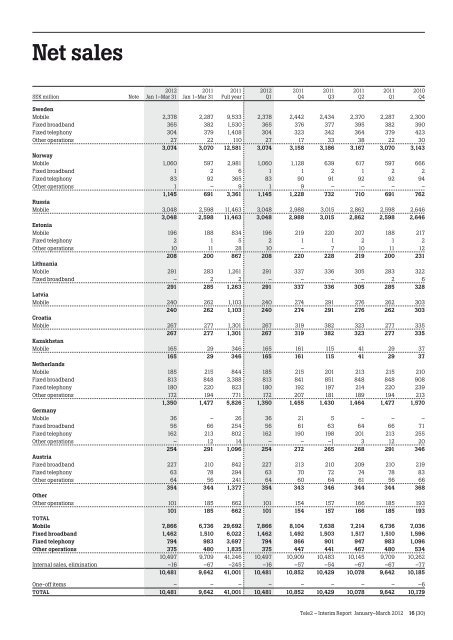
Net sales<br />
SEK million Note<br />
<strong>2012</strong><br />
Jan 1–Mar 31<br />
2011<br />
Jan 1–Mar 31<br />
2011<br />
Full year<br />
Sweden<br />
Mobile 2,378 2,287 9,533 2,378 2,442 2,434 2,370 2,287 2,300<br />
Fixed broadband 365 382 1,530 365 376 377 395 382 390<br />
Fixed telephony 304 379 1,408 304 323 342 364 379 423<br />
Other operations 27 22 110 27 17 33 38 22 30<br />
3,074 3,070 12,581 3,074 3,158 3,186 3,167 3,070 3,143<br />
Norway<br />
Mobile 1,060 597 2,981 1,060 1,128 639 617 597 666<br />
Fixed broadband 1 2 6 1 1 2 1 2 2<br />
Fixed telephony 83 92 365 83 90 91 92 92 94<br />
Other operations 1 – 9 1 9 – – – –<br />
1,145 691 3,361 1,145 1,228 732 710 691 762<br />
Russia<br />
Mobile 3,048 2,598 11,463 3,048 2,988 3,015 2,862 2,598 2,646<br />
3,048 2,598 11,463 3,048 2,988 3,015 2,862 2,598 2,646<br />
Estonia<br />
Mobile 196 188 834 196 219 220 207 188 217<br />
Fixed telephony 2 1 5 2 1 1 2 1 2<br />
Other operations 10 11 28 10 – 7 10 11 12<br />
208 200 867 208 220 228 219 200 231<br />
lithuania<br />
Mobile 291 283 1,261 291 337 336 305 283 322<br />
Fixed broadband – 2 2 – – – – 2 6<br />
291 285 1,263 291 337 336 305 285 328<br />
latvia<br />
Mobile 240 262 1,103 240 274 291 276 262 303<br />
240 262 1,103 240 274 291 276 262 303<br />
Croatia<br />
Mobile 267 277 1,301 267 319 382 323 277 335<br />
267 277 1,301 267 319 382 323 277 335<br />
Kazakhstan<br />
Mobile 165 29 346 165 161 115 41 29 37<br />
165 29 346 165 161 115 41 29 37<br />
Netherlands<br />
Mobile 185 215 844 185 215 201 213 215 210<br />
Fixed broadband 813 848 3,388 813 841 851 848 848 908<br />
Fixed telephony 180 220 823 180 192 197 214 220 239<br />
Other operations 172 194 771 172 207 181 189 194 213<br />
1,350 1,477 5,826 1,350 1,455 1,430 1,464 1,477 1,570<br />
Germany<br />
Mobile 36 – 26 36 21 5 – – –<br />
Fixed broadband 56 66 254 56 61 63 64 66 71<br />
Fixed telephony 162 213 802 162 190 198 201 213 255<br />
Other operations – 12 14 – – –1 3 12 20<br />
254 291 1,096 254 272 265 268 291 346<br />
Austria<br />
Fixed broadband 227 210 842 227 213 210 209 210 219<br />
Fixed telephony 63 78 294 63 70 72 74 78 83<br />
Other operations 64 56 241 64 60 64 61 56 66<br />
354 344 1,377 354 343 346 344 344 368<br />
Other<br />
Other operations 101 185 662 101 154 157 166 185 193<br />
101 185 662 101 154 157 166 185 193<br />
TOTAl<br />
Mobile 7,866 6,736 29,692 7,866 8,104 7,638 7,214 6,736 7,036<br />
Fixed broadband 1,462 1,510 6,022 1,462 1,492 1,503 1,517 1,510 1,596<br />
Fixed telephony 794 983 3,697 794 866 901 947 983 1,096<br />
Other operations 375 480 1,835 375 447 441 467 480 534<br />
10,497 9,709 41,246 10,497 10,909 10,483 10,145 9,709 10,262<br />
Internal sales, elimination –16 –67 –245 –16 –57 –54 –67 –67 –77<br />
10,481 9,642 41,001 10,481 10,852 10,429 10,078 9,642 10,185<br />
Oneoff items – – – – – – – – –6<br />
TOTAl 10,481 9,642 41,001 10,481 10,852 10,429 10,078 9,642 10,179<br />
<strong>2012</strong><br />
Q1<br />
2011<br />
Q4<br />
2011<br />
Q3<br />
2011<br />
Q2<br />
2011<br />
Q1<br />
2010<br />
Q4<br />
<strong>Tele2</strong> – <strong>Interim</strong> <strong>Report</strong> <strong>January–March</strong> <strong>2012</strong> 16 (30)