download block - GSI Helmholtzzentrum für Schwerionenforschung
download block - GSI Helmholtzzentrum für Schwerionenforschung
download block - GSI Helmholtzzentrum für Schwerionenforschung

Create successful ePaper yourself
Turn your PDF publications into a flip-book with our unique Google optimized e-Paper software.
<strong>GSI</strong>-ACCELERATORS-08 <strong>GSI</strong> SCIENTIFIC REPORT 2009<br />
Beam Response on Base-Band Tune Measurement System<br />
U. Springer 1,2 , P. Forck 1 , P. Hülsmann 1,2 , P. Kowina 1 , and P. Moritz 1<br />
1 <strong>GSI</strong>, Darmstadt, Germany; 2 Goethe University, Frankfurt, Germany<br />
For high current operation of SIS18 precise control of<br />
the tune value is required. It is measured by excitation of<br />
coherent betatron oscillations and turn-by-turn position determination<br />
using a Beam Position Monitor (BPM). In order<br />
to define the working area of this Tune Measurement<br />
System using direct digitized BPM data, the influence of<br />
beam excitation on emittance must be evaluated. The beam<br />
width and beam loss were measured along with the frequency<br />
spectrum obtained out of BPM data.<br />
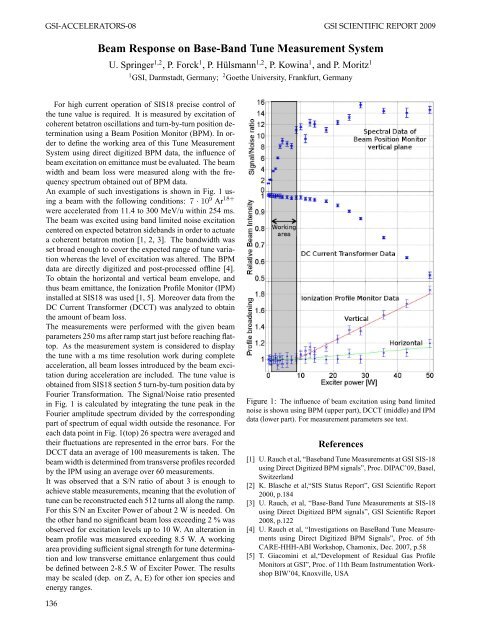
An example of such investigations is shown in Fig. 1 using<br />
a beam with the following conditions: 7 · 10 9 Ar 18+<br />
were accelerated from 11.4 to 300 MeV/u within 254 ms.<br />
The beam was excited using band limited noise excitation<br />
centered on expected betatron sidebands in order to actuate<br />
a coherent betatron motion [1, 2, 3]. The bandwidth was<br />
set broad enough to cover the expected range of tune variation<br />
whereas the level of excitation was altered. The BPM<br />
data are directly digitized and post-processed offline [4].<br />
To obtain the horizontal and vertical beam envelope, and<br />
thus beam emittance, the Ionization Profile Monitor (IPM)<br />
installed at SIS18 was used [1, 5]. Moreover data from the<br />
DC Current Transformer (DCCT) was analyzed to obtain<br />
the amount of beam loss.<br />
The measurements were performed with the given beam<br />
parameters 250 ms after ramp start just before reaching flattop.<br />
As the measurement system is considered to display<br />
the tune with a ms time resolution work during complete<br />
acceleration, all beam losses introduced by the beam excitation<br />
during acceleration are included. The tune value is<br />
obtained from SIS18 section 5 turn-by-turn position data by<br />
Fourier Transformation. The Signal/Noise ratio presented<br />
in Fig. 1 is calculated by integrating the tune peak in the<br />
Fourier amplitude spectrum divided by the corresponding<br />
part of spectrum of equal width outside the resonance. For<br />
each data point in Fig. 1(top) 26 spectra were averaged and<br />
their fluctuations are represented in the error bars. For the<br />
DCCT data an average of 100 measurements is taken. The<br />
beam width is determined from transverse profiles recorded<br />
by the IPM using an average over 60 measurements.<br />
It was observed that a S/N ratio of about 3 is enough to<br />
achieve stable measurements, meaning that the evolution of<br />
tune can be reconstructed each 512 turns all along the ramp.<br />
For this S/N an Exciter Power of about 2 W is needed. On<br />
the other hand no significant beam loss exceeding 2 % was<br />
observed for excitation levels up to 10 W. An alteration in<br />
beam profile was measured exceeding 8.5 W. A working<br />
area providing sufficient signal strength for tune determination<br />
and low transverse emittance enlargement thus could<br />
be defined between 2-8.5 W of Exciter Power. The results<br />
may be scaled (dep. on Z, A, E) for other ion species and<br />
energy ranges.<br />
136<br />
Figure 1: The influence of beam excitation using band limited<br />
noise is shown using BPM (upper part), DCCT (middle) and IPM<br />
data (lower part). For measurement parameters see text.<br />
References<br />
[1] U. Rauch et al, “Baseband Tune Measurements at <strong>GSI</strong> SIS-18<br />
using Direct Digitized BPM signals”, Proc. DIPAC’09, Basel,<br />
Switzerland<br />
[2] K. Blasche et al,“SIS Status Report”, <strong>GSI</strong> Scientific Report<br />
2000, p.184<br />
[3] U. Rauch, et al, “Base-Band Tune Measurements at SIS-18<br />
using Direct Digitized BPM signals”, <strong>GSI</strong> Scientific Report<br />
2008, p.122<br />
[4] U. Rauch et al, “Investigations on BaseBand Tune Measurements<br />
using Direct Digitized BPM Signals”, Proc. of 5th<br />
CARE-HHH-ABI Workshop, Chamonix, Dec. 2007, p.58<br />
[5] T. Giacomini et al,“Development of Residual Gas Profile<br />
Monitors at <strong>GSI</strong>”, Proc. of 11th Beam Instrumentation Workshop<br />
BIW’04, Knoxville, USA


![GS I -P-]-17 - GSI Helmholtzzentrum für Schwerionenforschung](https://img.yumpu.com/20698964/1/184x260/gs-i-p-17-gsi-helmholtzzentrum-fur-schwerionenforschung.jpg?quality=85)