download block - GSI Helmholtzzentrum für Schwerionenforschung
download block - GSI Helmholtzzentrum für Schwerionenforschung
download block - GSI Helmholtzzentrum für Schwerionenforschung

You also want an ePaper? Increase the reach of your titles
YUMPU automatically turns print PDFs into web optimized ePapers that Google loves.
<strong>GSI</strong> SCIENTIFIC REPORT 2009 <strong>GSI</strong>-ACCELERATORS-01<br />
This report describes the operation statistics of the <strong>GSI</strong><br />
accelerator facility in the year 2009. The presented information<br />
is based on the data of the <strong>GSI</strong> electronic operation<br />
logbook OLOG [1] which allows for a detailed<br />
evaluation of operation statistics especially for the timesharing<br />
operation mode of the accelerators.<br />
General Overview<br />
From January till October 2009 four beam time <strong>block</strong>s<br />
were scheduled, the third one exclusively for UNILAC<br />
experiments. In total, the SIS has been operated for<br />
4512 hours and the UNILAC for 5968 hours, which split<br />
into 5704 hours for experimental beam time and<br />
264 hours for the commissioning of the accelerator after<br />
shutdown.<br />
The first long shutdown period (in parallel to the<br />
UNILAC operation) lasted from April 27 th till July 29 th .<br />
Within this time the upgrade of the SIS vacuum system<br />
was started. Furthermore the RFQ section of the High<br />
Current Injector was upgraded. The other longer shutdown<br />
started on October 24 th . It was used to continue the<br />
SIS upgrade program and to restore the damaged drift<br />
tube of the Alvarez III cavity. Due to the extensive shutdown<br />
measures about 250 hours less operation time have<br />
been scheduled compared to 2008.<br />
Table 1: Overall beam time of the accelerator facility<br />
Integral target time for<br />
all experiments<br />
Accelerator Operation Report<br />
W. Bayer, U. Scheeler, P. Schuett, D. Wilms<br />
<strong>GSI</strong>, Darmstadt, Germany<br />
2009 2008<br />
9201h 10123 h<br />
Time for retuning 56 h 98 h<br />
Time of interruption 2720h 2312 h<br />
Total beam time 11978 h 12533 h<br />
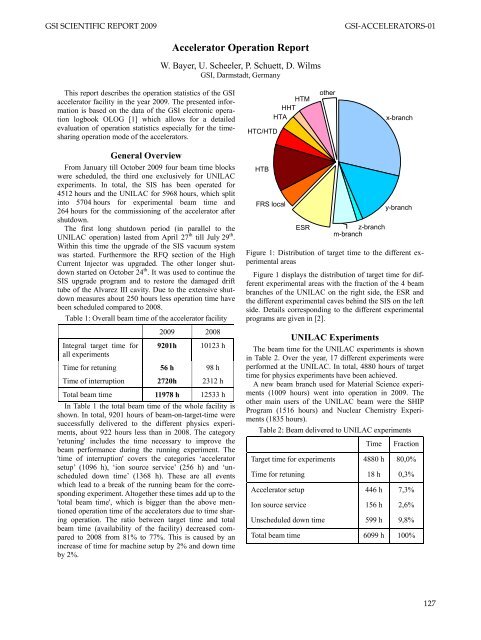
In Table 1 the total beam time of the whole facility is<br />
shown. In total, 9201 hours of beam-on-target-time were<br />
successfully delivered to the different physics experiments,<br />
about 922 hours less than in 2008. The category<br />
'retuning' includes the time necessary to improve the<br />
beam performance during the running experiment. The<br />
'time of interruption' covers the categories ‘accelerator<br />
setup’ (1096 h), ‘ion source service’ (256 h) and ‘unscheduled<br />
down time’ (1368 h). These are all events<br />
which lead to a break of the running beam for the corresponding<br />
experiment. Altogether these times add up to the<br />
'total beam time', which is bigger than the above mentioned<br />
operation time of the accelerators due to time sharing<br />
operation. The ratio between target time and total<br />
beam time (availability of the facility) decreased compared<br />
to 2008 from 81% to 77%. This is caused by an<br />
increase of time for machine setup by 2% and down time<br />
by 2%.<br />
HTC/HTD<br />
HTB<br />
FRS local<br />
HTM<br />
HHT<br />
HTA<br />
ESR<br />
other<br />
z-branch<br />
m-branch<br />
x-branch<br />
y-branch<br />
Figure 1: Distribution of target time to the different experimental<br />
areas<br />
Figure 1 displays the distribution of target time for different<br />
experimental areas with the fraction of the 4 beam<br />
branches of the UNILAC on the right side, the ESR and<br />
the different experimental caves behind the SIS on the left<br />
side. Details corresponding to the different experimental<br />
programs are given in [2].<br />
UNILAC Experiments<br />
The beam time for the UNILAC experiments is shown<br />
in Table 2. Over the year, 17 different experiments were<br />
performed at the UNILAC. In total, 4880 hours of target<br />
time for physics experiments have been achieved.<br />
A new beam branch used for Material Science experiments<br />
(1009 hours) went into operation in 2009. The<br />
other main users of the UNILAC beam were the SHIP<br />
Program (1516 hours) and Nuclear Chemistry Experiments<br />
(1835 hours).<br />
Table 2: Beam delivered to UNILAC experiments<br />
Time Fraction<br />
Target time for experiments 4880 h 80,0%<br />
Time for retuning 18 h 0,3%<br />
Accelerator setup 446 h 7,3%<br />
Ion source service 156 h 2,6%<br />
Unscheduled down time 599 h 9,8%<br />
Total beam time 6099 h 100%<br />
127
<strong>GSI</strong>-ACCELERATORS-01 <strong>GSI</strong> SCIENTIFIC REPORT 2009<br />
128<br />
SIS Experiments<br />
The heavy ion synchrotron delivered beams to 26 fixed<br />
target experiments and to 7 experiments at the ESR. In<br />
total 4321 hours of target time have been achieved. The<br />
summary is given in Table 3.<br />
In 2009 the main SIS user was FOPI. About 1250 hours<br />
of beam time were delivered to this experiment. The target<br />
time for ESR (direct beam and beam via FRS) increased<br />
to 1097 hours. For about 482 hours beam was<br />
delivered to the FRS.<br />
Table 3: Beam delivered to SIS/ESR experiments<br />
Time Ratio<br />
Target time for experiments 4321 h 73,5%<br />
Time for retuning 39 h 0,7%<br />
Accelerator setup 650 h 11,1%<br />
Ion source service 100 h 1,7%<br />
Unscheduled down time 769 h 13,1%<br />
Total beam time 5879 h 100%<br />
Accelerator operation<br />
Figure 2 shows the total beam time for all accelerated<br />
isotopes during 2009. Over the year 18 different isotopes<br />
have been accelerated. The rare isotopes ( 6 Li, 7 Li, 34 S,<br />
48 Ca, 54 Cr) were produced by the ECR ion source, which<br />
has been operated for 4757 h. Besides Li these beams<br />
were mainly provided to UNILAC experiments. The Penning<br />
ion source was mainly used for 96 Ru, 58 Ni and 197 Au<br />
(in total 2632 hours of operation). The high-current ion<br />
source operation lasted for 2725 hours. Especially 40 Ar<br />
and proton beams were delivered from the MUCIS ion<br />
source. 238 U was accelerated from the MEVVA ion source<br />
for 533 hours.<br />
Table 4: Statistics of all unscheduled down time events<br />
Down<br />
time<br />
No. of<br />
events<br />
Power supplies 339 h 303<br />
Vacuum and structures 159 h 111<br />
Beam diagnostics 34 h 31<br />
Operation 37 h 37<br />
Safety-/ Interlock system 177 h 59<br />
Ion Sources 103 h 71<br />
RF system 287 h 465<br />
Controls 94 h 58<br />
Infrastructure 69 h 27<br />
Others / 55 h 51<br />
Total of unscheduled<br />
down time<br />
1354 h 1189<br />
In Table 4 all unscheduled down time events are shown<br />
in more detail. Compared to 2008 about 200 hours less of<br />
down time events were recorded due to a decrease of<br />
breakdowns of power supplies and ion sources.<br />
An earth leak of the main feed-in of the SIS power supplies<br />
caused a break of two days for SIS operation. The<br />
renewed control of the radiation safety system of<br />
SIS/ESR caused a lot of interruption in the first <strong>block</strong>.<br />
This system was upgraded and runs very reliably meanwhile.<br />
During commissioning for the forth <strong>block</strong> the<br />
breakdown of one drift tube cooling threatened a stop of<br />
the operation. However, a special mode of low duty cycle<br />
operation was tested successfully. This mode allowed<br />
standard beam conditions for SIS injection and the operation<br />
could be continued. For the UNILAC experiments<br />
with energies above 5.9MeV/u the duty cycle needed to<br />
be restricted. The drift tube was replaced during the subsequent<br />
shutdown.<br />
isotopes<br />
1H<br />
6Li<br />
7Li<br />
12C<br />
34S<br />
40Ar<br />
48Ca<br />
54Cr<br />
56Fe<br />
58Ni<br />
96Ru<br />
122Sn<br />
124Sn<br />
129Xe<br />
136XE<br />
181Ta<br />
197Au<br />
238U<br />
0 500 1000 1500 2000 2500<br />
operation (h)<br />
Figure 2: Total beam time for the different ion species<br />
For accelerator experiments at the UNILAC 144 hours,<br />
at SIS 301 hours, and at ESR 95 hours beam were delivered,<br />
which is for SIS an increase by a factor of three<br />
compared to last year.<br />
References<br />
[1] OLOG <strong>GSI</strong> operation logbook<br />
[2] Report of beam time coordinator, this report
<strong>GSI</strong> SCIENTIFIC REPORT 2009 <strong>GSI</strong>-ACCELERATORS-02<br />
Ion Source Development and Operation<br />
P. Spädtke, B. Gutermuth, F. Heymach, R. Hollinger, R. Lang, J. Mäder, F. Maimone, K. Ochs,<br />
J. Roßbach, P. Schäffer, S. Schäffer, M. Stork, K. Tinschert, and C. Vierheller<br />
ECR Ion Sources<br />
Regular operation of the ECR ion source (ECRIS) at the<br />
High Charge State Injector (HLI) was performed for the ion<br />
species listed in the table below:<br />
Table 1: Ion beams delivered from the HLI in 2009.<br />
Ion Auxiliary Duration Analyzed intensity<br />
species gas (days) (eµA)<br />
1 H 1+<br />
2 — 5 150<br />
6 Li 1+ He 16 30<br />
7 Li 1+ He 7 20<br />
12 C 2+ O2 26 60<br />
34 S 6+ O2 27 170<br />
48 Ca 10+ He 85 100<br />
54 Cr 8+ He 14 60<br />
122 Sn 17+ O2 2 15<br />
124 Sn 17+ O2 8 15<br />
129 Xe 17+ O2 13 20<br />
Besides 1 H 1+<br />
2 , 7 Li 1+ and 12 C 2+ , respectively, all ion<br />
species were produced from highly enriched isotopic<br />
materials.<br />
12 2+ C was provided for machine experiments and for<br />
biophysics experiments at the SIS, while a 129Xe17+ ion<br />
beam was delivered for various experiments on materials<br />
research. A proton beam was generated from the 1H 1+<br />
2<br />
beam by stripping in the transfer channel in front of the<br />
SIS and was used to prepare a future high current proton<br />
experiment behind the SIS.<br />
More than 62 % of the beam time in 2009 delivered from<br />
the ECRIS at the HLI was dedicated to the research on Super<br />
Heavy Elements (SHE). For 48 Ca 10+ and for 54 Cr 8+<br />
this was performed according to the standard procedure<br />
of evaporation of the pure metals from the ECR standard<br />
oven. Applying the same procedure as for a 36 S 5+ ion<br />
beam in 2008 [1] a beam of 34 S 6+ ions was produced from<br />
34 SO2 sample material with an enrichment of 99 % providing<br />
highest efficiency of beam production which was delivered<br />
for experiments on SHE.<br />
Beams of the Sn isotopes 122 Sn and 124 Sn, respectively,<br />
were delivered for short periods to experiments behind the<br />
UNILAC.<br />
<strong>GSI</strong>, Darmstadt, Germany<br />
An ion beam of 6 Li 1+ was produced from enriched LiF<br />
sample material for an experiment on nuclear spectroscopy<br />
at the SIS, while an ion beam of 7 Li 1+ was produced<br />
from natural LiF and was delivered to an experiment at<br />
the ESR working on an experimental test of time dilatation.<br />
In parallel to most of the regular beam time periods for<br />
the different ion species measurements of the radiation<br />
level of neutrons and gamma rays were performed behind<br />
the IH LINAC at the HLI where the ion beam velocities<br />
are at 1.4 MeV/amu [2].<br />
In the frame of the HLI upgrade programme in a first<br />
step the old RFQ tank was removed completely in order to<br />
investigate the ion beam properties at the entrance of the<br />
RFQ structure. During the shut down period at the end of<br />
the year a dedicated experimental analysis of the ion beam<br />
at this location was performed. Ar beams of various charge<br />
states were used as this guarantees a very stable ion beam.<br />
According to the RFQ upgrade schedule first the new RFQ<br />
tank will be installed including a four–rod structure for an<br />
ion input velocity of 2.5 keV/amu. Later on it is intended<br />
to replace the rod structure by a new one for an ion input<br />
velocity of 4.0 keV/amu which will be suitable for a superconducting<br />
ECR ion source. Therefore Ar q+ ion beams<br />
(q = 5, 7, 8, 9, 11) at ion beam velocities of 2.5 keV/amu and<br />
4.0 keV/amu, respectively, were investigated.<br />
For beam characterization standard measurements of the<br />
emittance in vertical and in horizontal direction were performed<br />
using a slit–grid device [3]. In addition two–<br />
dimensional images of the beam profile were recorded using<br />
viewing targets as described in [4]. These investigations<br />
confirm that the internal complex structure of the ion<br />
beam from an ECRIS which was observed along the low<br />
enegy transport line (LEBT) up to the analyzing plane of<br />
the dipole magnet in previous experiments at the ECR Injector<br />
Setup (EIS) [4] is further transported to the location<br />
of the RFQ entrance. Furthermore it could be demonstrated<br />
that the two–dimensional profile of the beam is influenced<br />
by the respective settings of ECRIS and LEBT as well as it<br />
is depending on the respective charge state (see Figure 1).<br />
More detailed analysis of the data is in progress.<br />
At the EIS the work on an adaptation of the mechanical<br />
support system in order to handle both, <strong>GSI</strong>’s conventional<br />
ECRIS CAPRICE as well as the superconducting MSE-<br />
CRIS [5] was completed. All measures to improve the<br />
cooling of the beam line as well as for the vacuum chamber<br />
of the dipole spectrometer were finished. Finally the<br />
reinstallation of the CAPRICE ECRIS was accomplished<br />
129
<strong>GSI</strong>-ACCELERATORS-02 <strong>GSI</strong> SCIENTIFIC REPORT 2009<br />
130<br />
Figure 1: Two–dimensional ion beam profiles of Ar 8+ ion<br />
beams at the location of the RFQ entrance for different settings<br />
of the LEBT.<br />
and the instrumentation, the infrastructure and the controls<br />
of the test bench were functional in late 2009.<br />
In order to establish a standard procedure for the production<br />
of 50 Ti beams from highly enriched materials a test series<br />
was started at the EIS to investigate different types of<br />
evaporation ovens.<br />
High Current IS and Penning IS<br />
The PIG source has been used for regular operation of<br />
the accelerator. No specific development was necessary to<br />
satisfy the beam time requirements.<br />
Table 2: Ion beams delivered from the PIG Injector in 2009.<br />
Ion Auxiliary Duration Analyzed intensity<br />
species gas (days) (eµA)<br />
40 Ar +,2+ - 16 150 ... 400<br />
56 Fe 3+ Ar 3 150<br />
58 Ni 2+,3+ Ar 13 10 ... 100<br />
96 Ru 2+ Ar 22 25<br />
136 Xe 3+ - 8 90<br />
197 Au 8+ Ar 12 250<br />
238 U 4+,10+ Ar, Xe 25 10 ... 100<br />
For the planned Li-experiment the PIG source has been<br />
tested with a specific alloy as sputter electrode which<br />
provided good experience in earlier times with an axial<br />
PIG ion source. The used PIG at <strong>GSI</strong> however has a<br />
radial extraction, which is a substantially different plasma<br />
confinement. At the test bench for the PIG source we<br />
could demonstrate a high fraction of Lithium in the beam,<br />
comparing the ratio of mass 14 N 1+ and mass 7 (N 2+<br />
and Li 1+ ). Whether meta-stable ions are in the beam at<br />
all or what the percentage of meta-stable ions in the beam<br />
is could not determined due to missing diagnostic elements.<br />
The new MUCIS has been set into operation very successfully<br />
for a long period Ar beam time. With this ion<br />
source, designed in 2008 it was possible to increase the<br />
extractable ion current by 10% at even lower arc power,<br />
which indicates a better plasma confinement. Main differences<br />
to the existing version of this source is an enlarged<br />
discharge chamber, a coaxial cathode holder, and an improved<br />
magnetic flux distribution. The higher efficiency of<br />
the ion source results in a longer life time of the filaments.<br />
Table 3: Ion beams delivered from the High Current Injector<br />
in 2009.<br />
Ion Auxiliary Duration analyzed intensity<br />
species gas (days) (emA)<br />
1 H + 3 - 23 0.5<br />
40 Ar + - 24 20<br />
181 Ta 3+ Ar 9 11<br />
238 U 4+ - 36 15<br />
To increase the intensity for very light ions, molecules<br />
can be extracted instead of the desired element in atomic<br />
form. This increases the available extraction voltage,<br />
and as long the particle density within the plasma is<br />
high enough, the extracted current will increase according<br />
Child’s law. At the gas stripper the molecule will brake<br />
apart and all residual electrons will be removed, which<br />
triples the intensity for H and D when 1 H + 3<br />
, respectively<br />
2 D + 3 is extracted from the source.<br />
The high current uranium beam time of September and<br />
October was very successful from the ion source point of<br />
view. The maximum analyzed beam intensity was 20 emA<br />
for 238 U 4+ before entering the rf-accelerator with a repetition<br />
rate of 1 Hz and 1 ms pulse length.<br />
The new ion source service station for radioactive elements<br />
has been taken into operation. Service of ion sources<br />
is now made within a glove box to avoid any contamination<br />
of service personal with radioactive isotopes. Ion source<br />
replacements (Mevva, Varis, PIG) have been done without<br />
any failure.<br />
References<br />
[1] K. Tinschert, R. Lang, J. Mäder, J. Roßbach, P. Spädtke,<br />
A. Yakushev, Proc. 18 th Int. Workshop on ECR Ion Sources,<br />
Chicago, 2008, 92<br />
[2] M. Wengenroth, F. Becker, G. Fehrenbacher, Ch. Pöppe,<br />
K. Tinschert, R. Becker, this report<br />
[3] W. Barth et al., this report<br />
[4] P. Spädtke, R. Lang, J. Mäder, J. Roßbach, K. Tinschert, Proc.<br />
18 th Int. Workshop on ECR Ion Sources, Chicago, 2008, 194<br />
[5] K. Tinschert et al., <strong>GSI</strong> Report 2008-1, 85
<strong>GSI</strong> SCIENTIFIC REPORT 2009 <strong>GSI</strong>-ACCELERATORS-03<br />
The role of the electromagnetic field on the ECRIS beam production<br />
F. Maimone, R. Lang, J. Mäder, J. Roßbach, P. Spädtke, K. Tinschert<br />
In order to increase the beam intensity on the target it is<br />
mandatory to better understand the plasma generation, the<br />
beam extraction and the beam transport. It is well known<br />
that the plasma properties and the beam creation are<br />
modified by the microwave frequency and power. In this<br />
report we investigated how the ions beam generation in an<br />
ECR ion source is affected by the electromagnetic field<br />
excited inside the plasma chamber. For this purpose simulations<br />
and related experiments have been performed with<br />
the CAPRICE ECRIS [1].The injection flange of the ion<br />
source consists of a copper matching box where the<br />
WR62 waveguide line connects the Klystron generator<br />
and the source. The electromagnetic wave is transmitted<br />
into the plasma chamber through a coaxial line. In order<br />
to realize an impedance matching inside the copper box a<br />
movable plunger is present. This structure modification<br />
determines a volume change which affects the electromagnetic<br />
field inside the matching cube and inside the<br />
plasma chamber. This effect has been simulated with CST<br />
Microwave Studio [2]. A horizontal cut view of the<br />
matching box and of the plasma chamber together with<br />
the electric field excited inside is shown in figure 1. The<br />
hole and the shape of the plasma electrode have not been<br />
taken into account and a closed cylindrical plasma chamber<br />
filled with a medium with electric permittivity ��r<br />
r<br />
(�r=1) (�r=1) has been considered in the simulation. In the upper<br />
figure the plunger of 46 mm diameter located in the upper<br />
wall is moved 3.5 mm outside of the inner wall, in the<br />
middle and in the lower figures it is moved 0.5 mm and<br />
4.5 mm inside, respectively.<br />
Figure 1: Electric field amplitude for three different<br />
matching box settings.<br />
The electromagnetic field distribution excited inside the<br />
plasma chamber completely changes. The same effect is<br />
expected when the chamber is filled by a homogeneous<br />
isotropic plasma. In order to analyze the effect of the field<br />
modification, when the matching box structure changes,<br />
on the plasma properties and then on the particle beam<br />
production, a beam viewer has been installed in the low<br />
energy beam transport line (LEBT) of the high charge<br />
state injector (HLI) behind the solenoid UN4M01 focus-<br />
<strong>GSI</strong>Template2007<br />
<strong>GSI</strong>, Darmstadt, Germany.<br />
ing the selected charge state [3]. The experimental setup<br />
and the instrument characteristics are described in [4].<br />
Using a 40 Ar 5+ beam, the microwave power has been varied<br />
and the position of the matching plunger has been<br />
changed. For both cases the charge state distribution<br />
(CSD) and the beam shape have been analyzed. Since no<br />
significant variations on the CSD have been detected<br />
when varying the microwave power in a small range of<br />
values, the position of the matching piston has been adjusted<br />
of around 1 mm. The analysis of the CSD shows<br />
that its maximum shifted from 40 Ar 8+ to 40 Ar 5+ and the<br />
beam current of 40 Ar 5+ increased by 7.4% without changing<br />
the forward power (� 60 W). The 40 Ar 5+ beam shapes<br />
recorded on the viewing target are shown in figure 2.<br />
Since the beam shape presents evident variations, the<br />
beam emittance will change. The results of the simulations<br />
and of the measurements carried out with the viewing<br />
targets at the HLI revealed how the ERCIS performances<br />
are affected by the different electromagnetic field<br />
patterns excited inside the plasma chamber due to a different<br />
matching. It has to be pointed out that the analysis<br />
was carried out by keeping constant the microwave frequency<br />
at 14.5 GHz in the simulator setting parameters<br />
and during the experiment. If the microwave frequency is<br />
varying, different modes can be excited inside the plasma<br />
chamber and several simulations in the 14-15 GHz frequency<br />
range have been also carried out. The effect of a<br />
microwave frequency change in a narrow range on the<br />
source performances in terms of beam current and beam<br />
shape has been analyzed in the ECR Injector Setup (EIS)<br />
[5] test bench in 2007 [6]. Further investigations covering<br />
a wider frequency range are planned using improved diagnostics.<br />
Figure 2: 40 Ar 5+ -beam on the viewing target (left: initial<br />
plunger position; right: optimized plunger position).<br />
References<br />
[1] D. Hitz et al., Proc. 11th Int. Workshop on ECRIS,<br />
Groningen 1993, KVI-Report 996 (1993) 91<br />
[2] Computer code CST Microwave Studio, Computer<br />
Simulation Technology, Darmstadt, Germany<br />
[3] H. Schulte et al., Rev. Sci. Instrum. 63 (1992) 2883<br />
[4] J. Mäder et al.: <strong>GSI</strong> Report, August 2009<br />
[5] K. Tinschert et al., Rev. Sci. Instrum. 69 (1998) 709<br />
[6] L. Celona et al.: Rev. Sci. Instrum.,79, 2008<br />
131
<strong>GSI</strong>-ACCELERATORS-04 <strong>GSI</strong> SCIENTIFIC REPORT 2009<br />
UNILAC Status and Developments<br />
W. Barth, L. Dahl, P. Gerhard, L. Groening, M. Maier, S. Mickat, M.S. Kaiser, H. Vormann,<br />
S. Yaramishev, <strong>GSI</strong>, Darmstadt, Germany<br />
.<br />
Status of Operation<br />
For further biology experiments under therapy conditions<br />
a carbon beam from the Electron Cyclotron Resonance<br />
(ECR) ion source was accelerated via the high charge<br />
state injector (HLI) in the UNILAC for the SIS-injection<br />
(2 weeks) [1]. Additionally UNILAC experiments used<br />
the beam from the HLI with a duty factor of up to 30 %.<br />
Furthermore the ECR source was in operation for the production<br />
of various isotopes (3H, 6 Li, 7 Li, 34 S, 48 Ca, 54 Cr,<br />
122 Sn, 124 Sn, 136 Xe) as well. During a four weeks <strong>block</strong><br />
with sulphur beam and a two weeks <strong>block</strong> of chromium<br />
beam at the beginning of 2009 experiments for the Super<br />
Heavy Element synthesis (SHE) were supplied. Besides<br />
48 Ca was used for two weeks at the SHIPTRAP. Dominantly<br />
during two long runs of six weeks 48 Ca-beam could<br />
be delivered to the TASCA-Separator for chemistry experiments.<br />
Additionally ion beams with different Zinc<br />
isotopes were used for the UNILAC-experiment X7 at<br />
low beam energy. The ECR-beam (3H, 6 Li, 7 Li) was also<br />
injected into the SIS 18 for high energy fixed target experiments<br />
as well as for ESR-experiments. The Penning<br />
(PIG) ion source provided 40 Ar, 56 Fe, 58 Ni, 96 Ru, 136 Xe,<br />
197 Au and 238 U beams with medium intensity, especially<br />
for high duty factor experiments with heavy ions at<br />
UNILAC-beam energies. Mainly the heavy ions were<br />
delivered especially for the material research experiments<br />
at the new M-branch and at X0. Light ions as well as<br />
heavy ions from the PIG were accelerated via High Current<br />
Injector (HSI) in the UNILAC with short pulses for<br />
the SIS 18. The MUlti Cusp Ion Source (MUCIS) provided<br />
beams for different high-energy experiments with<br />
high intensities (H2, 40 Ar). The Metal Vapour Vacuum<br />
Arc (MEVVA) ion source delivered 181 Ta and 238 U beams<br />
for SIS-injection. After a long time of absence the<br />
UNILAC was in operation for five weeks for uranium<br />
machine studies as well as for a week <strong>block</strong> of regular<br />
uranium beam experiments. Heavy ion machine experiments<br />
in preparation for the UNILAC as an injector for<br />
FAIR were performed additionally with tantalum (medium<br />
intensity) and high current argon beams.<br />
Shutdown Working<br />
During shutdown time new power supplies for the Alvarez<br />
2a, 2b, 3 and 4 inner tank quadrupoles were installed,<br />
enabling stronger beam focussing in the whole poststripper<br />
section. The Alvarez tank revision program starting in<br />
the winter shutdown 08/09 was finished for tank no. 1.<br />
Furthermore an advanced chemical rinsing procedure was<br />
successfully tested and applied for the cooling system of<br />
the drift tubes and tank mantle of ALVAREZ 1 and 2, due<br />
to a critical occlusions with ferric oxide particles. The<br />
132<br />
chemical rinsing will be extended to the other tanks in the<br />
next years. The defective cooling resulted in a overheating<br />
of one A3-drift tube and its quadrupole. Accordingly<br />
after a long time of beam operation with limited duty factor<br />
and reduced focussing strength, a new drift tube was<br />
successfully installed in the wintershutdown 09/10. Design<br />
and fabrication of the drift tube and the quadrupole<br />
was completely accomplished in the <strong>GSI</strong>-workshops. Additionally<br />
another three defective tank quads inside AL-<br />
VAREZ were detected. An advanced repair program is<br />
already scheduled. But for all that the UNILAC operated<br />
with high reliability. [1]<br />
UNILAC-Upgrade Measures<br />
Fig. 1: The new RFQ for the HLI (left) and the HSI-RFQ<br />
with newly installed electrodes (right).<br />
Different UNILAC-upgrade projects were planned and<br />
accomplished in essence:<br />
- HSI-RFQ-Upgrade for FAIR [2]<br />
- Preparation of the HSI-LEBT-Upgrade for FAIR [2]<br />
- Beam investigations at the High Current Test Bench<br />
with a sc-solenoid<br />
- High Current beam diagnostics for the FAIR-UNILAC-<br />
Upgrade: Mounting of additional BIF-stations in the<br />
UNILAC and the transfer line to the SIS18<br />
- Commissioning of a 8 kW-rf-amplifier prototype and<br />
the first delivery of the batch fabrication<br />
- HLI-RFQ-Upgrade [3]<br />
Machine Experiments<br />
11 days of machine experiments were performed with an<br />
high current argon beam mainly for commissioning of the<br />
upgraded HSI-RFQ. Two days with a tantalium beam and<br />
one days with uranium beam were accomplished for recommissioning<br />
of the UNILAC with low charged heavy<br />
ion beams from the MeVVa-ion source. Finally in december<br />
the ECR ion source delivered argon beam for one<br />
week of experiments in the HLI-LEBT in preparation of<br />
the HLI-RFQ-upgrade [3].<br />
References<br />
[1] U. Scheeler et. al., Accelerator Operation Report, (this report)<br />
[2] H. Vormann, et. al., HSI Frontend-Upgrade, (this report)<br />
[3] P. Gerhard, et. al., Status of the HLI-RFQ-Upgrade (this report)
<strong>GSI</strong> SCIENTIFIC REPORT 2009 <strong>GSI</strong>-ACCELERATORS-05<br />
<strong>GSI</strong>Template2007<br />
Annual neutron doses in the UNILAC experimental hall<br />
Introduction<br />
<strong>GSI</strong> has the obligation to verify that the accelerator operation<br />
is in compliance with the radiation protection ordinance<br />
and that the conditions given in the permissions<br />
of the authority (HMUELV) are fulfilled. For this purpose,<br />
dose measurements must be performed. From these<br />
dose measurements the annual dose values are derived for<br />
various radiological areas at the UNILAC and the experimental<br />
hall. The assumed definition of the different<br />
kind of radilogical areas (controlled, area, survey area and<br />
free accessible areas) must be checked or – if neccessary<br />
– conformed.<br />
Method of measurement<br />
The overall dose values outside the shielding of the accelerators<br />
and experimental areas consist in most cases of<br />
neutron and photon radiation.<br />
The <strong>GSI</strong>'s Safety and Radiation Protection division provided<br />
thermoluminescence detectors (TLD, type 6776) for<br />
the dose measurements. The TLD cards consists of two<br />
6 LiF (sensitive for n- and γ -radiation) and two 7 LiF (sensitive<br />
for γ-radiation but not for n-radiation) elements and<br />
were mounted in moderator spheres (diameter: 30 cm)<br />
made from polyethylene (PE). The TLDs are sensitive to<br />
neutrons with energies from the thermal range up to the<br />
highest energies. The advantage of this system is that the<br />
dose reading is independent on the spill structure of the<br />
beam, i.e. there are no dead time effects etc. in contrary to<br />
the active systems.<br />
Figure 1: Measurement positions of the neutron doses in<br />
the UNILAC experimental hall.<br />
Annual doses in 2008 and 2009<br />
Figure 1 shows the downstream part of the UNILAC,<br />
a part of the TK and the experimental areas with the posi-<br />
Ch. Pöppe 1 , G.. Fehrenbacher 1<br />
1 <strong>GSI</strong>, Darmstadt, Germany<br />
tions of the neutron detectors. The detectors are placed on<br />
the roof of the caves.<br />
It can be seen (Tab. 1) that the dose values 2008 are in the<br />
range of 0.01 mSv/a up to 7 mSv/a. The largest dose values<br />
are measured at X1, X0 and Y7. All these locations<br />
are not accessible during experiment operation. In case of<br />
X1 it is sometimes necessary that the area around the cave<br />
must be declared as a temporarily controlled area because<br />
the dose rates are higher than 3 µSv/h (threshold dose rate<br />
value for the definition of controlled areas).<br />
In 2009 the range of the values reach from 0.07 up to 0.71<br />
mSv/a. In comparison to the annual values of 2008 the<br />
dose values are generally lower, on average by a factor of<br />
1.4 if the dose values at X1 are not taken into account. At<br />
the area X7 experiments are carried out with ion beams<br />
which have energies below the nominal Coulomb threshold<br />
energy. During recent experiment periods it turned out<br />
that during the preparatory beam operation for the experiment<br />
substantial dose rates can occur (use of illumination<br />
targets etc.). Therefore additional shielding measures<br />
will be installed in the year 2010.<br />
In 2010 an elaborate dose survey program is planned for<br />
both the assessment of the annual exposure using the<br />
TLD's as well as detection of the peak dose rates focused<br />
on the areas X1, X7, X8 and Y7 with rem counters.<br />
Table 1: Measured Neutron doses in the UNILAC experimental<br />
hall outside the shielding, the positions are<br />
shown in Fig. 1<br />
Neutron - Dose<br />
H*(10) [mSv]<br />
Position Area 2008 2009<br />
1 end of UNILAC 0.19 0.12<br />
2 end of UNILAC 0.15 0.16<br />
3 end of UNILAC 0.30 0.21<br />
4 TK 0.01 0.15<br />
5 TK 0.01 0.15<br />
6 TK 0.01 0.09<br />
7 X 1 7.00 0.12<br />
8 X 2,3 0.37 0.12<br />
9 X 4 0.29 0.22<br />
10 X 6 0.35 0.28<br />
11 X 8 0.52 0.71<br />
12 X 0 1.44 0.38<br />
13 Y 7 1.25 0.41<br />
14 M 1 - 0.08<br />
15 M 3 - 0.07<br />
References<br />
[1] T. Radon, G. Fehrenbacher,, Ch. Pöppe, J. Sauer, and<br />
M. Wengenroth, <strong>GSI</strong> annual report 2008<br />
133
<strong>GSI</strong>-ACCELERATORS-06 <strong>GSI</strong> SCIENTIFIC REPORT 2009<br />
SIS18 Status Report<br />
P. Spiller, R. Balss, O. Boine-Frankenheim, U. Blell, Y. El-Hayek, H. Eickhoff, G. Franchetti, P. Hülsmann,<br />
M. Kirk, H. Klingbeil, H.G. König, H. Kollmus, U. Laier, C. Mühle, A. Parfenova, D. Ondreka,<br />
H. Ramakers, H. Reich-Sprenger, M. Schwickert, J. Stadlmann, H. Welker<br />
INTRODUCTION<br />
Beside the main upgrade program dedicated to the acceleration<br />
of low charge state heavy ions for FAIR [1], several measures<br />
have been initiated and completed which improve the<br />
beam performance for the running experimental program. The<br />
machine development program for high intensity operation and<br />
nonlinear dynamics studies has been intensified [2, 3, 4, 5].<br />
TRANSFER OF UNILAC BEAMS<br />
Low energetic (4 MeV/u) Xe-beams from the UNILAC<br />
could be transferred without acceleration through SIS18 to the<br />
ESR. By means of a slightly modified tune, setting of horizontal<br />
steerer magnets and switched-off bumper magnets, the<br />
UNILAC beam could be guided directly from the injection<br />
channel towards the extraction channel to the high energy beam<br />
transport system. SIS18 has only been used as a transport system<br />
and the UNILAC beams could be sent to the ESR [6] for<br />
potential use at the HITRAP experiment.<br />
BEAM LOSS AT MULTITURN INJECTION<br />
Depending on the emittance of the injected UNILAC beam<br />
and the actual settings of the injection devices, beam loss of the<br />
order of typically 30% is unavoidable during the transverse<br />
multi turn injection process. In order to minimize the multi turn<br />
injection losses, the scraper system in section 6 and 7 of the<br />
transfer channel may be used to cut of the tails of the injected<br />
beam. Precondition is an imaging optical system in between the<br />
scrapers and the injection septum, including three turns of revolution.<br />
Such an optical setting could be realized by means of<br />
emittance measurements with an updated MIRKO model of the<br />
beam transport and injection system. In the frame of machine<br />
experiments, it could be demonstrated that the beam intensity<br />
may be maintained in the SIS after cutting 25 % percent of the<br />
total intensity of the injected beam [7].<br />
BEAM OPTICS STUDIES<br />
The development of the Nonlinear Tune Response Matrix<br />
method (NTRM) for the reconstruction of nonlinear field errors<br />
was continued. The first attempts have been performed to reconstruct<br />
the natural sextupolar field components of the ring's<br />
main dipoles. The β-functions of the machine were systematically<br />
measured to determine the tune response of quadrupole<br />
and sextupole magnets [8]. According to the carried out measurements<br />
and simulations, the β-functions may be affected by<br />
the CO induced β-beating. The initial CO distortion in the presence<br />
of sextupoles leads to a β-beating via the feed-down of<br />
quadrupolar components. The uncontrolled β-beating, affects<br />
the nonlinear field error reconstruction and may also affect the<br />
efficiency of the multiturn injection and slow extraction. Therefore,<br />
it is important to correct the CO at the best in order to<br />
keep the β-functions symmetric. The new SISMODI closed<br />
orbit correction software was tested. However, the horizontal<br />
CO correction suffers from missing bipolar power converters.<br />
134<br />
<strong>GSI</strong> Darmstadt, Germany<br />
BUNCH COMPRESSION<br />
The first bunch compressor cavity based on magnetic alloy<br />
ring cores as inductive load has been installed in the SIS18<br />
synchrotron and commissioned with beam [9]. The new cavity<br />
provides a compression voltage of up to 40 kV in Rf pulses<br />
with a length of 500 ns. So far, one of the Fe-loaded acceleration<br />
cavities with a maximum voltage of 14 kV, has been used<br />
for compression for e.g. plasma physics experiments. Although<br />
the implementation of the new cavity in the accelerator control<br />
system was not completed, first compression experiments could<br />
be performed on the injection plateau and at final energy. The<br />
experiments at final energy were partly performed in combination<br />
with one of the Ferrit-loaded acceleration systems.<br />
BUNCH TRIMMING<br />
For a further reduction of the pulse length on the target and<br />
especially for a removal of the leading and following beam<br />
tails, the extraction kicker system may be used. This method is<br />
based on the fact that the acceptance angle of the extraction<br />
channel is a small fraction of the total kick angle. By igniting<br />
the kicker after the leading tail and shortening before the following<br />
tail, only the core of the bunch is extracted. However,<br />
the particles of the tails are dumped and distributed in the synchrotron.<br />
It could be shown, that by means of the extraction<br />
kicker trimming, the core of a compressed bunch may be cut<br />
out and pulse lengths of a few ten nanoseconds may be<br />
achieved on the target (Figure 1). See also [10].<br />
Figure 1: Intensity profiles of extracted single bunches<br />
measured with the fast transformer in TE1, without compression<br />
(long), with compression (medium) and with compression<br />
and extraction kicker trimming (short peaked).<br />
REFERENCES<br />
[1] P. Spiller et al, this annual report<br />
[2, 3, 4, 5] S. Appel, G. Franchetti, S. Sorge, this annual report<br />
[6] J. Stadlmann, internal note,<br />
www.gsi.de/beschleuniger/sis18/einstellung_steuerung.html<br />
[7] Y. El-Hayek, Masterthesis, <strong>GSI</strong> Master 2009-01 (2010)<br />
[8] A. Parfenova et. al., internal note,<br />
https://www.gsi.de/documents/DOC-2009-Nov-94-1.pdf.<br />
[9] P. Hülsmann et al, Proc. of the EPAC04, Lucerne (2005)<br />
[10] A. Tauschwitz et al, this annual report
<strong>GSI</strong> SCIENTIFIC REPORT 2009 <strong>GSI</strong>-ACCELERATORS-07<br />
A High-Speed Data Converter for Digital Control of Synchrotron RF Cavities<br />
Shahab Sanjari 1 , Martin Kumm 2 , Harald Klingbeil 1 , and Bernhard Zipfel 1<br />
Introduction<br />
In order to provide synchrotron RF cavities with proper<br />
high frequency signal, several closed-loop control systems<br />
are required. This might be achieved using analogue or<br />
digital electronics. The main advantages of a digital approach<br />
are reconfigurable modules that build up the control<br />
loop. The topology used for the digital synchronisation<br />
of the radio frequency cavities of the <strong>GSI</strong> SIS18 heavy<br />
ion synchrotron, is based on a modular concept [1]. The<br />
use of field programmable gate arrays (FPGA) facilitates<br />
high–speed data processing of different interfaces such as<br />
high–speed optical links. For these FPGA modules a still<br />
growing software component library written in VHDL language<br />
is established. The components are stored in a version<br />
control system so that multiple developers can work<br />
on the same project using a well defined network on chip<br />
architecture [2].<br />
As an extension to the digital modules, a data converter<br />
was designed in 2006 as an interface between analogue and<br />
digital world. A revision of the board then improved the<br />
signal to noise ratio with a spurious free dynamic range of<br />
at least 50 dBc [3]. The latest revision of this board utilises<br />
an Altera R○ Cyclone R○ III FPGA (Figure 1). The board<br />
includes two 14–bit analogue to digital converter channels<br />
each with a sampling rate of up to 120 MSPS, and two 14–<br />
bit digital to analogue converters each with a sampling rate<br />
of up to 210 MSPS. The sampling rates can be varied during<br />
the operation. Low pass filters, high speed operational<br />
amplifiers and 45 dB digitally controlled variable gain amplifiers<br />
are available in the signal path. Each analogue input<br />
path can be calibrated digitally by voltage reference ICs using<br />
an analogue switch. The circuit is built on a 10 layer<br />
circuit board with elaborate grounding and signal distribution.<br />
Automatic Gain Control<br />
For the beam phase measurement in the digital control<br />
loop, an automatic gain controller was developed using the<br />
converter board. The algorithm is based on an existing solution<br />
that uses a fast on–off digital controller (M. Kumm<br />
2003). The converter board showed considerable improvements<br />
in the recovery time after sudden changes in the amplitude<br />
of the input signal, so that it is now manufactured<br />
in quantity for this purpose.<br />
Other Applications<br />
The converter board is being continuously used in newly<br />
designed modules. In 2007 it was used to realise a digital<br />
1 <strong>GSI</strong>, Darmstadt, Germany; 2 University of Kassel, Germany<br />
Figure 1: The converter board, Photo: G. Otto, <strong>GSI</strong>.<br />
offset local oscillator which is now available as a serially<br />
manufactured device [4]. In 2009 a digital phase and amplitude<br />
detector was realised [5].<br />
Using various algorithms, the board can be used as a<br />
signal generator or processor. The available high speed<br />
converters allow sampling at intermediate frequency (IF)<br />
which together with appropriate signal processing algorithms<br />
make (de)modulation and filtering more accessible<br />
in digital domain [6].<br />
References<br />
[1] H. Klingbeil, B. Zipfel, M. Kumm and P. Moritz, “A digital<br />
beam-phase control system for heavy-ion synchrotrons”,<br />
IEEE Transactions on Nuclear Science, vol 54, pp 2604–<br />
2610, 2007.<br />
[2] U. Fischer, “Entwurf und Implementierung eines<br />
echtzeitfähigen Network-on-Chip <strong>für</strong> den Einsatz in<br />
zeitkritischen Regelungsaufgaben”, Diplomarbeit at Fachhochschule<br />
Fulda, Januar 2005, Fulda.<br />
[3] M. S. Sanjari, “Hardware and Software Implementation of a<br />
Radio Frequency High-Speed Data Conversion Unit for Digital<br />
Control Systems”, Bachelor Thesis at the Technische Universität<br />
Darmstadt, October 2006, Darmstadt.<br />
[4] M. Kumm, “FPGA-Realisierung eines Offset-<br />
Lokaloszillators basierend auf PLL–und DDS–<br />
Technologien”, Diplomarbeit at Technische Universität<br />
Darmstadt, July 2007, Darmstadt.<br />
[5] T. Wollmann, “Entwurf und Implementierung eines digitalen<br />
Phasen- und Amplitudendetektors <strong>für</strong> eine HF-<br />
Beschleunigerkavität”, Diplomarbeit at Technische Universität<br />
Darmstadt, September 2009, Darmstadt.<br />
[6] M. Kumm and M. S. Sanjari, “Digital Hilbert Transformers<br />
for FPGA-based Phase-Locked Loops”, International Conference<br />
on Field Programmable Logic and Applications, 2008.<br />
135
<strong>GSI</strong>-ACCELERATORS-08 <strong>GSI</strong> SCIENTIFIC REPORT 2009<br />
Beam Response on Base-Band Tune Measurement System<br />
U. Springer 1,2 , P. Forck 1 , P. Hülsmann 1,2 , P. Kowina 1 , and P. Moritz 1<br />
1 <strong>GSI</strong>, Darmstadt, Germany; 2 Goethe University, Frankfurt, Germany<br />
For high current operation of SIS18 precise control of<br />
the tune value is required. It is measured by excitation of<br />
coherent betatron oscillations and turn-by-turn position determination<br />
using a Beam Position Monitor (BPM). In order<br />
to define the working area of this Tune Measurement<br />
System using direct digitized BPM data, the influence of<br />
beam excitation on emittance must be evaluated. The beam<br />
width and beam loss were measured along with the frequency<br />
spectrum obtained out of BPM data.<br />
An example of such investigations is shown in Fig. 1 using<br />
a beam with the following conditions: 7 · 10 9 Ar 18+<br />
were accelerated from 11.4 to 300 MeV/u within 254 ms.<br />
The beam was excited using band limited noise excitation<br />
centered on expected betatron sidebands in order to actuate<br />
a coherent betatron motion [1, 2, 3]. The bandwidth was<br />
set broad enough to cover the expected range of tune variation<br />
whereas the level of excitation was altered. The BPM<br />
data are directly digitized and post-processed offline [4].<br />
To obtain the horizontal and vertical beam envelope, and<br />
thus beam emittance, the Ionization Profile Monitor (IPM)<br />
installed at SIS18 was used [1, 5]. Moreover data from the<br />
DC Current Transformer (DCCT) was analyzed to obtain<br />
the amount of beam loss.<br />
The measurements were performed with the given beam<br />
parameters 250 ms after ramp start just before reaching flattop.<br />
As the measurement system is considered to display<br />
the tune with a ms time resolution work during complete<br />
acceleration, all beam losses introduced by the beam excitation<br />
during acceleration are included. The tune value is<br />
obtained from SIS18 section 5 turn-by-turn position data by<br />
Fourier Transformation. The Signal/Noise ratio presented<br />
in Fig. 1 is calculated by integrating the tune peak in the<br />
Fourier amplitude spectrum divided by the corresponding<br />
part of spectrum of equal width outside the resonance. For<br />
each data point in Fig. 1(top) 26 spectra were averaged and<br />
their fluctuations are represented in the error bars. For the<br />
DCCT data an average of 100 measurements is taken. The<br />
beam width is determined from transverse profiles recorded<br />
by the IPM using an average over 60 measurements.<br />
It was observed that a S/N ratio of about 3 is enough to<br />
achieve stable measurements, meaning that the evolution of<br />
tune can be reconstructed each 512 turns all along the ramp.<br />
For this S/N an Exciter Power of about 2 W is needed. On<br />
the other hand no significant beam loss exceeding 2 % was<br />
observed for excitation levels up to 10 W. An alteration in<br />
beam profile was measured exceeding 8.5 W. A working<br />
area providing sufficient signal strength for tune determination<br />
and low transverse emittance enlargement thus could<br />
be defined between 2-8.5 W of Exciter Power. The results<br />
may be scaled (dep. on Z, A, E) for other ion species and<br />
energy ranges.<br />
136<br />
Figure 1: The influence of beam excitation using band limited<br />
noise is shown using BPM (upper part), DCCT (middle) and IPM<br />
data (lower part). For measurement parameters see text.<br />
References<br />
[1] U. Rauch et al, “Baseband Tune Measurements at <strong>GSI</strong> SIS-18<br />
using Direct Digitized BPM signals”, Proc. DIPAC’09, Basel,<br />
Switzerland<br />
[2] K. Blasche et al,“SIS Status Report”, <strong>GSI</strong> Scientific Report<br />
2000, p.184<br />
[3] U. Rauch, et al, “Base-Band Tune Measurements at SIS-18<br />
using Direct Digitized BPM signals”, <strong>GSI</strong> Scientific Report<br />
2008, p.122<br />
[4] U. Rauch et al, “Investigations on BaseBand Tune Measurements<br />
using Direct Digitized BPM Signals”, Proc. of 5th<br />
CARE-HHH-ABI Workshop, Chamonix, Dec. 2007, p.58<br />
[5] T. Giacomini et al,“Development of Residual Gas Profile<br />
Monitors at <strong>GSI</strong>”, Proc. of 11th Beam Instrumentation Workshop<br />
BIW’04, Knoxville, USA
<strong>GSI</strong> SCIENTIFIC REPORT 2009 <strong>GSI</strong>-ACCELERATORS-09<br />
<strong>GSI</strong>Template2007<br />
Dose Survey at SIS and following Experimental Areas<br />
T. Radon 1 , G. Fehrenbacher 1 , G. Freml 1 , Ch. Pöppe 1 , and J. Sauer 1<br />
1 <strong>GSI</strong>, Darmstadt, Germany;<br />
Introduction to <strong>GSI</strong> monitored areas<br />
The experimental halls at <strong>GSI</strong> outside the shielding of<br />
the caves and accelerators are declared as surveyed or<br />
monitored areas. These areas are to be found around controlled<br />
areas which are on <strong>GSI</strong> premises for example the<br />
experimental caves. It is obligatory to install surveyed<br />
areas if the annual dose can exceed 1mSv per year. It is<br />
mandatory to guarantee that the dose in these areas does<br />
not exceed 6 mSv per year which is at the same time the<br />
lower border of the effective dose per year for which a<br />
controlled area has to be set up.<br />
Neutron dose measurements<br />
Neutron doses provide the largest proportion of the total<br />
effective dose around the accelerator facilities and experimental<br />
areas of the high energy part of <strong>GSI</strong>. Thus the<br />
measurement of the neutron dose is the crucial part in the<br />
annual dose inspection. We focus here on the measurement<br />
of the neutron doses by a passive detection system[1]<br />
and as a complement the neutron dose has been<br />
measured by an active dosimeter [1]. The passive detector<br />
system is based on thermoluminescence which makes<br />
it a reliable tool for dose measurements even for beams<br />
with complex spill-structures. Some of the detectors of<br />
the active system belong to the interlock chain which prevents<br />
the primary or secondary beams to enter the corresponding<br />
area in case of a dose rate transgression.<br />
Measurements in 2009<br />
Figure 1 shows the SIS and the following experimental<br />
areas together with the position of the active (larger<br />
squares) and passive (smaller squares) neutron detectors.<br />
It is noticeable that the annual dose values are largest in<br />
the vicinity of the SIS extraction area, the HHD beam<br />
dump and the FRS target area. Similar to last year[2]<br />
these areas had to be declared as controlled area as the<br />
corresponding dose rate of 3 μSv/h was transgressed for<br />
certain primary beams in order to keep the annual dose<br />
limit. The dose values of the active and passive system<br />
can hardly be compared due to their different positions<br />
including different heights in the experimental halls.<br />
However both systems reliably demonstrate the higher<br />
dose values in the region mentioned before. A further increase<br />
in the primary beam intensities will require an improvement<br />
of the shielding in this area.<br />
References<br />
[1] F. Gutermuth, T. Radon, G. Fehrenbacher, and J.G.<br />
Festag, Kerntechnik (2003), 68, 4, pp. 172-179.<br />
[2] T. Radon, G. Fehrenbacher, Ch. Pöppe, J. Sauer, and<br />
M. Wengenroth, <strong>GSI</strong>-report 2008, p. 129.<br />
X 42<br />
X 43<br />
X 44<br />
X 45<br />
annual* n-dose outside<br />
the shielding/ mSv<br />
controlled<br />
area<br />
6mSv<br />
monitored<br />
area<br />
1mSv<br />
X 46<br />
X 47<br />
X 48<br />
X 49<br />
max. 55 mSv<br />
in permanently<br />
controlled area<br />
10<br />
3.2<br />
1<br />
0.32<br />
0.1<br />
0.032<br />
0.01<br />
* TLD: 30.11.08 - 26.11.09<br />
BioRem: 1.1.09- 31.12.09<br />
X 50<br />
X 50<br />
Kran<br />
Zugang<br />
X 51<br />
X 51<br />
H H D<br />
X 52<br />
1-AF5<br />
X 52<br />
X 53<br />
b<br />
X 53<br />
X 54<br />
X 54<br />
Stromversor.<br />
Trafo<br />
X 55<br />
TLD<br />
X 55<br />
X 56<br />
BioRem<br />
X 56<br />
X 57<br />
Y 70<br />
X 57<br />
Y 69 Y 68 Y 67 Y 66 Y 65 Y 64 Y 63 Y 62 Y 61 Y 60<br />
Y 57<br />
Y 55 Y 54 Y 53 Y 52 Y 51 Y 50 Y 49 Y 48 Y 47 Y 46 Y 45 Y 44 Y 43 Y 42 Y 41 Y 40 Y 39 Y 38 Y 37 Y 36 Y 35 Y 34 Y 33 Y 32 Y 31<br />
temporarily<br />
controlled<br />
area<br />
Figure 1: Dose map of the high energy beam facilities at<br />
<strong>GSI</strong>. The annual dose measured with active (larger<br />
squares) and passive (smaller squares) dosimeters is<br />
shown. Values below 10 μSv were not taken into account.<br />
137
<strong>GSI</strong>-ACCELERATORS-10 <strong>GSI</strong> SCIENTIFIC REPORT 2009<br />
ESR Operation and Development<br />
C. Dimopoulou, A. Dolinskii, O. Gorda, V. Gostishchev, R. Hettrich, C. M. Kleffner,<br />
S. Litvinov, F. Nolden, P. Petri, U. Popp, I. Schurig, M. Steck<br />
In the framework of machine developments at the ESR<br />
two new modes of operation were tested. After first unsuccessful<br />
attempts to demonstrate the slow extraction of a<br />
decelerated beam, the slow extraction test was performed<br />
at higher energy. The main advantage is a much shorter<br />
cycle time allowing faster variation of parameters and easier<br />
diagnostics in the HITRAP linac. With improved orbit<br />
corrections and after careful tuning of quadrupole and<br />
sextupole magnets the resonant extraction of a cooled bare<br />
argon beam at an energy of 100 MeV/u could be demonstrated.<br />
The extraction was performed by tuning the main<br />
quadrupoles such that the tune was close to the third order<br />
resonance Qx = 2.333, subsequent slow linear variation of<br />
two sextupoles shifted the beam tune across the resonance.<br />
Particles which are excited to large betatron amplitude enter<br />
the electrostatic septum which deflects them into the<br />
extraction channel. Extraction times up to 10 s could be<br />
achieved easily. The required magnet setting for the resonant<br />
extraction is thus known and can be applied, if slow<br />
extraction of bare decelerated ions is needed in the future.<br />
The second new mode followed a request to have shorter<br />
cycle times for HITRAP commissioning with a 4 MeV/u<br />
beam delivered to the HITRAP linac. It resulted in tests of<br />
the direct transfer of a Unilac beam using SIS and ESR as<br />
single pass beamlines. Although this transfer was tried out<br />
several times with different ion species, all tests resulted in<br />
beam loss after the first dipole magnet in the ESR. The tests<br />
were seriously hampered by the fact, that no diagnostics are<br />
available to detect the low energy beam in the ESR during<br />
a single pass, neither destructively nor non-destructively.<br />
Various problems of this mode could be identified. The<br />
power converters of the beam line magnets between SIS<br />
and ESR were not foreseen to operate at such low magnetic<br />
rigidity. The focussing of the beam through SIS and the<br />
beamline is different from normal operation and the beam<br />
could not be matched to the standard ESR optical setting.<br />
At the location of the main beam loss, the electrodes of the<br />
stochastic cooling system limit the acceptance, even further<br />
impeding the passage of the unmatched beam.<br />
The HITRAP commissioning was regularly continued in<br />
two <strong>block</strong>s of about five days with bare nickel and xenon<br />
beams decelerated in the usual way from 400 to 4 MeV/u.<br />
Up to 2 × 10 7 nickel ions could be decelerated to 4 MeV/u<br />
with an efficiency of 15 % for the deceleration in the complex<br />
deceleration cycle. For xenon, limited by the shorter<br />
lifetime in the residual gas, 2 × 10 6 ions could be decelerated,<br />
the total cycle time could be reduced to 45 s.<br />
Various experiments were performed at the internal<br />
target of the ESR. A nuclear physics experiment used<br />
94 Ru 44+ ions decelerated from 100 to 10 and 9 MeV/u<br />
138<br />
<strong>GSI</strong>, Darmstadt, Germany<br />
and a dense hydrogen target. The reaction products of the<br />
(p, γ) reaction were studied with particle detectors installed<br />
in a section with large dispersion behind the target. Several<br />
high charge states (89+, 90+, 91+) of uranium and different<br />
energies in the range 120 to 400 MeV/u were used in<br />
an atomic physics experiment at the internal target.<br />
The experiment on time dilatation with precision laser<br />
spectroscopy of lithium ions was continued. A half life<br />
of the 59 MeV/u Li 1+ beam of 60 s confirmed that the<br />
problem with a tiny leak in the ultrahigh vacuum system<br />
of the ESR, which had hampered the experiment in previous<br />
years [1], has been solved.<br />
The mode for the production of rare isotope beams right<br />
in front of the ESR, tested before [1], was used for an experiment<br />
of dielectronic recombination of cooled lithium-like<br />
uranium. A beam of helium-like 237 U 90+ at 186 MeV/u<br />
was produced in a 10 mm thick beryllium target from a<br />
381 MeV/u primary 238 U 73+ bunch of up to 2 × 10 9 ions.<br />
The helium-like charge state injected and stored close to the<br />
central orbit was used to breed lithium-like uranium ions by<br />
capture of electrons from the comoving high intensity electron<br />
beam (electron current 450 mA). After 2-5 minutes<br />
1 − 2 × 10 5 helium-like ions had captured one more electron<br />
circulating on an orbit radially further outside. These<br />
comoving 237 U 89+ ions were then moved to the central orbit<br />
by ramping all magnets of the ring to a higher field with<br />
a field increase of about 1 %. During this manipulation the<br />
electron cooling was continued at fixed energy. Finally, the<br />
selected particles circulated on the central orbit, whereas<br />
most other beam components, which were injected together<br />
with the wanted particles, were removed by inserting fast<br />
scrapers from inner and outer side into the ring acceptance.<br />
The lithium-like charge state was then used for measurements<br />
of dielectronic recombination spectra by scanning<br />
the energy of the comoving electron beam thus varying the<br />
relative velocity between ions and electrons. This measurement<br />
cycle was repeated for 236 U 89+ and 238 U 89+ in order<br />
to detect small shifts of resonant lines for different isotopes.<br />
For future experiments with single or few ions a new<br />
Schottky noise pick-up based on a pill box type cavity with<br />
a resonant frequency around 250 MHz has been designed<br />
and constructed. The stainless steel body was copper plated<br />
at <strong>GSI</strong>. A quality factor of around 1000 should considerably<br />
increase the signal to noise ratio compared to the existing<br />
broad band Schottky pick-up. The cavity will be tested<br />
and prepared for installation in the ESR early 2010.<br />
References<br />
[1] C. Dimopoulou et al., <strong>GSI</strong> Report 2009-1.
<strong>GSI</strong> SCIENTIFIC REPORT 2009 <strong>GSI</strong>-ACCELERATORS-11<br />
Improved Isochronous Mode of the ESR<br />
S. Litvinov 1 , C. Dimopoulou 1 , A. Dolinskii 1 , Yu. Litvinov 1,2 , F. Nolden 1 , M. Steck 1 , and H. Weick 1<br />
In the isochronous ion-optical mode of a storage ring the<br />
revolution time of circulating ions is independent of their<br />
velocity, and depends on their mass-over-charge ratio only.<br />
This mode is the basis for the Isochronous Mass Spectrometry<br />
(IMS). This experimental technique for direct mass<br />
measurements of a large variety of short-lived exotic nuclei<br />
has been developed at the FRS-ESR facility at <strong>GSI</strong> [1]. Improved<br />
isochronicity of the ESR as well as the ion-optical<br />
matching of the FRS-ESR has been calculated.<br />
Ion-Optical Calculation<br />
The isochronous mode has been originally calculated using<br />
the five ESR quadrupole families [2]. The main peculiarity<br />
of this optics is the large negative dispersion in the<br />
straight sections (D≈-8 m) whereas the FRS is an achromatic<br />
system at the last focal plane before the injection<br />
into the ESR. This leads to a large dispersion mismatch.<br />
Additionally, there is a mismatch in the transverse phase<br />
space. These effects induce incorrect betatron and dispersion<br />
motions in the ring, and, therefore, strongly reduce the<br />
transmission of the ions into the ESR. A careful ion-optical<br />
matching had been required and was achieved for the first<br />
time by adjusting the 11 quadrupoles of the FRS, which<br />
allowed to increase the transmission by a factor of 10 [3].<br />
Besides the transmission, the erroneous dispersion motion<br />
causes an additional time spread of the circulating ions.<br />
Moreover, the non-achromatism of the ESR itself brings a<br />
supplementary uncorrectable first-order transverse contribution<br />
to the revolution time. These contributions are the<br />
largest at the first revolutions and average out after many<br />
turns. For example, after the first 100 revolutions the calculated<br />
∆m/m ∼ 1 · 10 −5 (1σ) is for a momentum deviation<br />
of 0.12% (mismatched dispersion) and 2 · 10 −5 (1σ) for a<br />
horizontal emittance of 5 mm mrad (non-achromatism).<br />
In order to make the ESR achromatic, to facilitate the<br />
FRS-ESR matching and to improve the isochronicity of the<br />
ESR, it was proposed to recalculate the isochronous optics.<br />
The new mode has been designed using 10 quadrupole<br />
families, since the 20 ESR quadrupoles are connected to<br />
Figure 1: Calculated dispersion functions for the present (solid curve)<br />
and the new (dashed curve) isochronous optics. The position of the TOF<br />
detector is indicated with an arrow. Grey squares represent the dipoles.<br />
1 <strong>GSI</strong>, Darmstadt, Germany; 2 MPI-K, Heidelberg, Germany<br />
the power supplies in pairs. The calculation has been performed<br />
with the ion-optical code GICOSY [4]. The dispersion<br />
function of both isochronous settings is illustrated in<br />
Fig. 1. It can be seen, that the ”new” dispersion function is<br />
smaller on average, which allows to increase the momentum<br />
acceptance of the ESR by about 25%. Additionally, a<br />
smaller dispersion (D≈-5 m) at the position of the time-offlight<br />
(TOF) detector shall increase its efficiency.<br />
The 8 ESR sextupoles are connected independently<br />
to the corresponding power supplies. The sextupoles<br />
have been employed for the second-order corrections<br />
(isochronicity, natural chromaticities) in calculations of<br />
both optical modes. The optimized modes have been further<br />
used in the Monte-Carlo simulations.<br />
Monte-Carlo Simulation<br />
The simulations have been performed with the program<br />
MOCADI [5]. We have simulated 10 5 ions circulating for<br />
100 turns in the ESR. The corresponding results are presented<br />
in Fig. 2.<br />
Figure 2: The variation of the revolution time as a function of the momentum<br />
deviation for the present and the new isochronous optics.<br />
The high-order aberrations play a significant role for particles<br />
with large momentum deviations. In a region of<br />
∆p/p = ±0.1% the mass resolution in the new mode is<br />
about 2·10 −7 . This is one order of magnitude improvement<br />
compared to the present mode. Even for almost zero momentum<br />
deviations, the time spread due to different transverse<br />
motion is significant in the present optics, and is improved<br />
in the new mode (achromatism of the ESR).<br />
References<br />
[1] M. Hausmann, et al., Nucl. Instr. Meth. A 446, 569 (2000).<br />
[2] A. Dolinskii et al., Proceedings of EPAC, 596-598 (1996).<br />
[3] S.Litvinov, et al., <strong>GSI</strong> Scientific Report 2007, p. 212 (2008).<br />
[4] H. Wollnik, et al., AIP Proceedings 177, 74 (1988).<br />
[5] N. Iwasa et al., Nucl. Instr. Meth. B 126, 284-289 (1997).<br />
139
<strong>GSI</strong>-ACCELERATORS-12 <strong>GSI</strong> SCIENTIFIC REPORT 2009<br />
140<br />
ThenewProfileViewSoftwareforBeamInducedFluorescenceMonitors<br />
SystemSetup<br />
<strong>GSI</strong>acceleratorsarecurrentlyequippedwithfourBeam<br />
InducedFluorescence(BIF)monitors.Theydeterminethe<br />
transversebeamprofileswithoutbeamdisturbancebydetectingthefluorescencelightgeneratedbyexcitationofa<br />
workinggas(N2)withthepassingionbeam. Therefore,<br />
theyarewellsuitedtoobservethebeamatmultiplepositionssimultaneously[1].<br />
The fluorescence photons are detected by two microchannelplate(MCP)basedimageintensifiersystemsusingFireWireCCDcamerastodeterminethehorizontaland<br />
verticalbeamprofile. Eachcameralenshasaremotecontrollable<br />
iris to adjust the number of photons hitting the<br />
photocathodeoftheintensifiersystem. IrisesandMCP<br />
amplificationarecontrolledbyanEthernetconnectedDAC<br />
electronics. Additionally, eachBIFmonitorcomprisesa<br />
pressurecontrolunittoinjectdefinedgaspressuresintothe<br />
beampipeandatimingdecodertotriggerthecamerasand<br />
theMCPs.<br />
SoftwareDesign<br />
ThesoftwareforthesystemconsistsofaserverpartwritteninLabView[2]andaclientpartwritteninC++.<br />
The<br />
server part is running on a powerful Windows PC (2.66<br />
GHz,QuadCoreCPU).Theimagedataisreadoutfrom<br />
thecamerasandpre-processedaccordingtotheusersettings(e.g.<br />
imagerotation, mirroring, projectioncalculation).<br />
The resulting data is then forwarded via the network<br />
to a client PC running the C++ application called<br />
ProfileView. Indailyoperation, onlytheprojectionsare<br />
sentviathenetworkanddisplayedinthegraphical user<br />
interface. Additionally, unompressedrawimagescanbe<br />
transmittedforstorageandofflineanalysis. Thenetwork<br />
loadofa20HzdatastreamofoneBIFmonitorrisesconsiderablyfrom0.8MBit/s(projectionsonly)to110MBit/s<br />
whenboth,projectionsandrawimages,arerequested.For<br />
networkcommunication, standardTCP/IPsocketsovera<br />
gigabitEthernetconnectionareused.<br />
SupplementalhardwaredevicesarecontrolledbyProfileViewviaEthernet.Criticalsystems,likeMCPorpressure<br />
control, are implemented using separate threads for<br />
eachdevice. Therefore,extensivecalculationsinthemain<br />
eventloopoftheapplicationwillnot<strong>block</strong>thecommunicationwiththesedevices.IftheconnectiontotheMCPamplificationdeviceislost,thehardwaresetsallvoltagestoa“savevalue”topreventdamageofthesystem.Toavoidaccidentalfloodingofthebeampipewithgas,pressurevaluesaredouble-checkedbyProfileViewandthepressurehardwarepriortovalveregulation.<br />
Thenetworkconnectionto<br />
R.Haseitl,F.Becker,P.Forck,andT.Hoffmann<br />
<strong>GSI</strong>AcceleratorBeamDiagnostics,Darmstadt,Germany<br />
Figure1:ScreenshotoftheProfileViewsoftware,showing<br />
twoactiveBIFmonitors(TK6,US1)andatestsignal.<br />
thetiminggeneratorisestablishedondemandandclosed<br />
afterthesuccessfuldispatchofthecommand.ProfileView<br />
usestheQtC++libraries[3]toachieveplatformindependenceandisexecutableonboth,WindowsandLinuxcomputers.<br />
UsingtheLinuxX-technology,thegraphicaluser<br />
interfaceshowninFig.1canbebeamedtoanyoftheterminalsinthe<strong>GSI</strong>maincontrolroom.Additionalinformation<br />
onthesoftwarearchitecturecanbefoundin[4].<br />
UserExperienceandOutlook<br />
ProfileView is used for the commissioning of the recentlyinstalledBIFmonitorsin2009.During2010afinal<br />
numberofsevenBIFmonitorswillbesetupat<strong>GSI</strong>.First<br />
experiencesshowagoodperformanceofthesystem. The<br />
abilitytoviewmultipleBIFimagessimultaneouslyandto<br />
storetheirrawdataisagreatbenefite.g. forbeamalignmentproceduresandqualityassurance.<br />
Userrequestsfor<br />
additionalfunctionalityhavebeencollectedandwillbeimplementedinthenextversionofProfileView.<br />
References<br />
[1] F. Becker, et al., “Beam Induced Fluorescence Monitor<br />
for Transverse Profile Determination”, DIPAC’07, Venice,<br />
(2007).<br />
[2] CompanyNationalInstruments,www.ni.com<br />
[3] CompanyNokia,http://qt.nokia.com/<br />
[4] R. Haseitl, et al., “ProfileView - A Data Acquisition SystemforBeamInducedFluorescenceMonitors”,DIPAC’09,<br />
Basel,(2009).
<strong>GSI</strong> SCIENTIFIC REPORT 2009 <strong>GSI</strong>-ACCELERATORS-13<br />
Imaging-Spectroscopy for BIF-Monitors in Rare Gases and Nitrogen<br />
F. Becker ∗1 , P. Forck 1 , R. Haseitl 1 , B. Walasek-Hoehne 1 , P.A. Ni 2 , and D.H.H. Hoffmann 3<br />
1 <strong>GSI</strong>, Darmstadt, Germany; 2 LBNL, Berkeley, CA 94720, USA; 3 IKP, TU-Darmstadt, Germany<br />
For transverse profile determination a non-intercepting<br />
Beam Induced Fluorescence (BIF)-monitor was developed.<br />
The BIF-monitor detects fluorescence light emitted by<br />
residual gas molecules after atomic collisions with beam<br />
ions [1]. Using an imaging spectrograph the spectral response<br />
was mapped and associated with the corresponding<br />
gas transitions in helium, argon, krypton, xenon and nitrogen.<br />
Spectrally resolved beam profiles were obtained from<br />
the spectrographic images simultaneously. The present<br />
study with 5 MeV/u proton, S 6+ and Ta 24+ -ions reproduced<br />
the results of earlier studies with a 95 keV proton<br />
beam [2]. Moreover, the camera system connected to the<br />
spectrograph was image intensified, to provide single photon<br />
detection in order to resolve even weak transitions [3].<br />
Figure 1: Fluorescence images of 3,2·10 11 S 6+ ions with<br />
Ekin = 5.16 MeV/u in 10 −3 mbar N2 (left) and He (right)<br />
for 5 ms pulse duration at <strong>GSI</strong>-UNILAC.<br />
The fluorescence light emitted by the residual gases was<br />
imaged with a chromatically corrected quartz-lens (UV-<br />
VIS) to the adjustable entrance slit of an imaging spectrograph<br />
[3]. A holographic grating with 285 grooves/mm<br />
provides 1.5 nm spectral resolution. The spatial resolution<br />
was determined to be 40 µm/pixel. Exemplarily for other<br />
gases, fluorescence images for a S 6+ -beam in N2 and He<br />
are shown in Fig. 1. In order to purify the gas atmosphere,<br />
the chamber was evacuated to the base pressure of 10 −8<br />
mbar and carefully flushed with each gas species before<br />
taking spectral data.<br />
Beam profiles obtained for N2, Ar, Kr and Xe show<br />
reasonable profile widths and correspond well with each<br />
other. He however is the only gas that generates significantly<br />
broadened profiles, see Fig. 2. All fluorescence<br />
spectra were calibrated and transitions could be identified<br />
with the help of spectroscopic databases [3]. Furthermore,<br />
results from spectroscopy show that rare gases have only<br />
25% of the induced light yield (normalized with respect to<br />
the differential energy loss) achieved in nitrogen, [3]. Additionally,<br />
the fluorescent light of N2 is concentrated in a<br />
few transitions, see Fig. 3. Thus N2-gas seems to be the<br />
best choice and is therefore used at 7 BIF-stations along the<br />
UNILAC, which are currently installed and commissioned.<br />
∗ frank.becker@gsi.de<br />
Figure 2: Beam profiles of S 6+ ions in different purified<br />
gas-species at 10 −3 mbar, for beam parameters see Fig. 1.<br />
Figure 3: Fluorescence spectra of different working gases,<br />
induced by the S 6+ -beam described in Figure 1. The indexed<br />
transitions can be found in [3].<br />
References<br />
[1] P. Forck and A. Bank, Residual Gas Fluorescence for Profile<br />
Measurements at the <strong>GSI</strong> UNILAC, EPAC’02, 2002, Paris,<br />
p. 1885-1887<br />
[2] P. Ausset, S. Bousson, D. Gards, A. C. Mueller, B. Pottin,<br />
R. Gobin, G. Belyaev and I. Roudskoy, Optical Transverse<br />
Beam Profile Measurements for High Power Proton Beams,<br />
EPAC’02, 2002, Paris, p. 1840-1842<br />
[3] F. Becker, C. Andre, F. M. Bieniosek, P. Forck, R. Haseitl,<br />
A. Hug, P. A. Ni, D. H. H. Hoffmann, B. Walasek-Hoehne,<br />
BIF-Monitor & Imaging Spectrography of Different Working<br />
Gases, DIPAC’09, 2009, Basel, p. 161-163<br />
141
<strong>GSI</strong>-ACCELERATORS-14 <strong>GSI</strong> SCIENTIFIC REPORT 2009<br />
142<br />
Charge-Frequency-Converter (QFW) Test Board and Results<br />
H. Flemming**, S. Löchner**, H. Reeg*, M. Witthaus*, <strong>GSI</strong>, Darmstadt, Germany<br />
Overview<br />
<strong>GSI</strong> Beam Diagnostics department recently started<br />
investigations on an economic solution for profile grid<br />
electronics. The front-end amplifiers and control devices<br />
presently used are outdated, very expensive and important<br />
parts, like low noise amplifiers, have long delivery times<br />
and/or have been discontinued by the manufacturer.<br />
For the FAIR beamlines, around one hundred profile grid<br />
systems will be needed. The QFW CMOS-ASIC (Charge-<br />
Frequency-Converter [1][3]), developed by the Experiment<br />
Electronics department (EE) is a very promising<br />
candidate for a new design of the profile grids, due to it’s<br />
high dynamic range without the need for any range<br />
switching.<br />
After first tests with the 4-channel QFW module [2], it<br />
was decided to develop a new board, more related to<br />
practice and with additional electronic features (Fig. 1).<br />
Fig. 1: New QFW-board with PIC micro-controller,<br />
display LEDs, current divider, LVDS-/LV-TTL-drivers.<br />
Hard- and Software<br />
The experimental board shown in Fig. 1 consists of:<br />
• 4-channel QFW II<br />
• current divider (for extended measuring range)<br />
• LVDS- or LV-TTL outputs drivers<br />
• power-supply for external devices (+3.3V/+5V)<br />
• ICD-interface<br />
• two precision voltage sources<br />
• micro-controller Microchip® PIC 18FL4520<br />
• several LEDs, hex-switch and two push-buttons<br />
This board was designed in order to check the QFW in<br />
different operational modes, thus enabling measurements<br />
in the experimental areas of <strong>GSI</strong>. It was negotiated<br />
between Bio-Physics dept. and EE to add a selectable<br />
current divider onto the board, making it possible to<br />
measure currents up to 20 mA, of course dependent on the<br />
values of the circuit elements. Free-programmable LEDs,<br />
push buttons, a hex-switch and several I/O channels allow<br />
for adoption of the board to different measurement tasks.<br />
*Beam Diagnostics ** Experiment Electronics<br />
Output pulses and overload-bits are fed to their connector<br />
plugs through LVDS- or LV-TTL-drivers.<br />
The micro-controller software was programmed in<br />
assembler via Microchip MPLAB®. The hex-switch<br />
allows changing range and polarity. After Power-On or<br />
Reset with the related buttons, the micro-controller<br />
transfers the necessary instructions to the QFW interface,<br />
whereupon operation starts.<br />
Measurement Results<br />
The QFW was tested under different conditions. At first<br />
the agreement with the results from the QFW datasheet<br />
and jitter behaviour was checked, and then tests under<br />
different ambient temperatures and different levels of Xradiation<br />
were carried out (see [4] for more information).<br />
A jitter around 0.1 ppt or better at each particular current<br />
value was detected by using an HP time interval analyser<br />
5372A.<br />
The linearity of the frequency outputs fulfils the<br />
requirements for future profile grid electronics. Also the<br />
frequency deviation between each channel and a reference<br />
signal was investigated. This deviation is better than 1 %<br />
Full Scale.<br />
The temperature behaviour studies were performed in a<br />
climatic exposure cabinet. Many measurement series were<br />
done between 0°C and 50°C. The results show a deviation<br />
of 0.7 % only, with respect to the 20°C reference.<br />
Presently, all these results show that the QFW ASIC can<br />
be used in a new design for profile grid electronics.<br />
Additional comprehensive tests are in progress.<br />
Outlook<br />
A new QFW board equipped with 8 ASICs will be<br />
developed in 2010, in collaboration with the EE<br />
department. This prototype will be controlled by an<br />
existing FPGA-I/O VME board (VUPROM) .<br />
A LabVIEW program will control the measurements.<br />
First beam tests of the prototype will be performed with a<br />
2x16-wire profile grid in an experimental beamline at<br />
<strong>GSI</strong>. The board will also be used for further<br />
characterisation of the QFW ASIC.<br />
References<br />
[1] H. Flemming, QFW II Preliminary Datasheet, <strong>GSI</strong>,<br />
2008<br />
[2] H. Flemming, QFW Module Preliminary Datasheet,<br />
<strong>GSI</strong>, 2007<br />
[3] H. Flemming, E. Badura, A High Dynamic Charge to<br />
Frequency Converter ASIC, <strong>GSI</strong> Scientific Report, 2004<br />
[4] S. Löchner, Total Ionising Dose Studies of the QFW<br />
ASIC, <strong>GSI</strong> Scientific Report, 2009.
<strong>GSI</strong> SCIENTIFIC REPORT 2009 <strong>GSI</strong>-ACCELERATORS-15<br />
Temperature and Spectroscopic Studies on Inorganic Scintillating Materials<br />
E. Gütlich 1,2 , W. Ensinger 2 , P. Forck 1 , K. Gütlich 1 , R. Haseitl 1 , and B. Walasek-Höhne 1<br />
1 <strong>GSI</strong>, Darmstadt, Germany; 2 Technical University Darmstadt, Darmstadt, Germany<br />
At the <strong>GSI</strong> UNILAC scintillating screens are used for<br />
transverse beam profile monitoring. For high current beam<br />
operations inorganic scintillators were investigated and numerical<br />
analysis of the recorded images was performed.<br />
The light yield, imaged beam width and higher statistical<br />
moments show strong dependence on the scintillating<br />
materials deployed [1, 2] and their temperature. Detailed<br />
temperature studies were carried out using a Ni layer<br />
(as a heating loop) sputtered on the backside of the ZrO2<br />
screen. Additionally, the spectral response of the materials<br />
was mapped for different temperature levels (RT-300 o C),<br />
using a spectrometer.<br />
During the measurements, heating power was kept constant<br />
but the temperature of the sample was increasing due<br />
to the energy deposition of the impinging ion beam. As<br />
shown in Fig. 1 the light yield and imaged beam width for<br />
ZrO2 irradiated by the proton beam increase with temperature,<br />
except the initial phase which is difficult to interpret.<br />
In the temperature range from 125 - 250 o C, the light yield<br />
increases by the factor of 4 and the imaged beam width by<br />
1.5. These results clearly point out that the temperature of<br />
the scintillators is critical for high current operations.<br />
Spectra of the scintillation light show a temperature dependance<br />
[3] as depiced in Fig. 2. For the broad band at<br />
480 nm a slight shift to higher wavelengths is observed during<br />
the heating process. The bands around 400 and 725 nm<br />
are affected by the temperature, as well. For the spectra<br />
obtained with the proton beam, a sharp line around 515 nm<br />
occurred which is not observed for T a 24+ beam. Additionally,<br />
this line is not influenced by the change of screen<br />
temperature (Fig. 2).<br />
Several scintillating materials like Al2O3, Quartz etc.<br />
were investigated under various beam conditions (H + as<br />
well as heavy elements up to U 28+ ). Different readings of<br />
the imaged beam width for various materials were found.<br />
Further more, spectroscopic studies on different materials<br />
show a significant dependence of the spectra on the used<br />
ion species. A detailed discussion of these topics can be<br />
found in [3] and will be further investigated.<br />
References<br />
[1] E. Gütlich et al., “Scintillation Screen Investigations at UNI-<br />
LAC”, 2007/2008 <strong>GSI</strong> Scientific Report, pp. 105/pp. 126.<br />
[2] E. Gütlich et al., “Scintillation Screen Investigations for High<br />
Current ion Beams at <strong>GSI</strong>-LINAC”, BIW’08, Lake Tahoe,<br />
May 2008, p. 100, http://www.jacow.org/.<br />
[3] E. Gütlich et al., “Scintillation screen investigations for high<br />
current ion beams”, SCINT’09, Jeju, June 2009, IEEE Transactions<br />
on Nuclear Science, accepted for publication in June<br />
2010 issue.<br />
Figure 1: Temperature dependence of light yield and beam<br />
width for ZrO2. Parameters of H + beam: 300-500<br />
macro-pulses of 4 ms lenght, 2 Hz repetition rate with<br />
3.5 · 10 11 ppp at 4.8 MeV/u.<br />
������������������<br />
������������������������<br />
����������������������������<br />
�<br />
����������������<br />
� ����� ������������������<br />
������������������<br />
�� ��� ���� �<br />
�����������������<br />
������������������<br />
������������������<br />
��� ��� ��� ���<br />
���������������<br />
�<br />
�<br />
�<br />
�<br />
Figure 2: Scintillation light specra of ZrO2 for irradiation<br />
with H + (for the beam parameters see Fig. 1.) and T a 24+<br />
(beam parameters: 1 Hz repetition rate with 8.8 · 10 9 ppp<br />
in 100 µs pulse length at 11.4 MeV/u. The spectra are averaged<br />
over 1000 images and are not corrected for photocathode<br />
(top) and spectrometer efficiency.<br />
143
<strong>GSI</strong>-ACCELERATORS-16 <strong>GSI</strong> SCIENTIFIC REPORT 2009<br />
Transversal Beam Dynamics Calculations for HITRAP ∗<br />
J. Pfister † 1,2 , G. Clemente 2 , F. Herfurth 2 , O. Kester 3 , and U. Ratzinger 1<br />
1 IAP, University of Frankfurt, Germany; 2 <strong>GSI</strong>, Darmstadt, Germany; 3 NSCL, East Lansing, MI 48824, USA<br />
Until 2008 several transversal and longitudinal beam dynamics<br />
simulation codes have been used for the calculation<br />
of the transversal beam behavior in the HITRAP decelerator<br />
and its connected beamlines. Since simulations<br />
are an essential support during commissioning, the aim of<br />
this project was to be able to simulate at least the complete<br />
beam from the exit of the ESR through different optical elements<br />
including the transversal effect of the Double-drift<br />
buncher as well as the first deceleration stage (IH-structure)<br />
shown in fig. 1 using only one code. This should result in<br />
a fast code for transversal optimization down to the RFQ,<br />
which can be used online during commissioning.<br />
Elements taken into account are two big dipoles and<br />
ESR<br />
diaphragm<br />
IH<br />
RFQ<br />
beam<br />
Figure 1: Schematic of transversal optical elements:<br />
dipoles (green), quadrupoles (red,blue), buncher (circles)<br />
and IH-cavity (square).<br />
a strong quadrupole doublet already used in the old reinjection<br />
line. Furthermore new quadrupole triplets and<br />
doublets as well as the double-drift buncher and the IHstructure<br />
were installed in the linear deceleration beamline.<br />
The problem has been approached using the COSY Infinity<br />
software [1]. Algorithms for transversal influence of<br />
an acceleration gap have been developed and extensively<br />
tested and compared with LORASR calculations. A matrix<br />
routine together with the knowledge of accelerating<br />
fields and phase relations in each gap of bunchers and IHstructure<br />
has been implemented.<br />
Since the complete transversal beam dynamics can be<br />
calculated within this code without interchanging data to<br />
other codes an easy-to-use simulation tool including the deceleration<br />
from 4 MeV/u down to 500 keV/u and injection<br />
into the RFQ was achieved. It can be used for optimization<br />
of the transversal beam properties.<br />
An essential, but also critical part in the beamline is a<br />
diaphragm (see fig. 1, length 150 mm with inner diameter<br />
12 mm) inserted during and is staying there since the<br />
first beamtime in May 2007 in between the ESR extraction<br />
beamline and the HITRAP linear decelerator for vacuum<br />
decoupling. This was not foreseen in the TDR [2] and<br />
makes beam transport more difficult.<br />
Studies which were carried out in 2009 show that<br />
this makes an efficient transversal focusing into the IHstructure<br />
impossible and then causes beam losses in the in-<br />
144<br />
∗ Founded by BMBF06FY160I and HITRAP-IH-Struktur<br />
† j.pfister@gsi.de<br />
tertank section resp. at RFQ injection due to too big RF<br />
defocusing in the IH. At least 25% of the particles will be<br />
lost with the presently possible magnet gradients. Fig. 2(a)<br />
shows best possible beam transport from the IH to the RFQ<br />
using the current intertank setup including the permanently<br />
installed diaphragm in front of the first buncher. Phase<br />
space distributions and acceptance of the RFQ are compared<br />
in figs. 2(b) and (c).<br />
Simulated beam transport from the ESR to the IH has<br />
qudrupole rebuncher qudrupole<br />
doublet 4 doublet 5<br />
IH RFQ<br />
15mm<br />
(a) intertank beam transport<br />
(b) horizontal phase space (c) vertical phase space<br />
Figure 2: (a) Beam transport from IH to RFQ and injection<br />
with diaphragm and current setup, (b) and (c) Best possible<br />
phase space distributions and RFQ acceptance.<br />
been experimentally proven. It shows discrepancies of only<br />
up to a few percent, which is caused by the measurement<br />
error of the beam diameter.<br />
This problem could be solved by an adjusted intertank<br />
section. If the two doublets could be pulsed to higher gradients<br />
no physical adjustement would be necessary reaching<br />
a transversal transmission of ≈ 98%. The corresponding<br />
phase space is also shown in fig. 2 and compared to the<br />
RFQ acceptance.<br />
References<br />
[1] K. Makino and M. Berz, “COSY INFINITY version 8”, Nucl.<br />
Instrum. Methods A 427 (1999) 338-343.<br />
[2] T. Beier, L. Dahl, H.-J. Kluge, C. Kozhuharov und W. Quint,<br />
“HITRAP Technical Design Report”, Gesellschaft <strong>für</strong> <strong>Schwerionenforschung</strong><br />
mbH, Darmstadt (2003).
<strong>GSI</strong> SCIENTIFIC REPORT 2009 <strong>GSI</strong>-UPGRADE-ACC-01<br />
<strong>GSI</strong>Template2007<br />
Investigation of the Beam Quality from High Current Ion Sources on HOSTI<br />
With the coming FAIR project at <strong>GSI</strong> the requirements for<br />
beam brilliance for heavy ion beams provided by the high<br />
current injector will increase, especially for uranium ions. To<br />
perform and to demonstrate the required improvements the<br />
high current test injector (HOSTI) has been built up. The<br />
main purpose of HOSTI is an optimization of the experimental<br />
setup of a high current ion source and the post acceleration<br />
gap to increase the beam brilliance [1].<br />
The investigations have been performed in two stages [2].<br />
The first stage of investigations includes the measurements<br />
of the transversal ion beam emittance with slit-grid scanner<br />
installed directly behind the post acceleration gap. The<br />
measurements were performed with a singly charged Arbeam<br />
provided by MUCIS with fixed ion velocity of 2.2 keV<br />
per nucleon (actual requirements of existing RFQ). During<br />
this stage the beam emittance has been investigated as a<br />
function of the following parameters: ratio between extraction<br />
(Uext.) and post acceleration (UPA) voltages at fixed ion<br />
energy; width of the high voltage gap in the post acceleration<br />
system; emission current density of the ion source; ion beam<br />
current in the beamline.<br />
For the second stage of the measurements the superconducting<br />
solenoid (built by Cryogenic LTD) was installed<br />
directly behind the post acceleration gap. The solenoid represents<br />
a two-magnet system with the main coil in the middle<br />
and two serially connected compensation coils positioned<br />
symmetrically at each end of the main coil.<br />
Figure 1: Influence of the longitudinal profile of the solenoid<br />
field on the beam emittance.<br />
During the second stage the influence of the solenoid field<br />
with different focusing strength and various profile shapes on<br />
the beam emittance was investigated [2]. Of particular inter-<br />
A. Adonin, R. Hollinger, and P. Spädtke<br />
<strong>GSI</strong>, Darmstadt, Germany.<br />
B (T) Field Profiles<br />
1,5<br />
1<br />
0,5<br />
0<br />
-0,6 -0,4 -0,2 0,0 0,2 0,4 0,6<br />
-0,5<br />
-1<br />
-1,5 1,5<br />
1<br />
0,5<br />
0<br />
-1<br />
-1,5<br />
1,5<br />
Length (m)<br />
Main<br />
Aux.<br />
Compos.<br />
-0,6 -0,4 -0,2 0,0 0,2 0,4 0,6<br />
-0,5<br />
1<br />
0,5<br />
0<br />
-0,6 -0,4 -0,2 0,0 0,2 0,4 0,6<br />
-0,5<br />
-1<br />
-1,5<br />
est were the measurements with variation of the longitudinal<br />
field profile keeping the same focusing strength. In Fig.1 the<br />
emittance pictures and the field profiles for three drastically<br />
different solenoid field shapes: only compensation coil, main<br />
and compensation coils and only main coil are shown.<br />
In addition we measured the real space profile of the ion<br />
beam. Measurements were performed using the viewing<br />
screen installed on the same position as the scanner slit with<br />
45 degrees to the ion beam axis. The beam profile has been<br />
investigated as a function of various settings of the ion<br />
source, post acceleration system as well as the solenoid field.<br />
As a main result of these measurements it was shown that the<br />
structure of the ion beam after extraction is conserved and<br />
there is no full homogenization of the ion distribution in the<br />
post acceleration gap. Thereby with adjustment of certain<br />
parameters it is possible to reproduce the image of the extraction<br />
electrode on the viewing screen (several meters behind<br />
the gap) (Fig.2).<br />
Figure 2: (left) electrode shape of 13-hole extraction system;<br />
(right) reflected image of the extraction electrode.<br />
From these investigations the following conclusions can<br />
be drawn:<br />
– the superconducting solenoid is suitable for transporting<br />
and focusing the high current heavy ion beam with the required<br />
parameters;<br />
– we could not observe any reasonable growth of the beam<br />
emittance due to solenoid focusing;<br />
– the strong magnetic field of the solenoid does not disturb<br />
the space-charge compensation of the ion beam and does not<br />
produce any additional optical aberrations;<br />
– we did not observe any appreciable influence of the longitudinal<br />
magnetic field profile on beam emittance beside different<br />
focal length;<br />
– the beam profile measurements provided simultaneously<br />
with emittance measurements can give necessary information<br />
about the ion distribution.<br />
References<br />
[1] R. Hollinger, M. Galonska, F. Heymach, K.D. Leible,<br />
K. Ochs and P. Spädtke: High Current Ion Source Development<br />
and HOSTI, <strong>GSI</strong> Scientific Report 2005,<br />
ISSN 0174-0814.<br />
[2] A. Adonin, R. Hollinger, P. Spädtke: Measurements of<br />
Transverse Ion Beam Emittance Generated by High<br />
Current Ion Sources at the <strong>GSI</strong> Test Injector Facility<br />
HOSTI, Proceedings of the 13th International Conference<br />
on Ion Sources, Gatlinburg, USA, September 2009.<br />
145
<strong>GSI</strong>-UPGRADE-ACC-02 <strong>GSI</strong> SCIENTIFIC REPORT 2009<br />
146<br />
<strong>GSI</strong>Template2007<br />
HSI-Frontend Upgrade<br />
W. Barth, L. Dahl, M.-S. Kaiser, A. Kolomiets*, S. Mickat, S. Minaev*, W. Vinzenz, H. Vormann,<br />
S. Yaramyshev<br />
<strong>GSI</strong>, Darmstadt, Germany; *ITEP, Moscow, Russia.<br />
Overview HSI-Frontend Upgrades<br />
To fulfil the requirements of FAIR (15 emA of U 28+<br />
with min. 70 µs pulse length to be injected into SIS18),<br />
the UNILAC has to be upgraded in several sections: the<br />
LEBT [1], the HSI-RFQ [2], the Alvarez main accelerator<br />
[3], and high current beam diagnostics [4].<br />
Corresponding to the requirements of FAIR, the High<br />
Current Injector HSI has to deliver 18 mA U 4+ at HSI<br />
output. This cannot be achieved with the RFQ and the<br />
LEBT as existing up to 2008. Therefore a three-step upgrade<br />
of this HSI-Frontend is scheduled: The RFQ-<br />
Upgrade has been realized in 2009, the LEBT-upgrade I<br />
(quadrupole quartet and switching magnet) is foreseen for<br />
2010, followed by LEBT-upgrade II with an additional<br />
linear source branch (Compact LEBT), as a part of the<br />
FAIR-UNILAC upgrade.<br />
Figure 1: HSI-Frontend upgrade, including new ion<br />
source terminal and Compact LEBT.<br />
HSI-RFQ Upgrade<br />
In a prior upgrade of the HSI-RFQ (2004), a modified<br />
input radial matching section (IRM) was installed, resulting<br />
in significantly increased high current transmission,<br />
confirmed by simulations [5].<br />
In 2009, the HSI-RFQ has been upgraded again, now<br />
with a completely new beam dynamics design of the new<br />
electrodes [2]. With an enlarged aperture and higher voltage<br />
(155 kV instead of 125 kV at Uranium level, but max.<br />
surface peak field held lower than the old design), the<br />
acceptance is increased. With an improved IRM design<br />
the emittance in the radial matching section is keeping<br />
small.<br />
A constant average aperture, transverse electrode vane<br />
shape and carrier ring dimension along the whole RFQ<br />
was chosen from simulations to meet the resonance frequency<br />
and a flat voltage distribution. After machining<br />
and reassembly of the RFQ, first measurements during the<br />
RF tuning period confirmed the predicted properties. As<br />
expected from the comparison of simulations and measurements<br />
of existing resonator sections, only six fixed<br />
plungers were needed.<br />
Besides mechanical modifications, the power supply<br />
for the RF transmitter has been equipped with bigger capacitors,<br />
to provide for the higher total RF power and for<br />
acceptable reliability. RF conditioning took only four days<br />
to reach the argon level (104 kV, 330 kW), and three more<br />
weeks to reach uranium level (155 kV, 1.2 MW). Conditioning<br />
for uranium level was proceeded for additional six<br />
weeks, until the necessary RF-power decreased<br />
(1.0 MW).<br />
HSI-RFQ New Design Existing Design<br />
Electrode voltage / kV 155 125<br />
Average aperture radius / cm 0.6 0.5245 – 0.7745<br />
Electrode width / cm 0.846 0.9 – 1.08<br />
Maximum field / kV/cm 312.0 318.5<br />
Modulation 1.012 – 1.93 1.00 – 2.09<br />
Synch. Phase, degrees -90 0 - -28 0 -90 0 - -34 0<br />
Minimum aperture radius, cm 0.410 0.381<br />
Number of cells with modulation 394 343<br />
Length of electrodes, cm 921.74 921.74<br />
Table 1: Design parameters of the HSI-RFQ.<br />
Figure 2: New RFQ electrodes, with new IRM.<br />
Electrodes and carrier rings<br />
July 2008<br />
fabrication, assembly<br />
- April 2009<br />
RF tuning (prelim. assembled) May 2009<br />
Re-assembly in beamline June 2009<br />
Beam-commissioning with argon July 2009<br />
Beam-commissioning with uranium,<br />
routine heavy ion high current operation<br />
since September 2009<br />
Table 2: RFQ upgrade schedule.<br />
Beam-commissioning started in July 2009 with Ar 1+ .<br />
For this an emittance measurement device was installed<br />
behind the RFQ. Transmission measurements showed a<br />
gain of 50 % compared to the previous RFQ-design: After
<strong>GSI</strong> SCIENTIFIC REPORT 2009 <strong>GSI</strong>-UPGRADE-ACC-02<br />
optimization up to 85% of 12.5 mA input beam current<br />
were transported and accelerated through the quadrupole<br />
quartet and the new RFQ.<br />
HSI RFQ Transmission / %<br />
100<br />
90<br />
80<br />
70<br />
60<br />
50<br />
40<br />
30<br />
20<br />
High Current Injector RFQ Argon Transmission<br />
Ar1+ Input Beam Current:<br />
RFQ old 13,5 mA<br />
RFQ new 12,5 mA<br />
10<br />
Working Point old 5.5 V, new 6.5 V<br />
0<br />
0 1 2 3 4 5 6 7 8<br />
RFQ Tank Voltage / Volts<br />
RFQ old Transmission<br />
RFQ new Transmission<br />
Figure 3: Measured transmission of the HSI-RFQ.<br />
As a consequence of the increased acceptance the<br />
measured RFQ emittance is larger. Compared to the results<br />
of the initial RFQ-commissioning in 1999 a two<br />
times higher transverse beam emittance was confirmed by<br />
high current beam emittance measurements.<br />
Figure 4: Ar 1+ high current HSI-emittances.<br />
Re-commissioning of the complete HSI (incl. reassembled<br />
Superlens and IH) with Ar 1+ showed the correct<br />
RFQ beam energy of 120.5 keV/u. The measured<br />
beam current of 8.5 mA Ar 1+ behind the HSI (at<br />
1.4 MeV/u, stripped 13mA Ar 10+ ) is a new world record,<br />
exceeding the old HSI record of 8.0 mA, even despite a<br />
lower input current (13 mA instead of 16 mA).<br />
Measurements with high current U 4+ -beam in September/October<br />
2009 gave maximum transmission values of<br />
80% through the quadrupole quartet and the RFQ (input<br />
beam current 6 mA U 4+ , LEBT settings optimized for<br />
max. transmission), resp. 70 % (input beam current<br />
11 mA). The transmission is higher than predicted from<br />
simulations with measured LEBT particle distributions,<br />
because the beam with big radius and divergence is not<br />
caught fully on the emittance grids.<br />
U 4+ Ar 1+<br />
2004 2009 2004 2009<br />
inp. beam curr. /mA 8.5 10 8 13<br />
�x/mm mrad (90% , 4*rms) 140 130 110 190<br />
�y/mm mrad (90% , 4*rms) 125 100 150 130<br />
X/Y / mm ±20/28 ±24/20 ±20/28 ±28/28<br />
X'/Y' / mrad ±12/20 ±12/25 ±18/15 ±16/20<br />
Table 3: Measured transverse emittances before QQ.<br />
U 4+ Ar 1+<br />
Beam current/ before 2009 before 2009<br />
Transmission upgrade<br />
upgrade<br />
Before QQ 12.4 mA 11 mA 13.5 mA 12.5 mA<br />
Behind RFQ 7.9 mA 7.5 mA 7.6 mA 9.5 mA<br />
Transm. RFQ 64 % 70 % 56 % 85 %<br />
Behind HSI 6.6 mA 6 mA 5.9 mA 8.5 mA<br />
Transm. HSI 50 % 60 % 44 % 56 %<br />
Table 4: HSI max. high current transmission.<br />
High current requirements for the HSI cannot be fulfilled<br />
with the existing LEBT. For this an upgrade of the<br />
LEBT is in preparation for 2010.<br />
HSI-LEBT Upgrade<br />
In the existing LEBT the switching magnet, the emittance<br />
measurement device and the quadrupole quartet will<br />
be replaced. Wider aperture diameters behind the switching<br />
magnet (150 mm instead of 100 mm) will allow the<br />
optimization of the beam matching to the RFQ. The ceramic<br />
vacuum chamber for the new switching magnet is<br />
designed (DN100CF vac pipe for the straight branch, aperture<br />
104 mm), a redesign of the magnet is in preparation.<br />
Vacuum chambers and grids for the new emittance<br />
measurement device are delivered (64 wires, 0.1 mm diameter,<br />
0.8 mm distance, 80 mm length), ordering of the<br />
slits (water cooled, 0.1 mm slit width, 80 mm length) and<br />
grids (47 wires each plane, 2 mm distance) on the basis of<br />
design studies is finished. The new quadrupole quartet (leff<br />
1 st quadrupole 76 mm, 2 nd to 4 th 225 mm each) will be<br />
delivered in August 2010. A steerer device, a beam current<br />
transformer and a vacuum valve will be replaced by<br />
larger ones.<br />
Compact LEBT<br />
Further improvements of the beam brilliance cannot be<br />
reached with the existing ion source branches. Therefore<br />
an additional straight-line branch with two superconducting<br />
solenoids is planned. One solenoid of this type (200<br />
mm warm bore diameter, max. 4 T, vacuum tube aperture<br />
diameter 180 mm) has already been delivered and tested<br />
successfully at the <strong>GSI</strong> high current ion source test bench.<br />
References<br />
[1] L. Dahl et al., proc. Linac 2006, p. 183,<br />
[2] A. Kolomiets, W. Barth et al., proc. Linac 2008,<br />
[3] L. Groening et al., Phys. Rev. ST Accel. Beams 11 094201,<br />
(2008)<br />
[4] A. Peters, P. Forck et al., proc. Linac 2004, p.13.<br />
[5] W. Barth et al, proc. Linac 2004, p. 246<br />
147
<strong>GSI</strong>-UPGRADE-ACC-03 <strong>GSI</strong> SCIENTIFIC REPORT 2009<br />
Introduction<br />
ThehighchargestateinjectorHLIattheUNILACprovidesmainlybeamsforthesuperheavyelementresearch<br />
(SHIP,TASCA).Highaveragebeamintensities,i.e. high<br />
dutyfactors,areprerequisite. FedbyanECRsource,the<br />
HLImeetstherequirementswell. Additionally,itisalso<br />
usedforrareisotopebeams.<br />
TheHLI–linaccomprisesaradiofrequencyquadrupole<br />
(RFQ)andanIHstructure. Whilethehighchargestate<br />
oftheionsfromtheECRsourcefacilitatestheacceleration,theexistingRFQwasfiguredouttobeabottleneck<br />
concerninghighdutyfactoroperation. Thereforeit was<br />
decidedfouryearsagotoreplaceitbyanewRFQ.This<br />
measureispartofanupgradeprogramincludingasecond,<br />
new28-GHzsuperconductingECRionsource[1].<br />
DesignofthenewRFQ<br />
ThenewRFQhastoaccelerateionswith A/q ≤ 6in<br />
cwoperation. Thedesigngoalwastoenablethiswiththe<br />
existingrfpoweramplifier(≤70kWaveragepower). For<br />
A/qupto8.5thedutycycleislimitedto50%.Moredetails<br />
aregivenintab.1.TheRFQstructureisshowninfig.1.<br />
Figure1:NewRFQduringfinalassembly(courtesyofG.<br />
Otto,<strong>GSI</strong>).<br />
148<br />
∗ p.gerhard@gsi.de<br />
Property Value<br />
Injection/extractionenergy[keV/u] 2.5/300<br />
RFfrequency[MHz] 108.48<br />
A/q(cw/max.)
<strong>GSI</strong> SCIENTIFIC REPORT 2009 <strong>GSI</strong>-UPGRADE-ACC-04<br />
Measurement of Space Charge Driven Resonances in the UNILAC Alvarez DTL<br />
L. Groening 1 , I. Hofmann 1 , W. Barth 1 , W. Bayer 1 , G. Clemente 1 , L. Dahl 1 , P. Forck 1 , P. Gerhard 1 ,<br />
D. Jeon 2 , M.S. Kaiser 1 , M. Maier 1 , S. Mickat 1 , T. Milosic 1 , D. Uriot 3 , and S. Yaramyshev, 1<br />
1 <strong>GSI</strong>, Darmstadt, Germany; 2 ORNL, Oak Ridge, TN, U.S.A., 3 CEA/Saclay, Gif-sur-Yvette, France<br />
Last years experiments aimed to the investigation of<br />
resonant transverse emittance growth for high intensity<br />
beams. The driving force is the self field of the beam's<br />
space charge.<br />
The first resonance is driven by similar beam envelope<br />
phase advances in the transverse and longitudinal dimension<br />
[1]. First theoretical investigations date back to<br />
1992 and avoiding this resonance is a design rule for all<br />
high intensity linac projects. Experimental confirmation<br />
was not achieved world-wide due to the leak of diagnostics,<br />
machine control, and beam matching. For a given<br />
experimental set-up the longitudinal phase advance �l is<br />
constant and the resonance is probed by varying the<br />
transverse phase advance �� using the quadrupole<br />
strength. Figure 1 plots the measured transverse emittance<br />
at the DTL exit as a function of the phase advance ratio.<br />
Additionally, results from computer simulations are<br />
shown being in good agreement with the measured data as<br />
well as with the underlying theoretical concepts. A detailed<br />
description of the experiment can be found in<br />
Ref. [2].<br />
Norm. Transv. rms Emitt. (mm mrad)<br />
0.40<br />
0.35<br />
0.30<br />
0.25<br />
0.20<br />
Experiment<br />
DYNAMION<br />
TraceWin<br />
0.0 0.5 1.0 1.5 2.0<br />
Initial Depressed Tune Ratio � || / ��<br />
Figure 1: Emittance as function of phase advance ratio.<br />
The second resonance is purely transverse and it is<br />
driven by the octupolar component of the polynom describing<br />
the beams transverse charge density. The corresponding<br />
field term scales as an octupole, namely � r 3 .<br />
This field component acts to the periodically focused<br />
beam as a perturbation and it is resonantly excited if the<br />
transverse phase advance becomes equal to 360°/(3+1),<br />
i.e. 90°. This resonance has been predicted about three<br />
decades ago [3]. Recent simulation studies [4] revealed<br />
that this resonance dominates the well-known envelope<br />
instability occurring at 90° as well [5]. Moreover, they<br />
revealed that this resonance might be measured using the<br />
UNILAC's Alvarez DTL.<br />
Figure 2 shows the measured emittance at the DTL exit<br />
as a function of the transverse phase advance. The predicted<br />
resonant increase at about 90° was observed and<br />
<strong>GSI</strong>Template2007<br />
has been confirmed with three different simulation codes.<br />
A characteristic feature of an octupolar resonance is the<br />
formation of four arms in the phase space distribution.<br />
This four-fold filamentation was measured as well at the<br />
UNILAC and it is displayed in Fig. 3.<br />
The described experiments (see [6] for details) are the<br />
first successful validation of resonant emittance growth in<br />
a linear accelerator world-wide. Since resonant phenomena<br />
along a linac are tiny perturbations, it requires a very<br />
stable and reliable operation of the UNILAC. The same<br />
applies to the diagnostic components.<br />
Norm. Transv. rms-Emitt. (mm mrad)<br />
0.40<br />
0.35<br />
0.30<br />
0.25<br />
0.20<br />
Experiment<br />
DYNAMION<br />
PARMILA<br />
TraceWin<br />
0.15<br />
40 60 80 100 120<br />
Transverse Phase Advance (deg)<br />
Figure 2: Emittance as function of transverse phase advance.<br />
Measurement<br />
Simulation<br />
Horizontal Vertical<br />
Horizontal Vertical<br />
Horizontal Vertical<br />
(a) �� = 63° (b) �� = 83°<br />
(c) �� = 102°<br />
± 15 mrad<br />
I / I max (%)<br />
0 - 5<br />
5 - 10<br />
10 - 20<br />
20 - 40<br />
40 - 100<br />
± 15 mm<br />
Figure 3: Phase space distributions at DTL exit.<br />
References<br />
[1] I. Hofmann et al., PRL 87, 034802 (2001).<br />
[2] L. Groening et al., PRL 103, 224801 (2009).<br />
[3] I. Hofmann et al., AIP Conf. Proc. No. 642, p. 248,<br />
(2002).<br />
[4] D. Jeon et al., PRST-AB 12, 054204 (2009).<br />
[5] I. Hofmann et al., Part. Accel. 13, 145 (1981).<br />
[6] L. Groening et al., PRL 102, 234801 (2009).<br />
149
<strong>GSI</strong>-UPGRADE-ACC-05 <strong>GSI</strong> SCIENTIFIC REPORT 2009<br />
Measurement of the Longitudinal Phase Space at UNILAC<br />
To deliver the required currents for FAIR an important<br />
goal is to improve the matching into the Alvarez section of<br />
the UNILAC. Besides simulated phase space data, crucial<br />
information about the beam parameters is provided by diagnostic<br />
devices. While there are several standard methods<br />
to access the four-dimensional transverse phase space information,<br />
the longitudinal degree of freedom is as important<br />
but an unequally more demanding measurement task.<br />
The current approach is based on the time-of-flight<br />
(TOF) measurement of single particles between two detectors<br />
(see Fig. 1), and constructing the longitudinal phase<br />
space via 2-dim histogramming using the arrival times at<br />
both detectors and UNILAC rf reference [1]. The energy<br />
information is extracted from the TOF between a MCP and<br />
a diamond detector, whereas the arrival time at the diamond<br />
with respect to the rf serves as a direct measure of the relative<br />
phase location between particles. Imposed by the limited<br />
distance (800 mm) between these detectors, a time resolution<br />
of only several tens of picoseconds is mandatory to<br />
resolve an rms energy spread of about 1% at 1.4 MeV/u.<br />
The TDC and discriminators are capable to provide a time<br />
resolution of about 50 ps rms. Additionally, signals from<br />
the diamond and MCP suffer from a broad pulse height<br />
spectrum and varying pulse shapes that significantly degrade<br />
time resolution.<br />
While the vertical projection of the longitudinal phase<br />
space distribution yields trustworthy bunch structure information,<br />
the limited energy resolution affects the measured<br />
size of the phase space, which results in an enlarged<br />
emittance ε and decreased covariance. Therefore<br />
the related correlation � �as<br />
described by the Twiss param-<br />
∆E<br />
eter α = −cov 〈E〉 , t /ε is smaller than expected from<br />
simulations and a plausible machine operation mode. To<br />
3<br />
Coulomb<br />
scattering at<br />
thin Ta target Collimator<br />
Gating Discriminators Amps<br />
Anode<br />
50<br />
T. Milosic 1 , P. Forck 1 , and D. Liakin 1,2<br />
1 <strong>GSI</strong>, Darmstadt, Germany; 2 ITEP, Moscow, Russia<br />
MCP<br />
2<br />
e -<br />
Diamond<br />
detector<br />
poly cryst.<br />
S 1<br />
Thin Al Al foil<br />
Figure 1: Single particles are detected indirectly at the<br />
MCP module (2) and directly at the diamond detector (1)<br />
whereas the UNILAC rf serves as timing reference (3).<br />
150<br />
Relative Energy Deviation<br />
Relative Energy Deviation<br />
0.08<br />
0.06<br />
0.04<br />
0.02<br />
0<br />
-0.02<br />
-0.04<br />
-0.06<br />
-0.08<br />
0.08<br />
0.06<br />
0.04<br />
0.02<br />
0<br />
-0.02<br />
-0.04<br />
-0.06<br />
-0.08<br />
a)<br />
Original Data (60k Events)<br />
-6 -4 -2 0 2 4 6<br />
Arrival time at Diamond detector [ns]<br />
-6 -4 -2 0 2 4 6<br />
Arrival time at Diamond detector [ns]<br />
[Twiss Parameter]<br />
α<br />
Correlation<br />
Relative Energy Deviation<br />
2.5<br />
2<br />
1.5<br />
1<br />
0.5<br />
0.08<br />
0.06<br />
0.04<br />
0.02<br />
0<br />
-0.02<br />
-0.08<br />
Original Data<br />
Vertical Fit<br />
Deconvolved<br />
10 20 30 40 50 60 70 80 90<br />
Cutoff [% Integral Intensity]<br />
Vertical Gauss Fit<br />
-0.04<br />
-0.06 Analytic Deconvolution<br />
d)<br />
b) c)<br />
-6 -4 -2 0 2 4 6<br />
Arrival time at Diamond detector [ns]<br />
Figure 2: a) Plain data from DAQ. b) Reconstructed phase<br />
space using Gaussian fits to energy degree of freedom.<br />
c) Analytic deconvolution with σi,dec =<br />
�<br />
σ 2 i,fit − σ2 res<br />
for each vertical slice i (see text). d) Correlation α for<br />
original, fitted and deconvolved phase space vs. integral<br />
cutoff levels.<br />
improve the systematic energy broadening, deconvolution<br />
methods were investigated in order to disentangle the error<br />
contribution from the original phase space data. In Fig. 2<br />
an example of the original and deconvoluted data is shown<br />
from a high current Argon beam (6.5 mA) recorded during<br />
the HIPPI campaign at <strong>GSI</strong> [2]. Statistical noise, off-center<br />
vagabonding particles and the intrinsic low count rates are<br />
severe issues concerning a deconvolution approach. Furthermore,<br />
no pulse response is available from experimental<br />
data due to the lack of a monochromatic beam. Thus<br />
the pulse response is deduced from a consideration of error<br />
contribution based on a Gaussian model denoted by σres.<br />
This permits us to perform an analytic deconvolution of the<br />
energy information when vertical slices are also fitted with<br />
an Gaussian parameterization as depicted in Fig. 2. A consistent<br />
deconvolution of the energy distribution is achieved<br />
even for noisy data. Moreover, the correlation α changes<br />
significantly and approaches the expected value.<br />
As an alternative to the TOF measurement preliminary<br />
investigations of the calorimetric properties of a monocrystalline<br />
diamond detector have been performed using an<br />
Am-243 source. Preliminary analysis shows an energy resolution<br />
of about 1% for α particles at several MeV. The<br />
detector has been installed and will be tested soon.<br />
References<br />
[1] T. Milosic, P. Forck, D. Liakin, “Longitudinal Emittance<br />
Measurement using Particle Detectors”, DIPAC’09, Basel,<br />
May 2009, p. 330.<br />
[2] High Intensity Pulsed Proton Injectors (HIPPI), Joint Research<br />
Activity (JRA3) in the framework of CARE.
<strong>GSI</strong> SCIENTIFIC REPORT 2009 <strong>GSI</strong>-UPGRADE-ACC-06<br />
Emittance Exchange due to Linear Coupling by Skew Quadrupole in SIS-18<br />
W. Daqa 1,2 , I. Hofmann 1,2 , V. Kornilov 1 , J. Struckmeier 1,2 , and O. Boine-Frankenheim 1,3<br />
1 <strong>GSI</strong>, Darmstadt; 2 Johann Wolfgang Goethe University, Frankfurt; 3 TU-Darmstadt, Darmstadt<br />
For high current synchrotrons and for the SIS18 operation<br />
as booster of the projected SIS100 it is important<br />
to improve the multi-turn injection efficiency. This can<br />
be achieved by coupling the transverse planes with skew<br />
quadrupoles, which can move the particles away from the<br />
septum. Linear betatron coupling due to skew quadrupole<br />
components in SIS18 including space charge effect was<br />
studied in an experiment using different diagnostic methods<br />
during the crossing of the difference coupling resonance.<br />
As an extension of previous study of linear coupling<br />
[1], we considered space charge effects in our measurement<br />
in August 06, 2009. We used 40Ar18+ coasting beam<br />
at injection energy 11.35 MeV, where the horizontal beam<br />
size was chosen such that ɛx ≤ Ay/2, where Ay is the<br />
vertical acceptance at injection, with ɛx/ɛy ≈ 5. The<br />
beam intensity was controlled via the UNILAC so we had<br />
Np ≈ 2.0×10⁹−1.5×10¹⁰ . The horizontal tune was set on<br />
Qx =4.26, then we performed a static vertical tune scan<br />
Qy =3.20 − 3.36 using SISMODI software. We switched<br />
on one skew quadrupole installed in the first sector of the<br />
SIS-18 lattice (S01KM3QS) with different strengths and<br />
tested its effect on the difference coupling stop band width<br />
for low and high intensity beam. Using a residual gas<br />
monitor we measured the RMS transverse emittance exchange.<br />
We concluded an overestimation of the transverse<br />
beam sizes which could be a result of the abrasion of the<br />
MCPs in the RGM. The actual beam size was corrected to<br />
σx = σxmeas/1.21 and σy = σymeas/1.26 to fulfill the invariance<br />
condition ɛx + ɛy =constant. In figure (1), we<br />
show the case with the natural coupling due to random roll<br />
errors in the normal quadrupoles. The large tune shift of<br />
the resonance center is due to systematic deviations in SIS-<br />
MODI software.<br />
We simulated the emittance exchange, where a KV particle<br />
distribution was generated and tracked in SIS18 triplet<br />
linear lattice using PARMTRA, which is a code developed<br />
at <strong>GSI</strong> [2]. The linear coupling was introduced by<br />
one skew quadrupole (thin lens) with a strength equivalent<br />
to the natural coupling strength. The RMS transverse<br />
emittances were computed turn by turn. Then we<br />
considered the averaged value to obtain figure (2). Space<br />
charge effects are: broadening the stop band width; reduction<br />
of the maximum emittance transfer (depending on the<br />
skew quadrupole strength); shifting of the resonance center<br />
above the single particle resonance as ɛx/ɛy > 1 [3]; and<br />
modification of the exchange curve so it becomes asymmetric.<br />
The coupled tunes were measured from Gaussian fitting<br />
of the Schottky noise spectrum where we identified the side<br />
RMS Transverse Emittance [mm.mrad]<br />
18<br />
16<br />
14<br />
12<br />
10<br />
8<br />
6<br />
4<br />
2<br />
0<br />
-0.1 -0.08 -0.06 -0.04 -0.02 0 0.02<br />
δ = Q x - Q y - 1 (Set Tunes)<br />
ε x -meas<br />
ε y -meas<br />
Figure 1: Emittance exchange measurement (06Aug2009) using<br />
residual gas monitor (RGM). The incoherent tune shift are<br />
ΔQx = −0.02, ΔQy = −0.05 with natural skew strength<br />
ksq = k0<br />
RMS Transverse Emittance [mm.mrad]<br />
18<br />
16<br />
14<br />
12<br />
10<br />
8<br />
6<br />
4<br />
2<br />
.<br />
SUM/2<br />
0<br />
-0.04 -0.03 -0.02 -0.01 0 0.01 0.02 0.03 0.04<br />
δ = Q x - Q y - 1<br />
ε x -PARMTRA<br />
ε y -PARMTRA<br />
(ε x +ε y )/2<br />
Figure 2: Emittance exchange simulation using PARMTRA. The<br />
incoherent tunes shift are ΔQx = −0.020, ΔQy = −0.047 with<br />
external skew quadrupole strength ksq =5× 10 −3 m −1<br />
.<br />
bands for the coupled motion. To estimate the number of<br />
turns for exchange from the measured beam loss we increased<br />
the injected turns, then we fixed the working point<br />
and changed the skew quadrupole strength. Therefore, we<br />
used the fast current transformer. The results can be used<br />
for further investigation on how to use linear coupling to<br />
improve the machine injection efficiency.<br />
References<br />
[1] W. Daqa , V. Kornilov, I.Hofmann, O. Boine-Frankenheim,<br />
Acc-note-2009-003, <strong>GSI</strong>-Darmstadt.<br />
[2] J. Struckmeier, <strong>GSI</strong>-ESR-87-03, <strong>GSI</strong>-Darmstadt.<br />
[3] M. Aslaninejad and I. Hofmann, Phys. Rev. STAB, 6, 124202<br />
(2003).<br />
151
<strong>GSI</strong>-UPGRADE-ACC-07 <strong>GSI</strong> SCIENTIFIC REPORT 2009<br />
Simulation and observation of the space charge induced multi-stream<br />
instability of linac micro bunches in the SIS-18 synchrotron<br />
S. Appel 1 , O. Boine-Frankenheim 2 , and Th. Weiland 1<br />
1 TEMF, TU Darmstadt, Germany; 2 <strong>GSI</strong>, Darmstadt, Germany<br />
For the upgrade of the SIS-18 synchrotron it is of importance<br />
that the initial momentum spread of the injected<br />
coasting beam does not exceed the limit set by the rf bucket<br />
area. The lower limit is determined by microwave instabilities<br />
which cause a sudden increase of the momentum<br />
spread below a threshold momentum spread.<br />
For a coasting Ar 18+ beam in the SIS-18 the measured momentum<br />
spread as a function of the number of injected<br />
turns is shown in Fig.1. The momentum spread has been<br />
obtained from different Schottky bands.<br />
During the transverse multi-turn injection the SIS-18 is<br />
filled with micro bunches from the UNILAC linac at 36<br />
MHz. For low beam intensities the micro bunches debunch<br />
within a few turns and form a coasting beam with<br />
a Gaussian-like momentum spread distribution. With increasing<br />
intensity we observe a few 100 turns after injection<br />
persistent current fluctuations and an accompanying<br />
pseudo-Schottky spectrum.<br />
The Schottky spectrum should be used to routinely measure<br />
the momentum spread (see Fig.1) and revolution frequency<br />
directly after injection. Therefore is is important to understand<br />
the origin of the pseudo-Schottky spectrum.<br />
In [1] it is shown that the multi-stream instability induced<br />
by the space charge impedance leads to phase space turbulence<br />
with strong coherent fluctuation. The dispersion<br />
relation is<br />
qI0η<br />
−i<br />
2πγβ 2mc2 Zsc<br />
n<br />
n 2 ω 2 0<br />
M<br />
M�<br />
j=1<br />
1<br />
= 1, (1)<br />
(ω − kvj)<br />
from which the critical number of filaments results as<br />
Mthr = 32<br />
πUsc<br />
where Zsc is the space charge impedance, vj the velocity<br />
of the jth filament, Usc the space charge parameter and σ<br />
the momentum spread.<br />
The saturation of the instability causes persistent current<br />
fluctuations with a broad frequency spectrum. Such a fast<br />
transition to a broad frequency spectrum was observed in<br />
the SIS-18 shortly after injection of N = 10 9 Ar 18+ ions<br />
(Fig. 2) as well as in simulations. The transition occurs<br />
exactly after Mthr filaments have been generated.<br />
A simulation code has been developed which reproduces<br />
the important aspects of the observed instability, like the<br />
threshold number of filaments and the broadness of the<br />
spectrum after saturation. The code will be used to estimate<br />
the effect of other ring impedances on the beam momentum<br />
and on its spread.<br />
152<br />
(2)<br />
Figure 1: Rms momentum spread as a function of the<br />
number of injected turns measured from different Schottky<br />
bands. Approximately 10 9 Ar 18+ ions are injected per<br />
turn. A possible reason for the obtained increase are microwave<br />
instabilities.<br />
Figure 2: Measured frequency spectrum from N = 10 9<br />
Ar 18+ ions injected into SIS-18. The dashed line indicates<br />
the duration after which the broad frequency spectrum develops<br />
in the simulation. The solid line present the SIS-18<br />
beam pipe cut-off frequency.<br />
In addition the minimum momentum spread achievable in<br />
SIS-18 as well as the characteristics of the pseudo-Schottky<br />
noise will be analyzed using the code together with the experimental<br />
data.<br />
Experiments with the new SIS-18 broadband current transformer<br />
a planed for the upcoming beam times.<br />
References<br />
[1] I. Hofmann, <strong>GSI</strong> Note March 1989<br />
[2] S. Appel et al., DPG-Tagung München 2009
<strong>GSI</strong> SCIENTIFIC REPORT 2009 <strong>GSI</strong>-UPGRADE-ACC-08<br />
High intensity resonance driven beam loss and emittance growth in the SIS18<br />
synchrotron<br />
G. Franchetti, O. Chorniy, I. Hofmann, W. Bayer, F. Becker, O. Boine-Frankenheim, P. Forck, T.<br />
Giacomini, M. Kirk, T. Mohite, C. Omet, A. Parfenova, P. Schütt, <strong>GSI</strong>, Darmstadt, Germany<br />
In this report we give a short summary of the results of<br />
the S317 experiment which took place in SIS18 in the years<br />
2006-2008. A longer report is to be found in a future journal<br />
publication [1]. This experiment had the goal to study<br />
experimentally the long term effects arising in a high intensity<br />
bunch stored in a synchrotron. This type of effects are<br />
of relevance in the SIS100 U +28 scenario [2] where high<br />
intensity bunches have to survive for a storage time of 1<br />
second. The beam physics explored derives from the combination<br />
of space charge and synchrotron motion during<br />
the long term storage in presence of lattice nonlinearities,<br />
which creates a challenge on beam dynamics and computer<br />
code prediction necessary for FAIR verification studies.<br />
The study of the high intensity effects required the excitation<br />
of a controlled resonance and the preparation of a high<br />
quality beam, together with the analysis of the transverse<br />
and longitudinal profile with time. Transverse profiles are<br />
measured with the intra-beam profile monitor (IPM) [3],<br />
while the longitudinal profile is measured with a beam position<br />
monitor. By using the beta functions at the position<br />
of the IPM, βx = 6.28 m, βy = 7.8 m, and the measured<br />
beam distribution, the transverse rms emittances are calculated.<br />
Previous studies in SIS18 (see Ref. [4]) provided an<br />
experimental resonance chart, which reveal several 2nd and<br />
3rd order resonances excited by machine errors. From this<br />
study we set the resonance 3Qx = 13 as the reference resonance<br />
for the experimental scans. In the S317 campaigns<br />
an ion beam of 40 A 18+ was used. After injection the beam<br />
is left to coast for 100 ms as prior to being bunched (via an<br />
external RF cycle) in 10 ms with a final RF voltage of 4 kV.<br />
This bunch, characterized by a bunching factor BF = 0.37<br />
and (δp/p)rms = 1.3×10 −3 , is stored for 0.9 seconds, then<br />
adiabatically de-bunched in 100 ms (before a final bunching<br />
with acceleration and extraction). Under this operational<br />
scheme we explored the beam response as a function<br />
of Qx. The average peak space charge tune-shift directly<br />
measured from the IPM data yields ∆Qx ≃ −0.04, and<br />
∆Qy ≃ −0.06. In Fig. 1a we show the experimental finding.<br />
The red stripe marks the position of the beam loss<br />
stop-band measured with a low intensity coasting beam.<br />
We find as in the CERN-PS experiment that a region of<br />
beam loss (red curve) is located on the right side of the resonance.<br />
For a comparison of the two experiments see in<br />
Ref. [5]. In absence of beam loss (Qx ∼ 4.3425) an emittance<br />
growth is observed (Fig. 1a black curve): this result<br />
is consistent with trapping/scattering regimes discussed in<br />
[5]. The green curve shows the relative bunch rms length,<br />
which becomes shorter closer to the maximum beam loss<br />
at Qx = 4.3365. In Fig. 1b are shown the simulation result<br />
from the computer modeling of the S317. We retrieve the<br />
[1]<br />
[1]<br />
2<br />
1.5<br />
1<br />
0.5<br />
0<br />
2<br />
1.5<br />
1<br />
0.5<br />
0<br />
a)<br />
b)<br />
εx / εx0 I / I0 z / z0 4.33 4.35 4.37<br />
εx / εx0 I / I0 z / z0 4.33 4.35 4.37<br />
Q x<br />
Qx Figure 1: Experimental transverse-longitudinal beam response<br />
to the long term storage as function of working<br />
points around the third order resonance (top); Simulation<br />
results of the experiment (bottom).<br />
essential feature of the emittance increase and beam loss as<br />
well as of the bunch shortening. Due to the unavoidable uncertainties<br />
in the experimental data, the simulations underestimate<br />
the long term beam loss and overestimate the emittance<br />
increase. The understanding of the single RF high<br />
intensity beam behaviour set the ground for experimental<br />
studies with dual RF for mitigating trapping/scattering negative<br />
effects. We thank the support of P. Spiller.<br />
References<br />
[1] G. Franchetti et al., submitted to Phys. Rev. ST-AB.<br />
[2] P. Spiller et al., Proc. of EPAC 2008, p. 298, MPOC100.<br />
[3] T. Giacomini et al., Proc. of BIW, Knoxville, USA, 2003.<br />
[4] G. Franchetti, P. Schütt, et al., <strong>GSI</strong>-Acc-Note-2005-02-001.<br />
[5] G. Franchetti, et al., Proc. of PAC 2009.<br />
153
<strong>GSI</strong>-UPGRADE-ACC-09 <strong>GSI</strong> SCIENTIFIC REPORT 2009<br />
154<br />
<strong>GSI</strong>Template2007<br />
Status of the SIS 18 Vacuum Upgrade*<br />
M.C.Bellachioma, M.Bender, J. Cavaco, H. Kollmus, A. Kraemer, J. Kurdal, and H. Reich-Sprenger<br />
<strong>GSI</strong>, Darmstadt, Germany.<br />
In the context of the technical developments for the<br />
construction of the Facility for Antiproton and Ion Research<br />
at <strong>GSI</strong>, an intensive programme for the vacuum<br />
upgrade of the existing heavy ion synchrotron (SIS 18)<br />
was started in 2005, with the aim to improve the beam<br />
lifetime and the beam intensity. To reach these purposes<br />
the installation of NEG coated dipole and quadrupole<br />
chambers was foreseen, and additionally to overcome the<br />
dynamic vacuum instability a collimation system<br />
equipped with thin film coated absorbers was designed<br />
and commissioned.<br />
The production of the thin film getter was carried out in<br />
two cylindrical magnetron sputtering facilities described<br />
in details in Ref. [1]. The surface chemical composition<br />
and the good activation behaviour of the produced thin<br />
films (≈ 1μm thick) were proved at CERN and at the<br />
Magdeburg University by X-ray Photoelectron Spectroscopy<br />
(XPS). Considering that the vacuum chambers<br />
mounted in accelerators undergo several ventingactivation<br />
cycles, a deep investigation on the NEG ageing<br />
was performed last year at <strong>GSI</strong> by Elastic Recoil Detection<br />
Analysis (ERDA) [2]. In each activation cycle an<br />
identical quantity of oxygen is dissolved in the film bulk.<br />
However heating at temperatures lower than 250°C (as<br />
performed for the <strong>GSI</strong> coated chambers) does not allow a<br />
uniform oxygen concentration to be reached in the film<br />
and, as a consequence, oxygen atoms are settled in the<br />
film to form a concentration profile with the maximum<br />
close to the surface (see fig.1) which finally leads to accelerated<br />
performance degradation. The film degradation<br />
can be also explained in terms of C accumulation on the<br />
surface; in effect this element needs a higher heating temperature<br />
to be dissolved in the film bulk [3]. An abrupt<br />
reduction of the pumping speed was observed for thin<br />
coatings (0.25μm) after about 12 cycles when heating at<br />
200°C [4].<br />
Figure 1: The number of activation cycle is plotted from<br />
light to dark colour, carbon in red and oxygen in blue.<br />
* Work supported by EU design study, DIRAC-PHASE-<br />
1 RP6 SIS18-2 contract No. 515876.<br />
# cee@aps.anl.gov<br />
In parallel to the production and characterisation of the<br />
thin film getters an ion catcher system was designed and<br />
commissioned to guarantee that the loss of the charge<br />
exchanged particles behind the dipole chambers of the<br />
SIS 18 occurs on a low desorbing material and in a high<br />
pumping environment (assured by a NEG thin film).<br />
Lowest desorption was observed for gold coated copper<br />
targets, where a thin nickel film between copper and gold<br />
avoid diffusion of the materials into each other during the<br />
standard UHV bakeout. For this purpose a Ni film thickness<br />
around 200nm is sufficient [2, 5].<br />
Initially two geometries were realized: a wedge and a<br />
<strong>block</strong> shaped absorber. The first one, which separates the<br />
region where the losses occur from the circulating beam,<br />
has the disadvantage that the particles hit the absorber<br />
under grazing incident causing high desorption. The second<br />
one, which can be placed in the correct position by a<br />
linear motion feedthrough guarantees instead perpendicular<br />
incident with the disadvantage of an open geometry.<br />
Experiments have shown [5] that the <strong>block</strong> shaped absorber<br />
has a lower desorption yield on the level of 25<br />
molecules per incident ion. Therefore it represents the<br />
favourite solution for the ion catcher system.<br />
At the end of 2008 two ion catcher prototypes, 14<br />
coated dipole chambers and one quadrupole chamber<br />
were implemented in the SIS18. First experiments to<br />
evaluate the vacuum upgrade achievement showed a clear<br />
improvement in achievable U 28+ beam lifetime caused by<br />
the upgraded UHV system [6].<br />
During the 2 upgrade shutdowns in 2009 all the remaining<br />
coated dipole and quadrupole (except for the one in<br />
S11) chambers and ten ion catcher were mounted in the<br />
accelerator. In summary, during the upgrade shutdowns<br />
from 2006 to 2009 24 dipole magnet chambers, 11 long<br />
quadrupole chambers, 5 short quadrupole chambers, 10<br />
collimator chambers and 5 straight vacuum chambers<br />
were replaced by NEG-coated UHV chambers, which<br />
corresponds to app. 65% of the SIS 18 circumference.<br />
Commissioning of the UHV system upgraded will be performed<br />
in the beginning of 2010. Detailed measurements<br />
of the improved performance will follow in 2010.<br />
References<br />
[1] M.C.Bellachioma et al., Vacuum 82 (2008), p.435-<br />
439.<br />
[2] M.C.Bellachioma et al., Proceedings of PAC09,<br />
Vancouver, BC, Canada.<br />
[3] P.Chiggiato and P.Costa Pinto, Thin Solid Film 515,<br />
(2006), p.382-388.<br />
[4] P.Chiggiato et al., unpublished, to be submitted to<br />
J.Vac.Sci.Technol. A.<br />
[5] Kollmus et al., this <strong>GSI</strong> Annual Report<br />
[5] G.Weber et al., Phys.Rev.STAB, 12, 084201 (2009).
<strong>GSI</strong> SCIENTIFIC REPORT 2009 <strong>GSI</strong>-UPGRADE-ACC-10<br />
Measurement of the acceptance of SIS-18 by means of a transverse RF beam<br />
excitation<br />
S. Sorge, G. Franchetti, and A. Parfenova, FAIR-AT, <strong>GSI</strong>, Darmstadt, Germany<br />
INTRODUCTION<br />
We present the results of a measurement of the acceptance<br />
of SIS-18. The need for such an experiment particularly<br />
arises from the usage of the <strong>GSI</strong> synchrotron SIS-18<br />
as a booster within the FAIR project [1, 2] including regular<br />
high-current operation. In this regime, an uncontrolled<br />
beam loss in the pipe can lead to vacuum degradation and<br />
irradiation of the machine. A precise knowledge of the<br />
acceptance will help to optimise SIS-18 to reduce particle<br />
loss.<br />
Several experiments, which used diffusion, had been performed<br />
at different accelerators to measure the acceptance<br />
or the dynamic aperture. Here, the time required for the<br />
beam edge to reach the aperture was measured, see e.g.<br />
[3, 4]. Unfortunately, the estimation of this time is unprecise<br />
because a detailed knowledge of the initial beam<br />
size is necessary which translates in a large uncertainty in<br />
the derived acceptance. In order to avoid this uncertainty<br />
we study the evolution of the particle loss after the beam<br />
edge has reached the aperture.<br />
METHOD<br />
To determine the acceptance ǫlim of SIS-18, we excite a<br />
coasting heavy ion beam using the BTF exciter leading to<br />
an increase of the transverse beam width. When the beam<br />
width exceeds the limiting aperture, particle loss starts to<br />
occur. It can be shown that after a certain time the beam<br />
shape and the particle loss do no longer depend on the initial<br />
conditions. From this moment, the beam current will<br />
follow an exponential decrease entirely determined by the<br />
machine parameters and the excitation. This decrease can<br />
be modelled using a tracking algorithm. Here, we use the<br />
lattice parameters based on a MAD-X calculation and a realistic<br />
RF signal of the BTF exciter,<br />
U(t) = Ua sin(2πfCt + φ0(t)), (1)<br />
[5], where fC is the carrier frequency being adjusted to<br />
the fractional part of the betatron frequency. φ0 is a phase<br />
jumping between the values 0, π with a probability of 50 %<br />
and the time TS = 1/fS between two possible jump times.<br />
fS is the half width of the corresponding power spectrum.<br />
Within a trial-and-error procedure, we calculate the particle<br />
loss where ǫlim is varied until a computed curve is<br />
found which fits well the measured one.<br />
PARAMETERS USED AND RESULTS<br />
The experiments were done with a Ta 61+ beam initially<br />
consisting of 10 9 ions at the extraction energy<br />
E = 100 MeV/u. The working point was (νx, νy) =<br />
(4.17, 3.29). An RF signal with an amplitude voltage<br />
Ua = 28 V was applied. For technical reasons, only a vertical<br />
excitation and so, the measurement of the vertical acceptance,<br />
was possible. Measurements with fS = 0.01/T0<br />
and fS = 0.005/T0, respectively, were performed. The<br />
resulting values for the vertical acceptance were ǫlim =<br />
46 mm mrad and ǫlim = 45 mm mrad, respectively [6].<br />
A measured curve and a calculated one for the larger width<br />
of the exciter spectrum are shown in figure 1. Within an<br />
I(t) / I max<br />
1,2<br />
1<br />
0,8<br />
0,6<br />
0,4<br />
0,2<br />
measured<br />
calc.<br />
0<br />
0 0,5 1<br />
t (s)<br />
1,5 2<br />
Figure 1: Normalised current measured and calculated for<br />
E = 100 MeV/u, Ua = 28 V, fS = 0.01/T0, and ǫlim =<br />
46 mm mrad.<br />
error analysis, the maximum uncertainty for ǫlim has been<br />
estimated to 13 %.<br />
REFERENCES<br />
[1] P. Spiller and G. Franchetti, ”The FAIR accelerator project at<br />
<strong>GSI</strong>”, NIM A 561 (2006) 305-309.<br />
[2] ”An International Accelerator Facility for Beams of Ions and<br />
Antiprotons”, Conceptual design report, <strong>GSI</strong> Darmstadt, May<br />
2006, Section 3, ”The Facility”,<br />
http://www.gsi.de/<strong>GSI</strong>-Future/cdr.<br />
[3] X. L. Zhang, V. Shiltsev, and C. Y. Tan, ”Tevatron admittance<br />
measurement”, Proc. of 2005 Particle Accelerator Conference,<br />
Knoxville, Tennessee<br />
[4] X. Altuna et al., ”The 1991 dynamic aperture experiment at<br />
the CERN SPS”, AIP Conf. Proc., No. 255, p. 355 (1991)<br />
[5] M. Kirk and P. Moritz, ”Noise excitation parameters for the<br />
SIS-18 RF-KO excitation”, <strong>GSI</strong> internal note, <strong>GSI</strong> 2006<br />
[6] S. Sorge, G. Franchetti, and A. Parfenova, ”Measurement of<br />
the acceptance by means of a transverse beam excitation with<br />
RF noise”, submitted to Phys. Rev. ST-AB.<br />
155
<strong>GSI</strong>-UPGRADE-ACC-11 <strong>GSI</strong> SCIENTIFIC REPORT 2009<br />
Status of the SIS18 Upgrade Program and<br />
Progress in Acceleration of Intermediate Charge State Heavy Ions<br />
P. Spiller, U. Blell, L. Bozyk, H. Eickhoff, P. Hülsmann, H. Klingbeil, H. Kollmus, P. Puppel,<br />
INTRODUCTION<br />
In order to reach the desired FAIR [1] intensities for heavy<br />
ions, SIS18 has to be operated with intermediate charge states<br />
[2,3]. Operation with intermediate charge state heavy ions at<br />
the intensity level of about 10 11 ions per cycle has never been<br />
demonstrated elsewhere and requires a dedicated upgrade program.<br />
Such an upgrade program dedicated to the goal of minimizing<br />
the ionization beam loss [4] and stabilizing the dynamic<br />
residual gas pressure has been defined in 2005. So far, a major<br />
part of this upgrade program has been realized and a significant<br />
increase of the accelerated number of intermediate charge state<br />
heavy ions could be reached.<br />
STATUS OF THE UPGRADE PROGRAM<br />
Six major tasks of the upgrade program have been summarized<br />
and are realized in the frame of an EU FP6 funded construction<br />
program [5]. The tasks and their present status are<br />
summarized in Table 1.<br />
Table 1: The six upgrade tasks of the EU FP6 funded SIS18<br />
construction program and their present status.<br />
New injection system for injection of U 28+<br />
beams at 11.4 MeV/u with larger acceptance,<br />
diagnostics and protection equipment [6]<br />
New NEG coated dipole and quadrupole<br />
chambers for strong distributed pumping<br />
Ion catcher system for ionization beam loss to<br />
minimize the effective gas desorption [7]<br />
New h=2 acceleration cavity for fast acceleration<br />
in a two harmonic bucket<br />
New TK stripper system for high charge state<br />
operation<br />
Fast residual gas profile monitor for turn by<br />
turn beam profile measurements<br />
H. Ramakers, H. Reich-Sprenger<br />
<strong>GSI</strong> Darmstadt, Germany<br />
Completed<br />
Completed<br />
Completed<br />
Ongoing<br />
Completed<br />
Ongoing<br />
The new power grid connection of the <strong>GSI</strong> pulse power network,<br />
which has been completed in 2006, enables ramping of<br />
SIS18 with high ramp rates without constrains. High ramp rates<br />
are significantly contributing to the goal of minimizing the<br />
ionization beam loss and stabilising the dynamic residual gas<br />
pressure at intermediate charge state operation.<br />
STATUS OF INTERMEDIATE CHARGE<br />
STATE, HEAVY ION OPERATION<br />
First experiments with high intensity, intermediate charge<br />
state heavy ion beams have been performed in 2001. At this<br />
time, most of the injected 10 10 U 28+ -ions have been lost by<br />
ionization in the residual gas within a few hundred milliseconds<br />
(Figure 1). Fast pressure bumps initiated by initial systematic<br />
beam loss, drove a strong residual gas pressure dynamic, which<br />
itself has amplified this loss process. Meanwhile, the ionization<br />
beam loss could significantly been reduced and acceleration<br />
156<br />
and extraction of about 10 10 ions has been demonstrated with<br />
U 27+ and Ta 24+ ions. Figure 1 shows the intensity profile in an<br />
acceleration cycle with U 28+ and U 27+ beams in 2001 and 2009.<br />
Figure 1: SIS18 acceleration cycle with intermediate charge<br />
state Uranium ions in 2009 and 2001. Beam loss by ionization,<br />
which is by far the dominating loss mechanism, could be significantly<br />
reduced and the number of extracted ions increased<br />
by a factor of 70.<br />
The following measures have contributed to this progress:<br />
� Injection at higher energy (11.4 MeV/u instead of 7.1<br />
MeV/u with lower ionization cross section.<br />
� Acceleration with higher ramp rates (4 T/s instead of 1.3<br />
T/s) and correspondingly shorter cycle times<br />
� Careful optimization of the acceleration cycle in terms of<br />
systematic beam loss at multi turn injection and RF capture<br />
loss<br />
� At the time of the machine experiments the UHV upgrade<br />
and the set-up of the scraper system was only partially<br />
completed and have to a certain extend contributed to the<br />
stabilization of the vacuum pressure.<br />
Further improvement has been achieved in the time averaged<br />
number of accelerated heavy ions. While the progress in accelerated<br />
Ta-ions per cycle could only be achieved with breaks of<br />
9 seconds in between two cycles, the breaks at the Uranium run<br />
could be reduced to one second only.<br />
REFERENCES<br />
[1] P. Spiller, “FAIR at <strong>GSI</strong>”, Proc. of HB2006, (2006)24<br />
[2] P. Spiller et al, Proc. of PAC09 (2010)<br />
[3] C. Omet et al, Proc of PAC07 (2008)1416<br />
[4] G. Weber et al, Phys RevSTAB.12,084201 (2009)<br />
[5] Description of work, DOW_CNI-515876_20050705<br />
[6] U. Blell et al, Proc. of PAC07 (2008)167<br />
[7] C. Omet et al, New Journal of Physics 8 (2006)284
<strong>GSI</strong> SCIENTIFIC REPORT 2009 <strong>GSI</strong>-UPGRADE-ACC-12<br />
Beam Tests of the Novel Ionization Profile Monitor*<br />
T. Giacomini 1 , C. Böhme 2 , J. Dietrich 2 , P. Forck 1 , S. Kamerdzhiev 2 , G. de Villiers 3<br />
1 2 2 1 2 3<br />
T. Giacomini , C. Böhme , J. Dietrich , P. Forck , S. Kamerdzhiev , G. de Villiers<br />
1 2 3<br />
<strong>GSI</strong>, Darmstadt, Germany; COSY, Jülich, Germany, iThemba Labs, South South Africa Africa<br />
The new Ionization Profile Monitor IPM is is intended to<br />
provide fast fast and reliable non-destructive beam profile<br />
measurements at the existing synchrotron and storage ring<br />
as well as the future FAIR machines [1]. It It will will provide<br />
two different readout techniques, techniques, a fast readout mode on a<br />
turn-by-turn basis with 1 mm resolution resolution and, and, secondly, a<br />
high resolution mode of 100 Profiles/s Profiles/s with 0.1 mm mm resolution.<br />
The new IPM will be able to detect detect both, both, ions and<br />
electrons. The ionisation products are guided by a transverse<br />
electric field to a position sensitive MCP-PS detector<br />
(Multi-Channel-Plate plus Phosphor Screen). For the<br />
high spatial resolution resolution mode residual gas ions are detected,<br />
while while detection of electrons is required to allow<br />
for fast turn-by-turn profile measurements.<br />
Figure 1: Photograph of the electrical field box<br />
Fast mode measurements are performed using a multichannel<br />
photomultiplier. To overcome distortions of the<br />
measured profiles due to the space charge effect during<br />
residual gas electron detection, a guiding magnetic field<br />
in parallel to the electric field is necessary. Fig. 1 shows<br />
the design of electrical field box of the IPM prototype for<br />
one beam plane built at <strong>GSI</strong> and installed for tests in the<br />
COSY facility in Jülich. The device showed excellent<br />
performance, for details see [2]. The test installation in<br />
Jülich is not equipped with a magnet; hence only ion detection<br />
technique can be applied.<br />
The CCD cameras are read out by a LabView server application<br />
running on a PXI-based front end which is remote<br />
controlled by a PC client program. Both, the server<br />
and client applications were developed by a commercial<br />
partner. The data acquisition system produces permanently<br />
beam profiles from beam injection until extraction<br />
with 50 profiles per second. Additionally, pre-processed<br />
data, like profile integral, beam position and beam width<br />
are presented to the user. As an example for the COSY<br />
test measurements Figure 2 shows the fast evolution of<br />
* Work supported by EU, EURONS contract No. 515876.<br />
# cee@aps.anl.gov<br />
<strong>GSI</strong>Template2007<br />
the horizontal profile of a polarized proton beam during<br />
injection and acceleration.<br />
Beam intensity [arbitrary units]<br />
40<br />
35<br />
30<br />
25<br />
20<br />
15<br />
10<br />
5<br />
0<br />
0 20 40 60 80 100<br />
Horizontal coordinate [mm]<br />
Injection<br />
Flat top<br />
Figure 2: Evolution of the horizontal proton beam profile<br />
injection to acceleration to 1.343 GeV/c, 3·10 9 polarized<br />
protons, time span 2 s.<br />
The design and calculations of this particular magnet device<br />
were another important step within the IPM project.<br />
The magnet openings are as large as 540 mm because the<br />
magnetic field is applied outside of the vacuum tank. Due<br />
to the restricted space in the SIS the device length was<br />
limited to 2.5 m. The need of corrector magnets lead to<br />
the configuration shown in Figure 3. The inner magnets<br />
are the main dipoles the outer magnets are the correctors<br />
as required for a closed beam bump.<br />
Figure 3: Magnet Design, 2 Main Dipoles, 2 Correctors<br />
Outlook<br />
The assembling process starts in January 2010 and insertion<br />
into SIS18 is planned for winter 2010. The magnetic<br />
system is presently being designed in collaboration<br />
with iThemba LABS, South Africa. A slightly different<br />
IPM version without magnetic field will be inserted into<br />
ESR in June 2010.<br />
References<br />
[1] M. Schwickert et al., “Beam Diagnostic developments<br />
for FAIR”, Proc. DIPAC09, Basel (2009).<br />
[2] T. Giacomini et al., “Development of a residual gas<br />
profile monitor with high resolution and fast readout”,<br />
Proc. BIW04, Knoxville (2004).<br />
157
<strong>GSI</strong>-UPGRADE-ACC-13 <strong>GSI</strong> SCIENTIFIC REPORT 2009<br />
158<br />
<strong>GSI</strong>Template2007<br />
Chemical stripping of bulk saturated NEG coatings<br />
M. Wengenroth 1 , H. Kollmus 1 , M. C. Bellachioma 1 , S. Sievers 2 , J. Conrad 2 , M. Bender 1 ,<br />
and H. Reich-Sprenger 1<br />
1 <strong>GSI</strong>, Darmstadt, Germany; 2 TU, Darmstadt, Germany<br />
Introduction<br />
In the recent years the installation of non-evaporable<br />
getter (NEG) coated dipole and quadrupole chambers at<br />
the <strong>GSI</strong> heavy ion synchrotron (SIS 18) have been carried<br />
out and ware completed in January 2010. The NEG<br />
coated chambers was part of different upgrade activities<br />
of the existing UHV system [1]. Those non-evaporable<br />
thin film getters, consisting of Ti–Zr–V, are deposited<br />
onto the vacuum chambers using three magnetron sputtering<br />
facilities built at <strong>GSI</strong>, each fulfilling different geometric<br />
shapes and dimensions. A detailed description of the<br />
production and the functional principle is given in<br />
Ref [1]. In brief, after coating and activation a highly<br />
chemical reactive surface is present in the vacuum system<br />
getting dissociated residual gas components by means of<br />
oxidation, nitration and carbonisation of the surfaces metallic<br />
constituents. The capacity of the NEG surface is<br />
approximately one monolayer for CO and CO2 (10 15 particles<br />
per cm 2 ). In the environment of the SIS18 the operation<br />
time of an activated NEG surface is typically<br />
longer compared to the venting cycle time due to maintenance.<br />
The live time capacity of a 1 µm NEG thin film is<br />
limited to 30 – 50 reactivations [2].<br />
After the bulk of the NEG film is completely saturated,<br />
it has to be stripped of the vacuum chamber before applying<br />
new NEG coating. Industrial stainless steel pickling<br />
utilizing solutions containing nitric and hydrofluoric acid<br />
similar to buffered chemical polishing (BCP) [3] has<br />
proven to work on thick walled chambers (>2 mm) [4] but<br />
is not feasible for delicate dipole and quadrupole chambers<br />
of only 0.3 mm wall thickness because of nonuniformities<br />
especially at welded joints. Therefore, an<br />
alternative method was proven and will be described in<br />
the following.<br />
Experimental procedure<br />
Briefly, the chemical material removal is obtained by<br />
an oxidation of the metallic constituents through the nitric<br />
acid and the dissolution of these oxides by the hydrofluoric<br />
acid. Performing those steps sequentially will considerably<br />
reduce the risk of damaging a delicate chamber<br />
permanently. Accordingly NEG coated samples have<br />
been treated at the cleaning facility for superconducting<br />
niobium RF cavities of S-DALINAC (Superconducting<br />
Darmstadt Linear Accelerator). The oxidation is done by<br />
immersing the samples into nitric acid (65 %) for<br />
5 minutes followed by the removal of the oxides by immersing<br />
into hydrofluoric acid (40 %) for 1 minute. Five<br />
coated samples have been treated employing the above<br />
sequence one to five times.<br />
Measurements<br />
The results of the etching were investigated using proton<br />
Rutherford Backscattering Spectroscopy (RBS) at the<br />
ion beam analysis department of the Forschungszentrum<br />
Dresden-Rossendorf and shown in Fig. 1, were the energy<br />
distribution of the backscattered protons is displayed.<br />
Highest proton energies are achieved for collision with Zr<br />
and only observed for the untreated sample (compare red<br />
line in Fig. 1). This means that after the first treatment the<br />
approx 1 µm NEG film was already completely removed.<br />
counts<br />
1000<br />
100<br />
1. treatment<br />
2. treatment<br />
3. treatment<br />
4. treatment<br />
5. treatment<br />
NEG<br />
10<br />
600 700 800<br />
energy [arb. units]<br />
Figure 1: The energy distribution of the backscattered<br />
protons shows the highest energies from collisions with<br />
Zr only for the untreated NEG sample.<br />
Conclusion<br />
A method of stripping a saturated NEG film from thin<br />
wall chambers has been proven. Nevertheless, nitric and<br />
especially hydrofluoric acid can’t be handled without introducing<br />
certain safety measures.<br />
References<br />
[1] M.C. Bellachioma, et al., Vacuum 82 (2008), p. 435<br />
[2] P. Chiggiato and P. Costa Pinto,<br />
Thin Solid Films 515 (2006) p. 382<br />
[3] B. Aune, et al., Phys. Rev. ST-AB, 3, 092001 (2000)<br />
[4] M. Wengenroth, Internal Report (2009)<br />
Acknowledgements<br />
The authors would like to thank M. Brunken of the<br />
S-DALINAC accelerator group for his support and<br />
R. Grötzschel (FZ Dresden-Rossendorf) and W. Assmann<br />
(LMU Munich) for performing the RBS analysis at the FZ<br />
Dresden-Rossendorf.
<strong>GSI</strong> SCIENTIFIC REPORT 2009 ACC-OTHERS-01<br />
<strong>GSI</strong>Template2007<br />
Linac Commissioning at the Italian Hadrontherapy Centre CNAO<br />
B. Schlitt 1 , A. Reiter 1 , G. Breitenberger 1 , J. Cavaco 1 , G. Clemente 1 , M. Hörr 1 , N. Kischnik 1 ,<br />
C. Kleffner 1 , M. Maier 1 , G. Schulz 1 , W. Vinzenz 1 , H. Vormann 1 ,<br />
E. Bressi 2 , M. Pullia 2 , E. Vacchieri 2 , S. Vitulli 2 , A. Pisent 3 , P. Posocco 3 , C. Roncolato 3 , C. Biscari 4<br />
1 2 3 4<br />
<strong>GSI</strong>, Darmstadt, Germany; CNAO, Pavia, Italy; INFN/LNL, Legnaro, Italy; INFN/LNF, Frascati, Italy<br />
Introduction<br />
The Centro Nazionale di Adroterapia Oncologica<br />
(CNAO) presently under commissioning in Pavia, Italy,<br />
will be the first Italian centre for the treatment of deeply<br />
sited tumours with proton and carbon ion beams [1]. The<br />
7 MeV/u, 216.8 MHz injector linac is a copy of the linac<br />
at the Heidelberg Ion-beam Therapy centre (HIT) and<br />
consists of a 4-rod type RFQ and of an IH-type drift tube<br />
linac, both designed by <strong>GSI</strong> and IAP Frankfurt [2]. In<br />
2004, a collaboration between CNAO and <strong>GSI</strong> was established<br />
for delivery and commissioning of the CNAO linac<br />
and for delivery of complete beam diagnostics systems by<br />
<strong>GSI</strong> [3, 4, 5]. Linac installation and commissioning in<br />
Pavia were performed in collaboration by CNAO, <strong>GSI</strong>,<br />
and INFN during 2008/09 [6, 7, 8]. <strong>GSI</strong> coordinated and<br />
supported installation and tests of all linac components<br />
and technical subsystems, performed commissioning of<br />
the LLRF systems as well as RF tests and conditioning of<br />
the resonators. Linac beam commissioning was supervised<br />
by <strong>GSI</strong>. During beam commissioning periods, 3 –<br />
4 <strong>GSI</strong> employees worked permanently at CNAO for accomplishment<br />
of the linac shifts. Overall, in 2009 twelve<br />
<strong>GSI</strong> employees worked ~95 weeks at CNAO in Pavia.<br />
Linac Commissioning<br />
Table 1: Commissioning schedule and milestones<br />
May 08 – Jan 09<br />
Ion sources<br />
& LEBT<br />
Final installation &<br />
commissioning<br />
Nov 08 – Jan 09<br />
RF conditioning & tests<br />
Feb – Mar 09 RFQ<br />
Installation & RF conditioning<br />
at final position<br />
Mar – Apr 09 Beam commissioning<br />
Apr – Jun 09<br />
IH linac<br />
Installation &<br />
RF conditioning<br />
Jun – Jul 09 Beam commissioning<br />
Jul – Nov 09<br />
MEBT,<br />
Debuncher<br />
Final installation,<br />
RF tests & conditioning<br />
Nov – Dec 09<br />
Linac,<br />
MEBT<br />
Beam tests,<br />
linac operation training<br />
Dec 09 Synchtrotron First turn in synchrotron<br />
The layout of the injector including two ECR ion<br />
sources and LEBT is shown in Fig. 1. After completion of<br />
ion sources and LEBT commissioning in January 2009<br />
[7], the RFQ and thereafter the IH linac were commissioned<br />
during 2009 (Table 1), both with H3 + and C 4+ ion<br />
beams. Final acceptance tests of all linac RF amplifiers as<br />
well as commissioning and beam tests of MEBT components<br />
delivered by <strong>GSI</strong> (debuncher resonator and BD devices)<br />
were performed during autumn 2009. The first turn<br />
in the synchrotron was achieved in December. The complete<br />
linac is shown in Fig. 2.<br />
Chopper<br />
a)<br />
RFQ<br />
IH - DTL<br />
400 keV/u<br />
7 MeV/u<br />
8 keV/u<br />
Stripping foil<br />
c)<br />
a)<br />
b)<br />
a)<br />
Sources<br />
C4+ b)<br />
Sources<br />
C and H +<br />
3 4+ b)<br />
and H +<br />
3<br />
a) Solenoid<br />
b) Spectrometer<br />
c) Switching magnet<br />
Figure 1: Layout of the CNAO injector<br />
Figure 2: Complete linac with RFQ (right), IH linac (center),<br />
and stripper section (left)<br />
Three different beam diagnostics test benches were<br />
used behind LEBT, behind RFQ, and behind the stripper<br />
section, respectively, and allowed for beam current, profile,<br />
and emittance measurements [7, 8]. For RFQ and IH<br />
linac commissioning the test benches were designed and<br />
prepared by <strong>GSI</strong>. They comprised an emittance measurement<br />
device loaned from <strong>GSI</strong> as well as a set of three<br />
phase probes for accurate time-of-flight beam energy<br />
measurements.<br />
RFQ<br />
As an example Fig. 3 shows the beam energy measured<br />
behind the RFQ vs. tank voltage for different ion beams.<br />
The required injection energy for the IH linac of<br />
400 keV/u is reached for all ion species around the same<br />
RFQ working point – corresponding to a RF pulse power<br />
of 195 – 200 kW. Different LEBT beam energies and<br />
steerer settings were investigated to optimize RFQ injec-<br />
159
ACC-OTHERS-01 <strong>GSI</strong> SCIENTIFIC REPORT 2009<br />
tion. Finally, the design value of 8.0 keV/u was kept.<br />
Transmissions along the RFQ up to 60 % were reached<br />
for H3 + as well as for C 4+ beams for matched injection.<br />
For a detailed summary of RFQ commissioning results<br />
see Ref. [8].<br />
420<br />
415<br />
410<br />
405<br />
400<br />
395<br />
H3+ - full - 8.0keV/u<br />
H3+ - probe - 8.0keV/u<br />
H3+ - full - 8.5keV/u<br />
H3+ - probe - 8.5keV/u<br />
C4+ - full - 8.0keV/u<br />
390<br />
4.4 4.5 4.6 4.7 4.8 4.9 5.0 5.1 5.2 5.3 5.4<br />
tank voltage [V]<br />
Figure 3: RFQ output beam energy in keV/u as function<br />
of the scaled tank voltage for different ion beams<br />
IH Linac<br />
More than 140 measurement series including numerous<br />
amplitude and phase scans were performed with the IH<br />
linac. Different LEBT beam energies, RFQ settings, and<br />
IH tank plunger configurations were investigated. The<br />
linac was optimized with respect to high beam transmission,<br />
minimum beam emittances and optimized bunch<br />
signal amplitudes. For the final setting, the measured<br />
linac beam energy amounts to 7.2 MeV/u at a RF pulse<br />
power of 910 – 930 kW.<br />
Table 2: Typical beam currents and linac transmission<br />
Ion<br />
Species<br />
C 4+ / C 6+<br />
H 3 + / p<br />
Beam Current / µA Linac Trans-<br />
LEBT Linac Stripped mission<br />
~170 ~80 115 48 %<br />
1100 400 1200 39 %<br />
710 307 900 46 %<br />
Figure 4: Measured C 4+ / C 6+ beam pulses<br />
Table 2 summarizes typical beam currents achieved at<br />
the LEBT upstream of the solenoid focusing into the<br />
RFQ, behind the IH linac, and behind the stripping foil.<br />
160<br />
LEBT: 169 µA<br />
Linac: 85.9 µA<br />
Stripped: 116 µA<br />
Fig. 4 shows examples of measured beam pulses. A total<br />
linac transmission (incl. solenoid, RFQ, and IH linac) up<br />
to 48 % was achieved, meeting the design beam currents<br />
behind the stripper (100 – 120 µA for C 6+ and 700 µA for<br />
protons) and even exceeding them.<br />
The quadrupole settings behind the linac were optimized<br />
to achieve minimum beam diameters at the stripping<br />
foil in order to reduce emittance growth effects in<br />
the foils. Measured beam emittances for the final settings<br />
are listed in Table 3 and are shown in Fig. 5. Twiss parameters<br />
are similar in both transverse planes.<br />
Figure 5: Hor. (left) and ver. (right) proton beam emittances<br />
measured ~1 m behind the stripping foil<br />
Table 3: Measured beam emittances (4 × rms for 90 % of<br />
the beam current) behind the stripping foil and emittance<br />
growth in the foil<br />
Ion<br />
Species<br />
ε 4×rms, 90% / π mm mrad<br />
horizontal vertical<br />
Emittance Growth<br />
hor. ver.<br />
C 6+ 3.6 3.0 6 % 6 %<br />
protons 4.7 4.7 15 % 40 %<br />
Summary and Outlook<br />
Commissioning and beam tests of all components delivered<br />
and supervised, respectively, by <strong>GSI</strong> were accomplished<br />
successfully in 2009. Design beam currents were<br />
achieved and even exceeded; the measured beam emittances<br />
agree well with expected values. Finally, twenty<br />
CNAO operators, engineers and physicists were trained in<br />
linac operation by <strong>GSI</strong> in November 2009 – marking the<br />
end of the <strong>GSI</strong> services fixed in the CNAO-<strong>GSI</strong> contract.<br />
Acknowledgements<br />
The authors wish to thank the numerous <strong>GSI</strong> colleagues<br />
involved in this project over the past years. Their efforts<br />
are greatly acknowledged. Many thanks to all CNAO and<br />
INFN collaborators for the fruitful cooperation, the cordial<br />
atmosphere and the great hospitality at CNAO.<br />
References<br />
[1] S. Rossi, EPAC 2006, p. 3631.<br />
[2] B. Schlitt, LINAC08, p. 720.<br />
[3] B. Schlitt et al., <strong>GSI</strong> Scientific Report 2006, p. 383.<br />
[4] A. Reiter et al., EPAC 2006, p. 1028.<br />
[5] H. Vormann et al., EPAC08, p. 1833.<br />
[6] B. Schlitt et al., <strong>GSI</strong> Scientific Report 2008, p. 409.<br />
[7] E. Bressi et al., PAC09, TU6PFP005.<br />
[8] P. Posocco et al., HIAT09, in print.
<strong>GSI</strong> SCIENTIFIC REPORT 2009 ACC-OTHERS-02<br />
Influence of an electrostatic LEBT chopper on linac beam parameters at CNAO<br />
Introduction<br />
The Centro Nazionale di Adroterapia Oncologica<br />
(CNAO) located in Pavia, Italy, will be the first Italian<br />
facility for hadrontherapy of deeply sited tumours [1].<br />
The accelerator consists of a RFQ and of an IH-type drift<br />
tube linac, both delivered by <strong>GSI</strong> [2], followed by a synchrotron<br />
built by CNAO.<br />
In the low energy beam line (LEBT), an electrostatic<br />
chopper horizontally deflects the DC ion source beam via<br />
an electric field across two parallel plates at opposite potential.<br />
The field is generated by a dual-polarity high voltage<br />
module (max. ±5 kV). When triggered, a fast HV<br />
switch allows a beam pulse of adjustable length to pass<br />
into the RFQ. Within about 1 µs the potential across the<br />
plates drops to a few Volt and, after a defined down-time,<br />
is restored with a similar time constant.<br />
Unlike the Heidelberg facility HIT, CNAO has not<br />
foreseen a chopper behind the linac. Hence, chopper disturbances<br />
on the ~20 µs pulse can not be corrected for and<br />
might affect the multi-turn synchrotron injection. Studies<br />
of chopper effects on the beam are subject of this article.<br />
Ion Source Beam Measurements<br />
Due to the small RFQ aperture radius of ~3 mm, correct<br />
beam injection into the RFQ is very critical. During<br />
LEBT commissioning a profile grid monitored the beam<br />
280 mm behind the injection solenoid for the RFQ.<br />
At DC chopper voltages below 300 V, a 1 st series of<br />
profiles resulted in a linear displacement coefficient of<br />
~0.05 mm/V at grid position. Hence, at the RFQ injection<br />
plane 48 mm behind the solenoid, the measured residual<br />
6 V across the chopper plates cause a small offset only.<br />
In a 2 nd experiment the chopper was operated in pulsed<br />
mode. 11 µs beam pulses, initially set outside the profile<br />
grid amplifier integration window, were shifted by −1 µs<br />
between measurements in order to analyse variations between<br />
incremental beam portions. Within the first two<br />
microseconds the beam position at the profile grid<br />
changed by ~0.3 mm in either plane and then gradually<br />
drifted about 0.5 mm before it reached a stable value.<br />
Linac Beam Measurements<br />
After the linac was put into operation, phase probes and<br />
profile grids measurements mainly with 7 MeV/u H3 + or<br />
proton beams complemented the LEBT investigations.<br />
The phase probes were equipped with wide-band amplifiers<br />
to resolve the 216.8 MHz rf micro-structure and delivered<br />
information on the longitudinal bunch distribution.<br />
Macro-Pulse Structure<br />
Fig. 1 shows phase probe signals of a 1 µs beam pulse<br />
for two of the investigated chopper operating values. The<br />
<strong>GSI</strong>Template2007<br />
B. Schlitt 1 , A. Reiter 1 , S. Vitulli 2<br />
1 <strong>GSI</strong>, Darmstadt, Germany; 2 CNAO, Pavia, Italy<br />
probe is installed behind the RFQ tank. Signal rise- and<br />
fall-time can be estimated to be ~200 ns and
ACC-OTHERS-03 <strong>GSI</strong> SCIENTIFIC REPORT 2009<br />
162<br />
The status of the cw-LINAC-demonstrator<br />
S. Mickat 1 , W. Barth 1 , L. Dahl 1 , A. Jankowiak 2 , M. Kaiser 1 , H. Podlech 3 , U. Ratzinger 3<br />
1 <strong>GSI</strong> <strong>Helmholtzzentrum</strong> <strong>für</strong> <strong>Schwerionenforschung</strong>, Darmstadt, Germany<br />
2 KPH Institut <strong>für</strong> Kernphysik, Universität Mainz, Germany<br />
3 IAP Institut <strong>für</strong> Angewandte Physik, Universität Frankfurt, Germany<br />
Introduction<br />
In June 2009 the Helmholtz-Institute Mainz (HIM) was<br />
founded. The research activities of HIM are supported by<br />
the integrated department of accelerator physics and integrated<br />
detectors (ACID) [1]. Within the scope of ACID a<br />
collaboration of the Institute of Applied Physics of University<br />
Frankfurt (IAP) and the <strong>GSI</strong> acceleration division<br />
is established. Its longterm task should be the design and<br />
the realisation of a superconducting cw-LINAC in parallel<br />
to the existing UNILAC at <strong>GSI</strong>. Such a machine is highly<br />
desirable with respect to the progress in the field of Superheavy<br />
Elements (SHE), because the UNILAC at <strong>GSI</strong> is<br />
limited in providing a proper beam for SHE and in fulfilling<br />
the requirements for FAIR simultaneously.<br />
In a first step a prototype of such a superconducting<br />
cw-LINAC as a demonstrator is financed by HIM. The<br />
aim is a full performance test of the demonstrator with<br />
beam at the <strong>GSI</strong> high charge injector (HLI) in 2012.<br />
Figure 1: A draft of the superconducting cw-LINAC demonstrator<br />
is shown. The cavity embedded by two solenoids<br />
is mounted in a cryostat.<br />
cw-LINAC Demonstrator<br />
The proposed cw-LINAC should comprise 9 superconducting<br />
CH-cavities operated at 217 MHz with high luminosity<br />
[2]. The required input parameters match the<br />
conditions at the <strong>GSI</strong> HLI injector with its ECR source<br />
and energies of 1.4 MeV/u. The output energy range is<br />
from 3.5 to 7.5 MeV/u. The energy spread should be kept<br />
at about ±3keV over this whole range. The demonstrator<br />
is the first section of the proposed cw-LINAC consisting<br />
of a superconducting CH-cavity embedded by two superconducting<br />
solenoids. The components should be<br />
mounted in a cryogen environment operating at temperatures<br />
of 4.4 Kelvin (fig. 1).<br />
Projectstatus and -schedule<br />
Presently the tendering of the solenoids, the cavity, the<br />
cryostat and the rf-amplifier is in preparation. The technical<br />
design is a challenging task regarding to the coldwarm-bridges,<br />
the support-system and the high requirements<br />
of shielding external and internal magnetic stray<br />
fields for example. The delivery and the following complex<br />
assembly of the components under cleanroom conditions<br />
to a well-working system are expected in 2011. First<br />
rf-tests of the system should take place at IAP then.<br />
For full performance tests with beam a test station at<br />
the HLI injection line is favoured. The mid-term goal is to<br />
connect the demonstrator straight ahead to the HLI in<br />
2012 (fig. 2). Successful tests would be the first stage<br />
towards a cw-LINAC in parallel to the UNILAC.<br />
Figure 2: A general drawing of the HLI injector at <strong>GSI</strong> is<br />
shown. In straightforward direction the cw-LINAC demonstrator<br />
should be mounted.<br />
References<br />
[1] Stöcker H., Krausch G., Maas F., Proposal for the<br />
Establishment of a Helmholtz Institute: "Helmholtz<br />
Institute Mainz" – Structure, Symmetry and Stability<br />
of Matter and Antimatter (2009)<br />
[2] Minaev S. et al., Superconducting, energy variable<br />
heavy ion linac with constant �, multicell cavities of<br />
CH-Type, Phys. Rev. ST Accel. Beams 12, 120101<br />
(2009)
<strong>GSI</strong> SCIENTIFIC REPORT 2009 ACC-OTHERS-04<br />
Superconducting CH-Cavity Development for Ion Linacs ∗<br />
M. Busch † 1 , H. Podlech 1 , U. Ratzinger 1 , and W. Barth 2<br />
1 Institut <strong>für</strong> Angewandte Physik, Goethe Universität, Frankfurt, Germany; 2 <strong>GSI</strong>, Darmstadt, Germany<br />
Abstract<br />
At present 3 prototype CH-cavities are under design and<br />
/ or construction at velocity ranges from β = 0.05 up to<br />
β = 0.45 to further improve and explore the capabilities of<br />
that novel type of multi-cell superconducting cavity.<br />
CH-Cavity Design<br />
A 325 MHz, 7 cell, β = 0.15 CH-cavity has been designed<br />
and is currently under construction at Research Instruments<br />
(see fig. 1)[1]. The most important changes in<br />
Figure 1: RF design of the 325 MHz sc CH-cavity.<br />
comparison to the previously built 360 MHz CH-prototype<br />
are: inclined end stems, additional flanges at the tank caps<br />
for cleaning procedures , slow / fast bellow tuner inside the<br />
cavity and large power coupler due to changed stem geometry.<br />
Inclined end stems lead to a more homogeneous field<br />
distribution along the beam axis compared with straight<br />
stems because the volume for the magnetic field in this<br />
area and therefor the inductance is increased. The longitudinal<br />
dimensions of the cavity can be reduced by about<br />
20%-25% since an extended end cell is not needed for field<br />
flattening. Additional flanges at the tank caps provide a<br />
convenient way to process the cavity surface chemically.<br />
For the tuning of the cavity three types of tuners are foreseen:<br />
4 static tuners with a diameter of 40 mm and a height<br />
of up to 60 mm to adjust the frequency after fabrication.<br />
They are positioned between the stems and the height is<br />
fixed after adjustment. Furthermore there will be two bellow<br />
tuners (a fast and a slow one) inside the cavity. They<br />
will be placed on the girder between the stems and will be<br />
driven by a piezo. The slow tuner adjusts the frequency after<br />
cooling the cavity down, while the fast one regulates the<br />
∗ Work supported by BMBF 06FY9089 I<br />
† busch@iap.uni-frankfurt.de<br />
Figure 2: Tuning range of the fast bellow tuner.<br />
frequency during beam operation. The desired frequency<br />
shift for each one is 100 − 130Hz/µm (see fig. 2).<br />
Applications to <strong>GSI</strong>-FAIR<br />
The design effort for a cw operated, s.c. heavy ion linac<br />
for nuclear chemistry and SHE-production has started. The<br />
linac will be used for the production of super heavy elements.<br />
It has to provide ion beams with an A/q of up to<br />
6 and energies up to 7.3 AMeV. Above an energy of 3.5<br />
AMeV the linac is fully energy variable. The front end<br />
will be the existing high charge injector (108.408 MHz, 1.4<br />
AMeV) which is presently being upgraded for the required<br />
duty cycle. The main acceleration of approximately 35<br />
MV will be provided by 9 CH-cavities operated at 216.816<br />
MHz (see fig 3)[2]. The 7-cell, 325 MHz cavity shown in<br />
Figure 3: Schematic overview of the cw heavy ion linac.<br />
fig. 1 is suited to be tested with a pulsed, intense ion beam<br />
from the Unilac.<br />
References<br />
[1] M. Busch et al., “Recent Superconducting CH-Cavity Development”,<br />
PAC 2009, Vancouver, Canada.<br />
[2] S. Minaev et al., ”A Superconducting Energy Variable Heavy<br />
Ion Linac with Constant Beta, Multi-Cell Cavities of CH-<br />
Type, Phys. Rev. STAB 12, 120101.<br />
163
ACC-OTHERS-05 <strong>GSI</strong> SCIENTIFIC REPORT 2009<br />
<strong>GSI</strong>Temp late2007<br />
High Voltage Pulse Generator for an ExB Chopper System*<br />
C. Wiesner # , L. P. Chau, H. Dinter, M. Droba, N. Joshi, O. Meusel, I. Müller and U. Ratzinger<br />
Institut <strong>für</strong> Angewandte Physik, Goethe-Universität, Frankfurt/Main, Germany;<br />
Introduction<br />
High intensity beams which are increasingly needed for<br />
a variety of applications pose new challenges for beam<br />
chopping. Long drifts must be avoided due to space<br />
charge constraints. The duty cycle for electrostatic beam<br />
deflection must be minimized in order to reduce the risk<br />
of voltage breakdowns. Beam dumping outside the transport<br />
line is preferable in order to avoid high power deposition<br />
and uncontrolled production of secondary particles<br />
at the slit or other vulnerable beamline components.<br />
ExB Chopper System<br />
An ExB chopper system for intense proton beams of up<br />
to 200 mA and repetition rates of up to 250 kHz is under<br />
development at IAP. It will be tested and installed in the<br />
low energy section of the Frankfurt Neutron Source<br />
FRANZ [1] with beam energies of 120 keV.<br />
Figure 1: Scheme of the ExB Chopper System.<br />
The chopper consists of a Wien filter-type ExB configuration,<br />
where the electric field can be pulsed and is<br />
followed by a static septum magnet [2]. As pulsing of the<br />
magnetic deflection field is not possible with a repetition<br />
rate of 250 kHz due to high power consumption, a pulsed<br />
electric field (fig. 3) is generated between two deflector<br />
plates located inside the dipole gap. It compensates the<br />
magnetic deflection and is thus creating a 100 ns proton<br />
pulse in forward direction for injection into the first accelerator<br />
structure.<br />
High Voltage Pulse Generator<br />
The electric field will be driven by a High Voltage<br />
Pulse Generator shown in fig. 2. It uses fast MOSFET<br />
* Work supported by BMBF – 06FY9089I and LOEWE-<br />
HIC for FAIR.<br />
# wiesner@iap.uni-frankfurt.de<br />
164<br />
technology in the primary circuit while the high voltage is<br />
provided in the secondary circuit around a ferrite transformer<br />
core.<br />
Figure 2: High Voltage Pulse Generator.<br />
Two pulses of more than 5 kV of positive and negative<br />
voltage, respectively, are required to charge both deflector<br />
plates symmetrically. Voltage pulses of ±5.8 kV with a<br />
repetition rate of 250 kHz were achieved (fig. 3). In addition<br />
post-pulse oscillations were minimized by reducing<br />
parasitic capacitances and by installing diodes as well as<br />
ohmic resistances.<br />
Figure 3: Measured Voltage Pulses.<br />
References<br />
[1] O. Meusel et al., “Injector Development for High<br />
Intensity Proton Beams at Stern-Gerlach-Zentrum”,<br />
LINAC’08, Victoria, BC, Canada, September 2008,<br />
MOP002, p. 49-51.<br />
[2] C. Wiesner et al., “Chopper for Intense Proton Beams<br />
at Repetition Rates up to 250 kHz”, PAC’09, Vancouver,<br />
BC, Canada, May 2009, TU6PFP088.
<strong>GSI</strong> SCIENTIFIC REPORT 2009 ACC-OTHERS-06<br />
<strong>GSI</strong>Template2007<br />
Space Charge Lens for Focusing Uranium Beams*<br />
K. Schulte, M. Droba, O. Meusel, J. Pfister, and U. Ratzinger<br />
IAP, Goethe University Frankfurt, Germany<br />
Introduction<br />
Space charge lenses (SCL) are a promising concept for<br />
the focusing of ion beams. The confined homogeneous<br />
electron cloud induces a linear radial electric field that<br />
provides a strong attracting force on the beam particles<br />
and hence a linear transformation in the transversal phase<br />
space. Furthermore focusing is independant from the ion<br />
mass and the trapped electron cloud compensates the<br />
space charge forces of the positively charged beam.<br />
A new experiment is under construction which will test<br />
the performance of the SCL in the case of low energy<br />
heavy ion beams like 238 U 4+ .<br />
Space Charge Lens<br />
A new SCL [1] has been designed for the possible application<br />
at the HSI-Upgrade (<strong>GSI</strong>) [2] as a focusing element.<br />
The numerical simulations are used to prepare<br />
beam transport experiments at <strong>GSI</strong> using a 238 U 4+ -beam<br />
with aa beam energ of 2.2 AkeV.<br />
Figure 1 shows the final layout of the new device.<br />
Solenoid<br />
Ground electrode<br />
Anode<br />
Figure 1: Design of the new space charge lens.<br />
The total length of the proposed space charge lens will<br />
be 0.47 m and the longitudinal confinement of the electrons<br />
will be provided by an anode with radius rA = 0.085<br />
m. For focusing heavy ions like U 4+ a self electric field<br />
produced by the trapped electrons of about Er,max=140<br />
kV/m is needed.<br />
Preliminary Experiment and Diagnostic<br />
The mapping quality of the space charge lens depends<br />
on thermodynamic properties and the homogeneity of the<br />
non neutral plasma [3]. Therefore one concern by using<br />
SCL is the investigation of the plasma parameters.<br />
An experiment (Figure 2) was constructed to investigate<br />
the time evolution of the non neutral plasma and to<br />
carefully determine the special operation modi for its application<br />
at <strong>GSI</strong>.<br />
* Funded by BMBF06FY9089I, Primärstrahlerzeugung<br />
<strong>für</strong> FAIR, HITRAP-IH-Struktur<br />
Figure 2: Experimental set-up.<br />
Besides a well-proven SCL the experimental set-up<br />
consists of a CCD camera, a Faraday cup, and a pepper<br />
pot emittance meter to analyze the phase space distribution<br />
of residual gas ions and electrons. These residual gas<br />
ions are produced by collisions between the trapped electrons<br />
within the SCL and the residual gas. In the case of<br />
thermalisation electrons are also able to escape from the<br />
lens volume. Therefore the diagnostic measurements yield<br />
information about the confined non neutral plasma state.<br />
x’/mrad<br />
-10 -8 -6 -4 -2 0 2 4 6 8 10 -10 -8 -6 -4 -2 0 2 4 6 8 10<br />
x/mm<br />
Figure 3: An example of the phase space distribution of<br />
residual gas ions.<br />
The next step will be the construction of the new SCL,<br />
the further diagnostic of the non neutral plasma and the<br />
preparation of possible beam transport experiments at<br />
<strong>GSI</strong>.<br />
References<br />
[1] K. Schulte, et al., “A Space Charge Lens for Focusing<br />
Heavy Ion Beams”, <strong>GSI</strong> Scientific Report, 2008.<br />
[2] P. Spädtke and R. Hollinger, et al., REVIEW OF<br />
SCIENTIFIC INSTRUMENTS 76, 063307 (2005)<br />
[3] K. Schulte, “Research of diagnostic techniques on a<br />
nonneutral plasma”, Diploma thesis, IAP, 2008,<br />
http://publikationen.ub.unifrankfurt.de/volltexte/2009/6244/.<br />
y’/mrad<br />
y/mm<br />
165
ACC-OTHERS-07 <strong>GSI</strong> SCIENTIFIC REPORT 2009<br />
Status report on the Frankfurt 200 mA proton source<br />
A remarkable progress on the 200 mA 120 keV high<br />
current proton source source for FRANZ (Frankfurt Neutron<br />
Source Source at the Stern Gerlach Centre) was achieved till end<br />
of 2009. Figure 1 1 shows a technical cross-section of the<br />
source. Principally, Principally, the source is composed of the Frankfurt<br />
Volume Volume Source Source plasma generator and equipped with<br />
a new pentode pentode extraction system. The plasma generator<br />
has a maximum input power power of 8 8 kW with a total total arc current<br />
of 100 A and an arc voltage voltage of 80 V. V. The plasma<br />
confinement is achieved by a solenoidal magnetic field<br />
with with a maximum flux density of 40 mT. Also included in<br />
the design is a filter magnet which generates generates a a transversal<br />
magnetic field field in front of emission aperture. aperture.<br />
Figure 1: Cross-section of the 200 mA proton source.<br />
The first measurements were performed for testing<br />
source characteristics and to evaluate the total beam current<br />
and the relative fraction of protons. An exemplary<br />
measurement can be seen in Figure 2.<br />
Figure 2: Measured beam fraction at a 25 mA total beam current.<br />
166<br />
<strong>GSI</strong>Template2007<br />
J. Sun 1 , W. Schweizer 1 , K. Volk 1<br />
J. Sun 1 , W. Schweizer 1 , K. Volk 1<br />
1<br />
IAP, Frankfurt, Germany<br />
A pentode extraction system has been designed for the<br />
FRANZ project with a single hole aperture of 5 mm radius.<br />
The application of a pentode extraction system enables<br />
not only decoupling of beam parameters from the<br />
beam energy but also allows a pulsed operation mode.<br />
With an optic fibre controlled high voltage switcher it is<br />
possible to adjust and optimize the repetition rate and<br />
pulse length to aim for a higher field strength resulting in<br />
higher peak current and less sparking between plasma and<br />
puller electrode. Furthermore, the pulsed operation mode<br />
relaxes the thermal loading for the whole extraction system<br />
and beam transport section. The operation time can<br />
be consequently extended. The very first pulsed beam is<br />
displayed in figure 3.<br />
voltage drop of 1 st stage [V]<br />
pulsed beam with thyristor stack 10Hz<br />
4500<br />
4000<br />
3500<br />
3000<br />
2500<br />
2000<br />
1500<br />
1000<br />
500<br />
0<br />
-0,05<br />
-0,3 -0,2 -0,1 0 0,1 0,2 0,3<br />
t [s]<br />
UEX 4,4kV<br />
2,2 mA<br />
Figure 3: Beam pulse from Frankfurt volume source in pulsed extraction<br />
operation mode.<br />
A reliable switch system has been interdisciplinary developed<br />
and successfully tested. Current beam sensor<br />
using parallel flux gating principle is chosen for comprehensive<br />
investigation on the pulsed beam. Intensive investigation<br />
on soft magnetic material for flux gate sensors<br />
has been accompanied. This helps for optimized operation<br />
parameters for detecting beam pulse [1] with sufficient<br />
resolution under current operation environment.<br />
Pulsed pentode extraction system opens new perspective<br />
in terms of operation mode extraction system, it<br />
brings also further topic with itself, which are relevant for<br />
a study of dynamic behaviour of plasma meniscus,<br />
sparking from Hz till kHz range, beam noise. All these<br />
topics associated with pulsed extraction mode will sustain<br />
more innovative development of extraction system.<br />
[1] B-J. Lee et al.: “Properties of magnetic materials at very high magnetization<br />
rates”.<br />
0,3<br />
0,25<br />
0,2<br />
0,15<br />
0,1<br />
0,05<br />
0
<strong>GSI</strong> SCIENTIFIC REPORT 2009 ACC-OTHERS-08<br />
<strong>GSI</strong>Template2007<br />
Neutron streaming though the RF waveguide ducts of SPL*<br />
E. Kozlova 1 , T. Radon 1 , T. Otto 2 , and G. Fehrenbacher 1<br />
1 <strong>GSI</strong>, Darmstadt, Germany; 2 CERN, Geneva, Switzerland<br />
Introduction<br />
Presently a new accelerator complex is being planned at<br />
CERN, which will replaced the ageing Proton Synchrotron<br />
(PS). A high-power160 MeV H - linac (Linac 4) will<br />
replace the present 50 MeV proton linac injector [1], a 5<br />
GeV Superconducting Proton Linac (SPL) will replace<br />
the 1.4 GeV PS Booster (PSB) [2] and a 50 GeV synchrotron<br />
(PS 2) will replace the 26 GeV PS [3]. A tentative<br />
layout of the planned accelerators, integrated into the<br />
CERN accelerator complex, is shown in Fig. 1.<br />
Figure 1: Layout of the LHC injectors at present and in<br />
the future.<br />
In this paper some radiological aspects are discussed<br />
concerning the propagation of neutrons through the<br />
waveguide ducts from the SPL tunnel to the surface. Injected<br />
160 MeV H - ions from the Linac 4 into the SPL<br />
will be accelerated up to 4-5 GeV. The SPL tunnel will be<br />
situated in the earth at a depth between 20 and 30 meters.<br />
The expected uncontrolled losses are 1 W/m at each section<br />
of the SPL. Thus the radiobiological study has been<br />
started with the estimation of the dose rate level at the<br />
surface at the exit of the waveguide, coursed by uncontrolled<br />
losses in the SPL.<br />
Prompt dose calculations<br />
The calculations of the prompt dose rate were performed<br />
by using the Monte Carlo code FLUKA. The first<br />
calculation was done for a proton beam energy of 5 GeV.<br />
The total length of the SPL is 550 meters, for the calculation<br />
100 meters were taken. Along 100 meters three<br />
waveguide ducts (shaft) will be situated. The target in<br />
which the beam is lost was assumed by a 0.02 × 0.02 ×<br />
100 m 3 iron <strong>block</strong> placed at the beam height. The dose<br />
rate was calculated from the superposition of 11 sources,<br />
which were equally distributed all over the target. In Fig.<br />
2 the radiation streaming in the SPL tunnel and in one of<br />
the shafts is presented. The most conservative case is for<br />
* Work supported by FP7 under the Grant Agreement<br />
No. 212114 (SLHC-PP).<br />
the shaft number 3 which is shown in the lower part of<br />
Fig. 2. Without implementing any waveguides in the calculations<br />
the dose rate on ground level is less than 50<br />
µSv/h. The inclusion of the waveguides in the ducts will<br />
further reduce the dose rate at the surface. This will be<br />
one of the future radiation protection studies for the SPL.<br />
The same calculations were performed for the beam energy<br />
of 1 GeV. Assuming in this case also the beam<br />
losses of 1 W/m it was found out that the dose rate at<br />
ground level is by a factor of 3 higher than for the beam<br />
energy of 5 GeV. This lower energy is overcompensated<br />
by the higher intensity.<br />
Figure 2: Neutron streaming through three waveguide<br />
ducts of SPL. Uncontrolled losses are assumed to be 1<br />
W/m. The primary beam energy is 5 GeV. The importance<br />
biasing technique was used to improve the transport<br />
of the neutrons. The beam transport in the soil was<br />
switched off.<br />
References<br />
[1] E. Mauro and M. Silari, “Radiation protection studies<br />
for a high-power 160 MeV proton linac”, Nucl. Instrum.<br />
Methods Phys. Res. A, 605, 2008, p. 249.<br />
[2] https://twiki.cern.ch/twiki/bin/view/SPL/SplWeb.<br />
[3] https://paf-ps2.web.cern.ch/paf-ps2.<br />
[4] www.fluka.org.<br />
167
ACC-OTHERS-09 <strong>GSI</strong> SCIENTIFIC REPORT 2009<br />
168<br />
<strong>GSI</strong>Template2007<br />
Residual dose rate calculation for an injection absorber of 4 GeV H - injection<br />
in the PS 2 accelerator project*<br />
E. Kozlova 1 , T. Radon 1 , T. Otto 2 , and G. Fehrenbacher 1<br />
1 <strong>GSI</strong>, Darmstadt, Germany; 2 CERN, Geneva, Switzerland<br />
Introduction<br />
The PS 2 accelerator is proposed to replace the existing<br />
PS complex, to provide more reliable operation and improved<br />
basic beam parameters for the foreseen LHC luminosity<br />
upgrade. In the projected PS 2 accelerator various<br />
beam dumps will absorb beams. One of the beam<br />
absorber, which has been study in the present work, will<br />
serve for stopping of unstripped H 0 /H - ions. It is planned<br />
to strip the coming from SPL to SP 2 H - ions by using a<br />
charge-exchange H - system. After a 500 µg/cm 2 foil 95<br />
% of stripped H + ions will be accelerated in the SP 2 and<br />
the unstripped H 0 /H - ions will be dump. The beam load<br />
for the H - dump is 6.4x10 19 particles per year at the energy<br />
of 4 GeV [1, 2].<br />
The beam dump design<br />
As the starting point the design of the H - injection dump<br />
like in the Project X at Fermilab is studied [3]. The same<br />
parameters and materials were taken for the SP 2 beam<br />
dump. In Fig. 1 schematic geometry of the dump is<br />
shown.<br />
Figure 1: Geometry of the beam dump. The inner core<br />
consists of graphite, aluminium and tungsten. The core is<br />
surrounded by iron shielding. The outer layer of the<br />
shielding is concrete.<br />
Residual dose calculations<br />
The design goal of the beam absorber is after irradiation<br />
and 8 hours of cooling, to have in the close vicinity of the<br />
absorber the residual ambient dose rates is not higher than<br />
10 µSv/h. For the optimization the Monte Carlo code<br />
FLUKA [4] was used. First of all, the geometry, as it is<br />
shown in Fig. 1, was taken for the calculation. The beam<br />
is assumed as a pencil beam. The intensity is 6.4E10 19<br />
protons uniformly distributed during 8 months of operations.<br />
The irradiation period is 10 years of operation, each<br />
* Work supported by FP7 under the Grant Agreement<br />
No. 212114 (SLHC-PP).<br />
of 8 months of beam operation and 4 months of shutdown.<br />
The dose is scored for 5 different cooling down<br />
periods after the last 8 months of irradiation: 8 hours, 1<br />
day, 1 week, 1 month and 4 months. First calculations<br />
have shown that for reaching of our design goal the sizes<br />
of the dump had to be modified: the height of the iron part<br />
had to be increased by 20 cm, the width had to be 40 cm<br />
wider on each side; the tungsten core had to be shortened<br />
by 20 cm. The last result of the optimization is presented<br />
in Fig. 2. The residual dose rate after 8 hours of cooling is<br />
already below 10 µSv/h. Only at the beam entrance of the<br />
dump the dose rate is above the limit. It can be solved by<br />
closing the entrance after the shut down.<br />
Figure 2: Plot of the residual dose rate after the irradiation<br />
period described in the text and a cooling time of 8 hours.<br />
Conclusions<br />
First results of the beam dump design are presented in<br />
this paper. The next steps of the study are estimation of<br />
the activation for the dump components like air, soil and<br />
ground water.<br />
References<br />
[1] B. Goddard et al, “4 GeV H - charge exchange injection<br />
into the PS 2”, AB-Note-2008-034, Geneva,<br />
September 2008.<br />
[2] T. Kramer et al, “Design considerations for the PS 2<br />
beam dumps”, AB-Note-2008-035, Geneva, September<br />
2008.<br />
[3] http://projectx.fnal.gov.<br />
[4] www.fluka.org.
<strong>GSI</strong> SCIENTIFIC REPORT 2009 NUSTAR-SHE-01<br />
Production and decay of element 114: high cross sections and new nucleus 277 Hs*<br />
Ch.E. Düllmann 1,# , D. Ackermann 1 , M. Block 1 , W. Brüchle 1 , H.G. Essel 1 , J.M. Gates 1,2 ,<br />
W. Hartmann 1 , F.P. Heßberger 1 , A. Hübner 1 , E. Jäger 1 , J. Khuyagbaatar 1 , B. Kindler 1 , J. Krier 1 ,<br />
N. Kurz 1 , B. Lommel 1 , M. Schädel 1 , B. Schausten 1 , E. Schimpf 1 , J. Steiner 1 , A. Gorshkov 2 ,<br />
R. Graeger 2 , A. Türler 2 , A. Yakushev 2 , K. Eberhardt 3 , J. Even 3 , D. Hild 3 , J.V. Kratz 3 , D. Liebe 3 ,<br />
J. Runke 3 , P. Thörle-Pospiech 3 , N. Wiehl 3 , L.-L. Andersson 4 , R.-D. Herzberg 4 , E. Parr 4 , J. Dvorak 5,6 ,<br />
P.A. Ellison 5,6 , K.E. Gregorich 5 , H. Nitsche 5,6 , S. Lahiri 7 , M. Maiti 7 , J.P. Omtvedt 8 ,<br />
A. Semchenkov 8 , D. Rudolph 9 , J. Uusitalo 10 , M. Wegrzecki 11<br />
1 <strong>GSI</strong>, Darmstadt, Germany; 2 TU Munich, Garching, Germany; 3 Johannes Gutenberg-University of Mainz, Germany;<br />
4 University of Liverpool, UK; 5 LBNL Berkeley, CA, USA; 6 UC Berkeley, CA, USA; 7 SINP, Kolkata, India; 8 University<br />
of Oslo, Norway; 9 Lund University, Sweden; 10 University of Jyväskylä, Finland; 11 ITE, Warsaw, Poland<br />
Introduction<br />
Discoveries of new superheavy elements (SHE) were<br />
reported from FLNR, Dubna, Russia [1], including observations<br />
of element 114 isotopes produced in<br />
48 Ca+ 242,244 Pu reactions. Successful independent studies<br />
of some of the reactions studied in Dubna were reported<br />
[2,3], most recently also the observation of one atom each<br />
of 286,287 114 produced in the 48 Ca+ 242 Pu reaction at LBNL<br />
[4]. Predictions on the existence of an "island of stability"<br />
in the region of SHE have substantiated, despite the small<br />
number of observed events in every confirmation experiment.<br />
All successful confirmation experiments reported<br />
cross sections lower than those from FLNR by factors of<br />
two or more. Nevertheless, these cross sections are unexpectedly<br />
high compared to extrapolations from lighter<br />
systems [5], and intriguingly constant over a large range<br />
of 112≤Z≤118. A thorough understanding of the underlying<br />
production mechanism is still missing; location and<br />
extension of the "island of stability" in the region of<br />
spherical SHE is still far from being established. To help<br />
shedding more light on these problems, a 48 Ca+ 244 Pu experiment<br />
was performed at the gas-filled TransActinide<br />
Separator and Chemistry Apparatus (TASCA) [6,7],<br />
which was optimized for the study of 48 Ca-induced fusion<br />
reactions with actinide targets. TASCA's efficiency for<br />
this nuclear reaction type is currently unsurpassed.<br />
Experimental<br />
The UNILAC accelerated a pulsed 48 Ca beam (~2•10 12<br />
s -1 ), which passed through 244 PuO2 targets (average thickness:<br />
438 µg/cm 2 244 Pu). Beam energies inside the targets<br />
were 241.3-246.2 MeV (E*=39.8-43.9 MeV; hereafter<br />
referred to as 42-MeV run) and 236.4-241.0 MeV<br />
(E*=36.1-39.5 MeV; 38-MeV run). 2.44•10 18 (42-MeV<br />
run) and 1.15•10 18 (38-MeV run) projectiles passed<br />
through the targets. Nuclear reaction products entered<br />
* Work supported by the BMBF (06MT247I, 06MT248,<br />
06MZ223I); the <strong>GSI</strong>-F&E (MT/TÜR, MZJVKR); the<br />
Swedish and Norwegian (177538) Science Councils; the<br />
US DOE (DE-AC03-76SF00098; DE-AC02-05CH11231;<br />
NNSA Fellowship); the Govt. of India (TADDS).<br />
# c.e.duellmann@gsi.de<br />
<strong>GSI</strong>Template2007<br />
TASCA, operated in "high transmission mode" [7], and<br />
were separated in 0.8 mbar He gas. The detection system<br />
consisted of a Multi Wire Proportional Counter (MWPC)<br />
and a focal plane detector box (FPDB). The FPDB consisted<br />
of a Double Sided Silicon Strip Detector (DSSSD;<br />
pitch size: 1 mm; 144 vertical / 48 horizontal strips) and<br />
Single Sided Silicon Strip Detectors (SSSSD) mounted<br />
perpendicular in the backward hemisphere of the DSSSD<br />
[8]. The MWPC provided a signal for ions recoiling from<br />
the target and allowed distinguishing these from radioactive<br />
decays of species implanted in the DSSSD. The energy<br />
resolution of the FPDB was 25 keV FWHM for 8.1<br />
MeV α-particles fully stopped in the DSSSD and 170<br />
keV for α-particles that deposited a fraction of their energy<br />
inside the DSSSD and the remainder in the SSSSD.<br />
The detection efficiency was 72% for α-particles and<br />
100% for SF. The efficiency for focusing element 114<br />
EVRs into the DSSSD was (60±6)% [9]. Data acquisition<br />
was triggered by events registering more than 300 keV in<br />
the DSSSD or more than 500 keV in a SSSSD. More details<br />
are given in [10,11].<br />
Results<br />
We searched [12] for decay chains from 288,289 114 exhibiting<br />
the decay patterns as published in [1]. Afterwards,<br />
upon identification of a chain, additional αparticles<br />
occurring in the same pixel as the chain were<br />
searched for, in between registration of the EVR and the<br />
terminating SF. Based on the event rate only 0.02 ( 289 114)<br />
and 0.05 ( 288 114) random chains from unrelated background<br />
events were expected. The search yielded nine<br />
EVR-α-SF chains ( 288 114) and four EVR-α-α(-α)-SF<br />
chains ( 289 114). Ten chains were measured in the 42-MeV<br />
run and three chains in the 38-MeV run (Figs. 1 and 2).<br />
The agreement of our data (Table 1) with that of [1] is<br />
good in all cases except for chain #9. The data measured<br />
for the EVR, the first, and the second α-particle suggest<br />
assigning chain #9 to 289 114→ 285 112→ 281 Ds. 281 Ds then<br />
decayed by emission of a (8.727±0.025)-MeV α-particle<br />
5.688 s after the decay of 285 112, during the beam-off period,<br />
where background is low. 281 Ds has undergone SF in<br />
5. 0<br />
all ten previously observed decays [1] with T1/2= 11.1 2.<br />
7<br />
+ −<br />
s. Based on background rates, the probability to register<br />
169
NUSTAR-SHE-01 <strong>GSI</strong> SCIENTIFIC REPORT 2009<br />
an α-like event with properties as exhibited by the observed<br />
one is only 0.1%. We thus assign it to a so far unobserved<br />
α-branch in 281 Ds. Considering this α-decay and<br />
the thirteen measured SF decays from [1] and our work,<br />
an α-decay branch bα of<br />
16<br />
9 7<br />
+ − % results after correcting<br />
for detection efficiency differences for α-decay and SF.<br />
The chain was terminated 4.5 ms later by SF of the new<br />
nucleus 277 Hs.<br />
The B•ρ of element 114 EVRs in 0.8 mbar He was<br />
measured to (2.29±0.11) T•m.<br />
Figure 1: Decay chains assigned to 288 114 (chains 1-8)<br />
and 289 114 (chains 9, 10) observed during the 42-MeV<br />
run. A black triangle in the lower right corner of a box<br />
indicates that the beam was off at the time of the event.<br />
Figure 2: Same as Figure 1, but showing decay chains<br />
observed during the 38-MeV run.<br />
Table 1. Decay properties (this work combined with [1])<br />
Isotope Decay T1/2 (this work) T1/2 (combined)<br />
289<br />
114 α 0.97<br />
0.97 0.<br />
32<br />
+ − s<br />
288<br />
114 α 0.24<br />
0.47 0.<br />
12<br />
+ − s<br />
285<br />
112 α 30<br />
30 10<br />
+ − s<br />
284<br />
112 SF 50 101 25<br />
+ − ms<br />
281<br />
Ds SF/α:91/9 20 20 7<br />
+ − s<br />
277<br />
Hs SF 15<br />
3 1<br />
+ − ms<br />
170<br />
0.8<br />
2.1 0.<br />
4<br />
+ − s<br />
0.17<br />
0.69 0.<br />
11<br />
+ − s<br />
11<br />
29 6<br />
+ − s<br />
24<br />
99 16<br />
+ − ms<br />
5<br />
13 3<br />
+ − s<br />
15<br />
3 1<br />
+ − ms<br />
Discussion<br />
Z=108 is a deformed proton shell closure in N~162 isotopes.<br />
The observed 277 Hs lifetime is short compared to<br />
half-lives of the Hs isotopes near the deformed N=162<br />
shell closure, indicating reduced shell stabilization in the<br />
N=169 nucleus 277 Hs. Macro-microscopic model predictions<br />
of T1/2(SF) for the neighboring isotopes are 46 ms<br />
( 276 Hs) and 0.98 ms ( 278 Hs), the geometric mean being 6.7<br />
ms [13]. This is similar to our observed lifetime. The odd<br />
neutron is expected to hinder SF decay significantly.<br />
Thus, the drop in T1/2(SF) when increasing N above 162<br />
may be more severe than suggested by [13]. 275 Hs<br />
(N=167) decays by α-particle emission with T1/2=0.19 s<br />
[1]. The experimental trend with prevalent α-decay in Hs<br />
isotopes with N=157-167, but predominant SF in lighter<br />
as well as in heavier isotopes is close to that in [10],<br />
which suggests dominant α-decay from N=154 to N=166<br />
but SF for N>168. This indicates that stability vanishes<br />
rapidly with increasing distance from N=162.<br />
Measured cross sections for element 114 isotopes in the<br />
. 4<br />
. 2<br />
38-MeV run were<br />
7<br />
8.0 4.<br />
5<br />
+ 4<br />
− pb (3n channel) and 2.8 2.<br />
1<br />
+ − pb<br />
(4n channel), and in the 42-MeV run,<br />
3. 9<br />
1<br />
3. 3<br />
3.5 2.<br />
0<br />
+ − pb (3n<br />
channel) and 9.8 3.<br />
+ − pb (4n channel). Error bars include<br />
statistical uncertainties only (68.3% confidence level); the<br />
systematic uncertainty is estimated to 14%. In contrast to<br />
any other confirmation experiment, we confirm the large<br />
cross sections as reported from FLNR [1]. In fact, our<br />
measured cross sections are higher than those reported<br />
from the DGFRS. These high cross sections call for investigations<br />
of the details of the production mechanism.<br />
Production rates that follow from these values encourage<br />
using this nuclear reaction to produce relatively longlived<br />
isotopes of element 114, in particular for envisaged<br />
chemical investigations [14] or for γ-spectroscopic studies<br />
that allow shedding light on the nuclear structure in this<br />
SHE region and may facilitate unique Z identification.<br />
We thank the ECR and UNILAC staff for excellent<br />
48<br />
Ca beams and H. Brand and the <strong>GSI</strong> EE department, the<br />
machine shop staff at the institute of radiochemistry, TU<br />
Munich, and V. Gorshkov for technical support.<br />
References<br />
[1] Yu.Ts. Oganessian, J. Phys. G 34 (2007) R165.<br />
[2] S. Hofmann, EPJA 32 (2007) 251.<br />
[3] R. Eichler et al. Nature 447 (2007) 72.<br />
[4] L. Stavsetra et al., PRL 103 (2009) 132502.<br />
[5] S. Hofmann, Lect. Notes Phys. 264 (2009) 203.<br />
[6] M. Schädel, Eur. Phys. J. D 45 (2007) 67.<br />
[7] A. Semchenkov et al., NIM B 266 (2008) 4153<br />
[8] A. Gorshkov et al., in preparation for NIM A.<br />
[9] K.E. Gregorich et al., <strong>GSI</strong> Sci. Rep. 2006 (2007) 144.<br />
[10] Ch.E. Düllmann et al., submitted to PRL.<br />
[11] J.M. Gates et al., in preparation for PRC.<br />
[12] H.G. Essel et al., this Scientific Report.<br />
[13] R. Smolanczuk, PRC 52 (1995) 1871.<br />
[14] A. Yakushev et al., this Scientific Report.
<strong>GSI</strong> SCIENTIFIC REPORT 2009 NUSTAR-SHE-02<br />
Bρ<br />
HTM: Bρ<br />
SIM:<br />
171
NUSTAR-SHE-03 <strong>GSI</strong> SCIENTIFIC REPORT 2009<br />
172<br />
<strong>GSI</strong>Template2007<br />
σ / nbarn<br />
Cross-sections for production of neutron deficient Sg - isotopes in reactions<br />
54 Cr + 206,207,208 Pb<br />
F.P. Heßberger 1,2 , S. Antalic 3 , B. Streicher 1,4 , B. Sulignano 5,1 , D. Ackermann 1 , M. Block 1 , S. Heinz 1 ,<br />
S. Hofmann 1,6 , J. Khuyagbaatar 1 , B. Kindler 1 , I. Kojouharov 1 , B. Lommel 1 , R. Mann 1<br />
1 <strong>GSI</strong>-<strong>Helmholtzzentrum</strong> <strong>für</strong> <strong>Schwerionenforschung</strong>, Darmstadt, Germany; 2 Helmholtz - Institut Mainz, Mainz, Germany,<br />
3 Comenius University Bratislava, Bratislava, Slovakia , 4 University of Groningen, The Netherlands, 5 CEA Saclay,<br />
Gif-sur-Yvette, France, 6 Goethe-Universität Frankfurt, Frankfurt, Germany<br />
Due to low cross-sections for the production of heaviest<br />
nuclei the choice of the optimum reaction for specific<br />
nuclides is crucial for nuclear structure investigations<br />
based on α-γ-decay spectroscopy, which demand maximum<br />
numbers of observed events. Following previous<br />
decay studies of 255 No [1] and 257 Rf [2] an experiment to<br />
investigate 259 Sg, the next heavier N=153 isotone, for<br />
which only rough decay properties were known so far [3],<br />
was performed at SHIP in March 2009. The most efficient<br />
way to produce neutron deficient isotopes of seaborgium<br />
is employing reactions of 54 Cr with Pb - isotopes. Excitation<br />
functions for 54 Cr + 208 Pb [2] and 207 Pb [4] had been<br />
measured previously. The results are displayed in fig. 1.<br />
1<br />
0,1<br />
0,01<br />
10 12 14 16 18 20 22 24 26 28 30 32<br />
E* / MeV<br />
Figure 1: Excitation functions for the reactions<br />
208 Pb( 54 Cr,xn) 262-x Sg (blue symbols), 207 Pb( 54 Cr,xn) 261-x Sg<br />
(red symbols),<br />
206 Pb( 54 Cr,xn) 260-x Sg (wine symbols)<br />
(x=1,2). The full symbols represent the 1n - channels, the<br />
open symbols the 2n - channels. The lines represent the<br />
results of HIVAP calculations (full line = 1n channel,<br />
dashed line = 2n channel) for the corresponding systems.<br />
The arrows denote the positions of the Bass model fusion<br />
barriers [5] for the respective target - projectile combinations.<br />
HIVAP [6] calculations using parameterisations to reproduce<br />
the 1n and 2n cross-sections for the reaction 54 Cr +<br />
208 Pb were performed. Evidently this parameterisation<br />
satisfactorily reproduces also the 2n cross-sections for<br />
54 Cr + 207 Pb, while the 1n cross-section is underpredicted<br />
by roughly a factor of two. Going from 207 Pb to 206 Pb<br />
HIVAP predicts a decrease by roughly factors of 2.5 and<br />
4 for the 1n and 2n cross-sections, respectively, and in<br />
addition a shift of the excitation energy for the 1n cross-<br />
section maximum by ≈1.5 MeV towards higher values.<br />
Since the thus expected cross-section of ≈150 pb for<br />
259 Sg is only about a factor of two lower than the measured<br />
value for the reaction 207 Pb( 54 Cr,2n) 259 Sg and an astonishing<br />
high cross-section of ≈320 pb was obtained for<br />
the reaction 208 Pb( 54 Cr,1n) 259 Sg [7] it seemed valuable to<br />
test the reaction 206 Pb( 54 Cr,1n) 259 Sg as an alternative way<br />
of production. The result is shown in fig. 1 (wine symbols).<br />
A cross-section of ≈1 nb was measured for 259 Sg,<br />
which is even about 50% higher than the 1n cross-section<br />
using the more neutron rich target isotope 207 Pb. Differences<br />
of the 2n cross-section are less dramatic. One data<br />
point, close to the expected [6] maximum was taken. We<br />
obtained σ(2n) = 0.14±0.04 nb at E * = 22.5 MeV, which<br />
is roughly a factor of two higher than the predicted value<br />
and a factor of two lower than the 2n cross-section for the<br />
reaction 54 Cr + 207 Pb. This more 'regular' behavior does<br />
not suggest an enhanced stability of 259 Sg against prompt<br />
fission during the deexcitation process. The production<br />
ratios σ( 260 Sg,2n) / σ( 259 Sg,2n) ≈ 1.7 and σ( 260 Sg,1n) /<br />
σ( 259 Sg,1n) ≈ 0.6 do also not suggest a reduction of the<br />
SHIP transmission for 260 Sg due to a short-lived isomeric<br />
state decaying during the separation process. It rather<br />
hints at a strong nuclear structure influence of the target<br />
nucleus on the fusion probability at energies far below the<br />
fusion barrier, established at E * = 23.2±0.5 MeV for the<br />
three systems. More detailed measurements of excitation<br />
functions will show if this is just a local effect connected<br />
with the specific projectile or a more general phenomenon.<br />
In the latter case, only slightly decreasing 1n crosssections<br />
going from 208 Pb to the lighter isotopes 206 Pb or<br />
even 204 Pb, would not only give new insight into the process<br />
of 'cold' fusion, but also enhance our chances of continuing<br />
our program on detailed nuclear structure investigations<br />
of nuclei in the vicinity of the N = 152 subshell<br />
towards isotopes of elements above seaborgium (Z=106).<br />
References<br />
[1] F.P. Heßberger et al., EPJ A 29, 165 (2006)<br />
[2] B. Streicher, PHD, Comenius University Bratislava,<br />
2006, and to be published<br />
[3] F.P. Heßberger et al. EPJ A 41, 145 (2009)<br />
[4] B. Sulignano, PHD, Johannes-Gutenberg Universität<br />
Mainz, 2007<br />
[5] R. Bass, Nucl. Phys. A 231, 45 (1974)<br />
[6] W. Reisdorf, Z. Phys. A 300, 227 (1981)<br />
[7] C.M. Folden III et al. Phys. Rev. C 79, 027602 (2009)
<strong>GSI</strong> SCIENTIFIC REPORT 2009 NUSTAR-SHE-04<br />
Study of 240 Cf and new isotope 236 Cm<br />
J. Khuyagbaatar 1 , F.P. Heβberger 1 , S. Hofmann 1 , D. Ackermann 1 , V.S. Comas 2 , S. Heinz 1 ,<br />
J.A. Heredia 2 , B. Kindler 1 , I. Kojouharov 1 , B. Lommel 1 , R. Mann 1 , K. Nishio 3 and A. Yakushev 4<br />
1 <strong>GSI</strong> <strong>Helmholtzzentrum</strong> <strong>für</strong> <strong>Schwerionenforschung</strong>, Darmstadt, Germany, 2 Institute for Technologies and Applied Sciences,<br />
Habana, Cuba, 3 Japan Atomic Energy Agency (JAEA), Tokai, Japan, 4 Institut <strong>für</strong> Radiochemie, Technische Universität<br />
München, Garching, Germany<br />
Decay properties of neutron-deficient isotopes of actinide<br />
elements provide valuable information on the nuclear<br />
mass surface close to the proton drip line, on nuclear<br />
structure of deformed heavy nuclei and on fission properties<br />
far from stability. However, detailed experimental<br />
data on decay properties of neutron-deficient nuclei in the<br />
region of Z>96 are still scarce due to low production<br />
rates.<br />
Recently, attempts were carried out to investigate the<br />
decay properties of neutron-deficient isotopes of fermium<br />
[1]. Due to this renewed interest on decay properties of<br />
neutron-deficient isotopes we aimed to study the decay of<br />
the isotope 240 Cf at SHIP by measuring simultaneously α<br />
decay and spontaneous fission.<br />
The isotope 240 Cf was first identified in [2] by α decay.<br />
Spontaneous fission of this isotope was measured in [3]<br />
and a fission branching of ≈0.02 was deduced. However,<br />
in [3] only fission events were measured. Therefore, the<br />
estimated fission branching and deduced partial spontaneous<br />
fission half-life was based on a calculated total<br />
production cross-section in the fusion-evaporation reaction<br />
208 Pb( 34 S,2n) 240 Cf [3]. Consequently, this important<br />
decay property was relatively uncertain. In addition, an α<br />
decay branching of 240 Cf being close to one would open a<br />
possibility to search for the so far unknown isotope 236 Cm<br />
using the α-α and α-SF correlations.<br />
The reactions 36 S( 207 Pb,3n) and 36 S( 206 Pb,2n) were used<br />
for production of 240 Cf. Beam energies were at Elab=170.3<br />
and 163.3 MeV, respectively. Corresponding α decay<br />
spectra measured in the energy region (6500–7700) keV<br />
are shown in figs. 1a and b. The strongest line, observed<br />
at an energy of (7585±20) keV was attributed to 240 Cf<br />
according to the literature data [2]. In the reactions<br />
36 S( 206 Pb,2n) 240 Cf and 36 S( 207 Pb,3n) 240 Cf, a total number<br />
of ≈70 and ≈770 α decay events were observed, respectively,<br />
having full energy release in the focal plane detector.<br />
A so far unknown α line at E=(6954±20) keV was<br />
observed in both irradiations during the beam-off periods.<br />
To assign this line we performed a position and time<br />
correlation analysis (see fig. 1c). The scatter plot marks<br />
events which are in delayed coincidence within a position<br />
window of ±0.3 mm and within a time window of 25 min.<br />
The scatter plot clearly reveals a cluster of events at parent-daughter<br />
energies of 7585 and 6954 keV, respectively.<br />
In addition to these events we observe correlations<br />
to known α decays of 232 Pu, 228 U, 224 Th and 220 Ra. Therefore,<br />
we unambiguously assign the group of events at<br />
(7585±20) and (6954±20) keV to 240 Cf and to the new<br />
isotope 236 Cm, respectively.<br />
Counts / 5 keV<br />
E daugther / keV<br />
20<br />
15<br />
10<br />
5<br />
0<br />
100<br />
50<br />
7600 0<br />
7400<br />
7200<br />
7000<br />
6800<br />
6600<br />
232 Pu<br />
208,209 Fr<br />
228 U<br />
a) 239 Cf<br />
b)<br />
c)<br />
220<br />
211 Ra<br />
236 Po<br />
Cm 241<br />
224Th Cf<br />
6600 6800 7000 7200 7400 7600<br />
E / keV<br />
parent<br />
212,213 Ac<br />
240 Cf<br />
Fig 1: Alpha spectra taken during the beam-off periods in<br />
irradiations of 206 Pb with 36 S at Elab=163.6 MeV (a) and of<br />
207 Pb with 36 S at Elab=170.3 MeV (b). Two dimensional<br />
α-α correlation plot (c). Dashed lines mark the energies of<br />
α decays of 240 Cf and its decay products. See text for details.<br />
A half-life of (590±70) s was extracted for 236 Cm from<br />
the time distribution of the correlated events. An α<br />
branching of (0.18±0.02) was determined on the basis of<br />
the observed α decays for 240 Cf and 236 Cm.<br />
A total 22 spontaneous fission events was observed<br />
during the beam-off periods. They were assigned to the<br />
decay of 240 Cf, and a fission branching of (0.015±0.002)<br />
was deduced.<br />
The results of our work improve significantly the literature<br />
data. More detailed information will be given in [4].<br />
References<br />
[1] J. Khuyagbaatar et al., Eur. Phys. J. A 37, 177 (2008)<br />
and <strong>GSI</strong> Scientific Report 2008, 136 (2009).<br />
[2] R.J. Silva et al., Phys. Rev. C 2, 1948 (1970).<br />
[3] Yu.A. Lazarev et al., Phys. Rev. C 588, 501 (1995).<br />
[4] J. Khuyagbaatar et al., to be published.<br />
173
NUSTAR-SHE-05 <strong>GSI</strong> SCIENTIFIC REPORT 2009<br />
174<br />
<strong>GSI</strong>Template2007<br />
The capture process and first steps to cold fusion<br />
S. Heinz, V. Comas, S. Hofmann, D. Ackermann, J. Heredia, F.P. Heßberger, J. Khuyagbaatar,<br />
B. Kindler, B. Lommel, and R. Mann<br />
<strong>GSI</strong>, Darmstadt, Germany<br />
The synthesis of heavy elements in cold fusion reactions<br />
using lead and bismuth targets reveals maximum crosssections<br />
for central collisions at energies below the barrier<br />
predicted by the Bass model. The two-centre shell model<br />
[1] gives an approach to explain fusion at such low energies.<br />
It assumes that the nucleons move in a potential<br />
which is formed by combining the potentials of the individual<br />
nuclei. In central collisions at near-barrier energies<br />
the relative velocities and angular momenta are small and<br />
the valence nucleons can move between the reaction partners<br />
as soon as the outer orbits come into contact. We<br />
investigated the applicability of the two-centre shell<br />
model by following the capture process and first steps to<br />
the compound nucleus in the superheavy system 64 Ni +<br />
207 Pb (Zproj + Ztarget = 110). This was done by studying<br />
transfer products with proton numbers beyond the target<br />
proton number, which have been created under the same<br />
kinematical conditions which result in maximum yields of<br />
fusion products, namely, in central collisions and at nearbarrier<br />
energies.<br />
The experiment was performed at the velocity filter SHIP<br />
[2] which allows the detection of reaction products at angles<br />
of (0 ± 2)°. We measured at beam energies of 4.80,<br />
5.00, 5.20, 5.40, 5.53 and 5.92×A MeV. We detected several<br />
transfer products with proton numbers 84 ≤ Z ≤ 88<br />
via their α-decays. Figure 1c shows the excitation functions<br />
representatively for the isotopes 211 Po, 212 At, 213 Rn,<br />
213 Fr and 214 Ra (Z = 84 to 88). The excitation functions<br />
for isotopes with Z = 84, 85 and 86 are rather narrow<br />
(FWHM = 15 MeV) with maxima located below the Bass<br />
barrier (arrows). They are comparable to those from cold<br />
fusion reactions leading to superheavy elements after oneneutron<br />
evaporation (figs. 1a and b). At low energies fusion<br />
or transfer is hindered by the Coulomb barrier while<br />
towards higher energies other evaporation or fission<br />
channels open and lead to the decrease of the yield. The<br />
location of the maxima corresponds to a distance of ≥ 14<br />
fm between the nuclear centres, which just allows for the<br />
contact of the surfaces. According to the two-centre shell<br />
model this is sufficient to start the exchange of valence<br />
nucleons between the cores. For transfer products with Z<br />
> 86 the maxima of the excitation functions are located at<br />
higher energies and their half-widths are larger which<br />
points to higher excited primary products in comparison<br />
to the previous case. They are comparable to fusion excitation<br />
functions for evaporation channels with more than<br />
one nucleon. If and to what extent also the occupation of<br />
specific neutron and proton shells influences the capture<br />
process will be subject to future experiments.<br />
All observed transfer products originate from deep inelastic<br />
reactions. This is reflected by the total kinetic energies<br />
Figure 1. Excitation functions for 1n evaporation channels<br />
in the cold fusion reactions 58 Fe + 208 Pb and 64 Ni +<br />
208 Pb (a, b) and for different isotopes produced in transfer<br />
reactions in 64 Ni + 207 Pb collisions (c). The energy scale<br />
on the abscissa gives the excitation energy of the compound<br />
nuclei 266 Hs and 271 Ds.<br />
in the exit channel, which are independent of the bombarding<br />
energy and have values slightly below the Viola<br />
energy.<br />
The massive transfer of nucleons, which we observed at<br />
very low beam energies, has also an applicatory aspect.<br />
The low beam energies lead to transfer products at low<br />
excitation energies. This enhances their survival probability<br />
against particle evaporation and fission. Therefore,<br />
such transfer reactions could be used to create new isotopes<br />
of heavy nuclei, especially on the neutron-rich side<br />
of the nuclear chart.<br />
References<br />
[1] D. Scharnweber, W. Greiner, and U. Mosel, Nucl.<br />
Phys. A 164, 257 (1971).<br />
[2] S. Hofmann and G. Münzenberg, Rev. Mod. Phys. 72,<br />
733 (2000).
<strong>GSI</strong> SCIENTIFIC REPORT 2009 NUSTAR-SHE-06<br />
<strong>GSI</strong>Template2007<br />
Mass transfer and nuclear interaction times in deep inelastic U + U collisions<br />
S. Heinz 1 , C. Golabek 2 , W. Mittig 2 , F. Rejmund 2 , and A.C.C. Villari 2<br />
1 <strong>GSI</strong>, Darmstadt, Germany, 2 GANIL, Caen, France<br />
In heavy ion collisions at Coulomb barrier energies a dinuclear<br />
system (DNS) can be formed when the cores<br />
come into contact. This enables the exchange of nucleons<br />
which is usually accompanied by the dissipation of kinetic<br />
energy. During this time the nuclei stick together.<br />
We investigated 238 U + 238 U (Z = 184) collisions at the<br />
VAMOS spectrometer at GANIL at five beam energies in<br />
the interval (6.09 − 7.35)×A MeV. At 6.09×A MeV the<br />
Coulomb barrier is not reached at all mutual orientations<br />
of the deformed uranium nuclei. The spectrometer covered<br />
the angles (35 ± 5)°. We observed a massive transfer<br />
of nucleons resulting in reaction products far from the<br />
entrance channel. Only nuclei lighter than uranium were<br />
observed. The transfer was correlated with a large energy<br />
dissipation of up to several 100 MeV. Fig. 1 shows the<br />
total kinetic energy (TKE) in the exit channel as a function<br />
of the detected fragment mass for all beam energies.<br />
Figure 1. Total kinetic energy of (quasi-)elastic and deep<br />
inelastic reaction products from 238 U + 238 U collisions at<br />
different beam energies. Vb denotes the Coulomb barrier<br />
of the exit channel for spherical nuclei.<br />
Two regions can be distinguished. For 225 < A < 238<br />
TKE is strongly beam energy dependent like expected for<br />
elastic and quasi-elastic reactions. For A < 225 the correlation<br />
between TKE and A becomes linear and for the four<br />
highest energies TKE is nearly independent of the bombarding<br />
energy. This is characteristic for deep inelastic<br />
reactions where all kinetic energy is damped leading to<br />
the re-separation of the di-nuclear system with the Coulomb<br />
barrier of the exit channel. In all cases the observed<br />
TKE is below the Coulomb barrier for spherical nuclei,<br />
which is about 750 MeV for all observed exit channels. At<br />
all beam energies the deep inelastic region is entered at<br />
the same TKE of 690 MeV. This reflects that massive<br />
transfer is only starting when the di-nuclear system<br />
reaches a certain deformation and provides a sufficiently<br />
strong neck. Fig. 2 shows the mass distributions for deep<br />
Figure 2. Mass distribution of deep inelastic reaction<br />
products from 238 U + 238 U collisions at 7.35×A MeV for<br />
different windows on TKEL.<br />
inelastic products for different windows on the total kinetic<br />
energy loss (TKEL) for the beam energy 7.35×A<br />
MeV. With increasing TKEL the maximum of the distribution<br />
shifts towards lower masses and its width increases.<br />
We attribute the shift mainly to sequential fission<br />
of the excited primary reaction products, which affects<br />
with increasing excitation energy also the nuclei lighter<br />
than uranium.<br />
Our results show the characteristics of a diffusion process<br />
as origin of the observed nuclei. Therefore, we applied<br />
the diffusion model [1] to derive values for the underlying<br />
nuclear interaction times Tint. According to this model Tint<br />
increases linearly with the variance of the mass distribution.<br />
We deduced the respective values for Tint for the<br />
TKEL windows given in Fig. 2. Predominantly, the deep<br />
inelastic events result from reactions where Tint is not<br />
longer than 2×10 -21 s. The longest time delay of 8×10 -21 s<br />
we obtain for events with TKEL = (300 – 350) MeV. This<br />
converts to a differential cross-section of 400 µb/sr for the<br />
covered angular range and corresponds to a fraction of<br />
3% of all deep inelastic transfer products with TKEL ≥<br />
100 MeV.<br />
We observed no nuclei heavier than uranium due to fission<br />
of these products. Moreover, the high background in<br />
the region 238 < A < 260 set a lower cross-section limit of<br />
1 mb. Nevertheless, the large nucleon transfer also observed<br />
at the lowest beam energies could open a way to<br />
produce neutron-rich heavy nuclei in the region of Z ><br />
100, which are not accessible in other reactions. Especially<br />
at low beam energies the excitation energy of the<br />
fragments is moderate, which increases their survival<br />
against sequential fission.<br />
References<br />
[1] C. Riedel and W. Nörenberg, Z. Phys. A 290, 385<br />
(1979).<br />
175
NUSTAR-SHE-07 <strong>GSI</strong> SCIENTIFIC REPORT 2009<br />
Towards a direct mass measurement of Lr at SHIPTRAP<br />
M. Dworschak 1 , D. Ackermann 1 , K. Blaum 2,3 , M. Block 1 , C. Droese 4 , S. Eliseev 2 , E. Haettner 1,5 ,<br />
F. Herfurth 1 , F.P. He berger 1 , S. Hofmann 1 , J. Ketelaer 6 , G. Marx 4 , D. Nesterenko 7 , Yu. Novikov 1,7 ,<br />
W.R. Pla 1,5 , A. Popeko 8 , D. Rodríguez 9 , C. Scheidenberger 1,5 , L. Schweikhard 4 , P. Thirolf 10 , and<br />
C. Weber 10<br />
1 <strong>GSI</strong>, Darmstadt; 2 MPI-K Heidelberg; 3 Universität Heidelberg; 4 Universität Greifswald; 5 Universität Gie en;<br />
6 Universität Mainz; 7 Petersburg Nuclear Physics Institute; 8 JINR, Dubna; 9 Universidad de Granada; 10 LMU München<br />
The mass of a nuclide is a fundamental parameter. It<br />
provides information about the nuclear binding energy and<br />
is thus crucial for nuclear structure and reaction studies.<br />
Compared to the indirect mass determination via decay energies,<br />
a method in which the mass can be directly obtained<br />
is favorable since it is independent of a detailed knowledge<br />
of nuclear level schemes. Especially in the region of<br />
transuranium nuclides direct mass measurements are desirable<br />
to check the information on the binding energy which<br />
is presently based on spectroscopic data.<br />
The Penning-trap mass spectrometer SHIPTRAP [1]<br />
is presently the only facility where direct measurements<br />
on transfermium nuclides can be performed. After the<br />
first successful experiments on three nobelium isotopes<br />
( =102) [2] the focus was set on extending direct mass<br />
measurements to higher . For the next step the isotope<br />
Lr was selected, which is of specific interest since its<br />
mass, as well as that of its daughter nuclide Md, are<br />
presently only estimated from systematic trends. Furthermore,<br />
two low-lying levels decaying by emission have<br />
been observed. The excitation energy of the isomeric<br />
state could not be determined so far but has to be settled<br />
at . A direct mass determination would<br />
thus provide more information on ground state masses and<br />
would hence be another anchorpoint in an odd-even -<br />
decay chain.<br />
The nuclei investigated at SHIPTRAP were produced by<br />
fusion-evaporation reactions and were separated from the<br />
primary beam by the velocity filter SHIP [3]. Lr was<br />
produced in the reaction Bi( Ca,2n) Lr at a primary<br />
beam energy of 4.55 MeV/u with a cross section of about<br />
200 nb. This corresponds to a rate of about 0.3 ions per<br />
second measured at a position-sensitive silicon detector in<br />
front of SHIPTRAP. The reaction products with kinetic energies<br />
of about 40 MeV were decelerated in degrader foils<br />
and were stopped in a gas cell at 50 mbar helium. The<br />
lawrencium atoms were extracted from the gas as singly<br />
and doubly charged ions.<br />
After the extraction from the gas cell the ions were<br />
cooled and accumulated in an RFQ structure and then<br />
ejected as a short ion bunch. Subsequently, the ions were<br />
injected into a double Penning trap system, which is consisting<br />
of a preparation trap and a measurement trap, placed<br />
in a 7T magnet. In the latter the mass was determined by<br />
measuring the cyclotron frequency of the ions using a<br />
176<br />
time-of-flight cyclotron-resonance-detection technique.<br />
���������������������� �<br />
���<br />
���<br />
���<br />
���<br />
���<br />
���<br />
���<br />
��� �� �<br />
� ��� ���������<br />
���<br />
��� ��� ��� �� �� �� �� � � � � � �� �� ��<br />
������������������������ �<br />
Figure 1: Time-of-flight resonance of Lr . The solid<br />
line is a fit of the theoretical line shape to the experimental<br />
data points.<br />
Altogether around 30 Lr ions were detected in about<br />
30 hours measurement time and the time-of-flight resonance<br />
shown in Fig. 1 was obtained. Lr is thus both,<br />
the heaviest radionuclide and the one with the lowest production<br />
rate ever studied in a Penning trap.<br />
The SHIPTRAP measurements on nobelium and lawrencium<br />
are first steps away from the well-studied region of<br />
known masses towards direct mass measurements of superheavy<br />
nuclides. Further improvements of the experimental<br />
setup will pave the way to address nuclides with even<br />
lower production rates. One goal is to fix the endpoints<br />
of -decay chains originating from superheavy nuclei that<br />
currently are not connected to the area of known nuclei.<br />
This will open up new perspectives for the identification of<br />
long-lived elements on the predicted island of stability.<br />
References<br />
[1] M. Block et al., Eur. Phys. Jour. D 45 (2007) 39.<br />
[2] M. Block et al., Nature, in print (2010).<br />
[3] G. Münzenberg et al., Nucl. Instr. Meth. 161 (1979) 65.
<strong>GSI</strong> SCIENTIFIC REPORT 2009 NUSTAR-SHE-08<br />
TRAPSPEC – Towards Isotope-Selected Decay Spectroscopy ∗<br />
D. Rudolph 1 , M. Block 2 , F.P. Heßberger 2,3 , D. Ackermann 2 , L.-L. Andersson 4 , M.L. Cortes 5,* , C.<br />
Droese 6 , M. Dworschak 2 , M. Eibach 7,8 , U. Forsberg 1,* , P. Golubev 1 , R. Hoischen 1,2 , J. Ketelaer 7 , I.<br />
Kojouharov 2 , J. Khuyagbaatar 2 , D. Nesterenko 2,9 , H. Schaffner 2 , S. Stolze 10,* , and the SHIPTRAP<br />
collaboration 1<br />
1 Lund University, Sweden; 2 <strong>GSI</strong> <strong>Helmholtzzentrum</strong>, Darmstadt, Germany; 3 HIM, Mainz, Germany; 4 University of<br />
Liverpool, UK; 5 Universidad Nacional, Bogotá, Colombia; 6 Universität Greifswald, Germany; 7 Universität Mainz,<br />
Germany; 8 Universität Heidelberg, Germany; 9 PNPI, St. Petersburg, Russia; 10 University of Jyväskylä, Finland<br />
Contemporary nuclear structure studies aim at nuclei far<br />
from the line of stability. While the neutron-rich outskirts<br />
of the chart of nuclides can only be reached by fragmentation<br />
or fission of relativistic heavy-ion beams, fusionevaporation<br />
reactions may still compete on the neutrondeficient<br />
side, but continue to remain the only reliable way<br />
to produce superheavy elements (SHE). With production<br />
cross-sections in the regime of µb down to pb, however,<br />
preparing isotopically clean and thus unambiguous identification<br />
of decay products becomes ever more essential:<br />
Even in the focal planes of velocity and/or A/q recoil separators,<br />
the needles of interest are usually hidden in the<br />
hay stack of isobaric analogues (neutron-deficient nuclei)<br />
and/or inevitable background (SHE).<br />
Penning Traps Detector<br />
Purification trap<br />
Superconducting<br />
magnet<br />
Diaphragm<br />
MCP<br />
detector<br />
(ToF)<br />
Measurement trap<br />
Silicon box<br />
Focussing<br />
tube<br />
TRAPSPEC<br />
4xSSSSD<br />
DSSSD<br />
’Implantation’<br />
Cluster− and<br />
Clover−type<br />
Ge detectors<br />
Figure 1: Schematic view of the rear section of SHIPTRAP<br />
and the TRAPSPEC extension.<br />
Figure 1 provides a sketch of the <strong>GSI</strong>-unique opportunity<br />
for isotopically pure decay spectroscopy of exotic neutrondeficient<br />
isotopes and/or SHE. The price to pay is the efficiencies<br />
to stop and extract ions in the SHIPTRAP gas-cell<br />
[1]. Instead of invoking mass measurements with the second<br />
penning trap and the MCP time-of-flight detector at the<br />
SHIPTRAP exit, the nuclei in either ground or metastable<br />
states of interest are extracted from the purification trap<br />
with tiny kinetic energies through a focussing tube (-300 V)<br />
into a silicon box surrounded by composite germanium detectors.<br />
This ’TRAPSPEC’ arrangement is basically identical<br />
to the succesfully commissioned TASISPEC set-up developed<br />
for SHE-spectroscopy behind TASCA [2, 3].<br />
In 2009 TRAPSPEC was commissioned with the reaction<br />
170 Er( 48 Ca,5n) 213 Ra [4]. One VEGA-Clover and one<br />
EUROBALL-Cluster Ge-detector were used in conjuction<br />
with four single-sided Si-strip box detectors (SSSSD) and<br />
one double sided Si-strip implantation detector (DSSSD).<br />
Following the unexpected experience of actually being able<br />
∗ Supported by the 2009 <strong>GSI</strong> Summer Student Program.<br />
−45V<br />
SSSD left:<br />
y<br />
SSSD top: −45V<br />
x<br />
SSSD bottom: −45V<br />
SSSD right: −45V<br />
SSSD left: −125V<br />
y<br />
SSSD top: −75V<br />
SSSD right: −100V<br />
x<br />
SSSD bottom: −100V<br />
Figure 2: DSSSD position distribution of 213 Ra α-decays<br />
with two different sets of bias voltages on the four SSSSDs.<br />
to steer the 213 Ra nuclei with the detector bias applied to<br />
the Si box detectors (Fig. 2), a transport efficiency of essentially<br />
100 % from the nominal MCP spot onto the TRAP-<br />
SPEC DSSSD was achieved. This led to the prompt α-γ(γ)<br />
coincidence spectra displayed in Fig. 3, acquired within<br />
only 12 hours of parasitic beam time (Ibeam ∼ 30 pnA).<br />
The spectra are in line with Ref. [4], even providing one<br />
110-218 keV coincidence event.<br />
Scaling roughly the numbers by taking the 130 α-γ coincidences<br />
of the 215-keV peak in Fig. 3, comprehensive<br />
decay spectroscopy on the level of some 20 nb should be<br />
straightforward with the complete TRAPSPEC set-up.<br />
Counts per Channel<br />
1000<br />
100<br />
10<br />
1<br />
X−rays<br />
Rn<br />
105<br />
110<br />
singles<br />
coincidence 110 keV<br />
215<br />
218<br />
296<br />
328<br />
213 Ra<br />
1/2−<br />
0 100 200 300 400<br />
Gamma-ray Energy (keV)<br />
alpha−decay<br />
328<br />
209 Rn<br />
218<br />
105<br />
110<br />
296<br />
215<br />
3/2−<br />
1/2−<br />
5/2−<br />
Figure 3: Gamma-ray spectra in prompt coincidence with<br />
observed 213 Ra α-decays. Black: Total projection. Magenta:<br />
Coincidence with the 110-keV ground-state transition<br />
in 209 Rn. The inset provides a simplified sketch of the<br />
decay scheme [4].<br />
References<br />
[1] J.B. Neumayr et al., Nucl. Instr. Meth. B 244, 489 (2006).<br />
[2] L.-L. Andersson et al., <strong>GSI</strong> Scientific Report 2008, p. 142;<br />
ibid, 2009.<br />
[3] L.-L. Andersson et al., submitted to Nucl. Instr. Meth. A.<br />
[4] P. Kuusiniemi et al., Eur. Phys. J. A 30, 551 (2006).<br />
177
NUSTAR-SHE-09 <strong>GSI</strong> SCIENTIFIC REPORT 2009<br />
TASISpec – Heading towards its first experiment.<br />
L.-L. Andersson 1 , D. Rudolph 2 , D. Ackermann 3 , Ch.E. Düllmann 3 , K. Eberhardt 4 , J. Even 4 ,<br />
U. Forsberg 2 , J. Gellanki 2 , J. Gerl 3 , P. Golubev 2 , R. Hoischen 2,3 , R.-D. Herzberg 1 , F.P. Heßberger 3 ,<br />
E. Jäger 3 , J. Khuyagbaatar 3 , I. Kojouharov 3 , J.V. Kratz 4 , J. Krier 3 , N. Kurz 3 , E. Merchán 3 ,<br />
W. Prokopowicz 3 , M. Schädel 3 , H. Schaffner 3 , B. Schausten 3 , E. Schimpf 3 , A. Semchenkov 5,6 ,<br />
A. Türler 5,7 , H.-J. Wollersheim 3 , A. Yakushev 5 , and P. Thörle-Pospiech 4<br />
1 University of Liverpool, Oliver Lodge Laboratory, Liverpool L69 7ZE, United Kingdom; 2 Department of Physics,<br />
Lund University, S-22100 Lund, Sweden; 3 <strong>GSI</strong> <strong>Helmholtzzentrum</strong> <strong>für</strong> <strong>Schwerionenforschung</strong> GmbH, D-64291<br />
Darmstadt, Germany; 4 Universität Mainz, D-55128 Mainz, Germany; 5 Technische Universität München, D-85748<br />
Garching, Germany; 6 University of Oslo, 0315 Oslo, Norway; 7 Paul Scherrer Institute, 5232 Villigen, Switzerland<br />
TASISpec (TAsca Small Image mode Spectroscopy) [1,<br />
2] is a Si and Ge detector setup optimised for particle-γ-<br />
X-ray coincidence spectroscopy of superheavy elements<br />
in conjunction with the TASCA separator [3]. The detection<br />
system consists of 192 Si strips distributed over one<br />
double sided silicon strip detector (DSSSD) and four single<br />
sided silicon strip detectors (SSSSD). The DSSSD is<br />
the focal plane detector into which the residual nuclei are<br />
implanted and their subsequent decay products such as fission<br />
fragments or α particles are detected. The SSSSDs<br />
form a “box” upstream from the DSSSD and they are used<br />
to detect α particles which have escaped detection in the<br />
DSSSD, conversion electrons (CE) and possibly the second<br />
fission fragment. A seven-crystal Ge cluster detector<br />
is mounted directly behind the DSSSD and four clover detectors<br />
are mounted behind the four SSSSDs. The complete<br />
setup is thus composed of a total of 23 Ge crystals.<br />
The setup is constructed to enable multi-coincidence<br />
spectroscopy such as α-γ-CE and α-γ-γ with unprecedented<br />
γ-ray efficiency and thus reveal essential information<br />
necessary to build reliable level schemes for superheavy<br />
elements.<br />
During 2009 a thorough evaluation of the commissioning<br />
experiments was performed [2]. This involved amongst<br />
others detection efficiencies and implant-decay correlation<br />
times. As an example, the decay of 253 No has been explored.<br />
The half life of the ground state was previously determined<br />
to T 1/2 = 1.56(2) min [4]. In the present analysis<br />
the half life is determined to T 1/2 = 1.61(21) min where<br />
the uncertainty originates mainly from the small number<br />
of α particles, which could be included in the analysis. In<br />
Fig. 1 the DSSSD hitpattern is shown. It shows the pixels in<br />
which the 8.0 MeV α particles relating to the decay of the<br />
ground state of 253 No were detected. As can be seen in this<br />
figure the implants are nicely focused into a very narrow<br />
spot. Since the half life of 253 No is rather long the pixels<br />
in the very centre of the focal spot where the implantation<br />
rates are at its highest, were excluded when determining<br />
the half life. This minimises the risk of random correlations<br />
between the incoming evaporation residues and the α<br />
particles.<br />
In a commissioning run in July 2009 was the reaction<br />
208 Pb( 48 Ca,1n) 255 No applied to explore the benefits<br />
178<br />
gained from the usage of pulse-shape electronics. Pulse<br />
shape analysis could yield particle identification due to distinct<br />
ionisation schemes in the semiconductor material for<br />
different incidenting particles, like e.g. α particles and CE.<br />
In the beginning of 2009 TASISpec was granted beamtime<br />
for its first main beam experiment. The experiment<br />
is scheduled for spring 2010 and will aim to explore Kisomers<br />
in 253 No in detail.<br />
y−axis (mm)<br />
60<br />
50<br />
40<br />
30<br />
20<br />
10<br />
0<br />
Excluded from the<br />
T analysis<br />
1/2<br />
0 10 20 30 40 50 60<br />
x−axis (mm)<br />
Figure 1: The position of the detected 253 No correlated alpha<br />
particles in the DSSSD. On the x and y-axis the size of<br />
the DSSSD is indicated.<br />
References<br />
[1] L. -L. Andersson et al. <strong>GSI</strong> Scientific report 2008.<br />
http://www-wnt.gsi.de/kernchemie/images/<br />
PDF 2008/NUSTAR-SHE-11.pdf<br />
[2] L. -L. Andersson et al., submitted to Nucl. Instrum. Meth.<br />
[3] A. Semchenkov et al., Nucl. Instrum. Meth. Phys. Res. B 266,<br />
4153 (2008).<br />
[4] R.-D. Herzberg et al., Eur. Phys. J. A (2009).
<strong>GSI</strong> SCIENTIFIC REPORT 2009 NUSTAR-SHE-10<br />
* Work supported by the BMBF (06MT247I, 06MT248);<br />
the <strong>GSI</strong>-F&E (MT/TÜR).<br />
† Current address: Bern University & PSI Villigen, Swit-<br />
zerland<br />
# alexander.gorshkov@radiochemie.de<br />
<strong>GSI</strong>Temp late2007<br />
A new TASCA focal plane detector setup and DAQ system*<br />
A. Gorshkov 1# , J.M. Gates 1,2 , R. Graeger 1 , A. Türler 1† , A. Yakushev 1 , D. Ackermann 2 , W. Brüchle 2 ,<br />
Ch.E. Düllmann 2 , H.G. Essel 2 , E. Jäger 2 , J. Khuyagbaatar 2 , I. Kojouharov 2 , J. Krier 2 , N. Kurz 2 , M.<br />
Schädel 2 , B. Schausten 2 , E. Schimpf 2 , J. Dvorak 3,4 , L.-L. Andersson 5 , D. Rudolph 6 , M. Wegrzecki 7<br />
1 TU Munich, Garching, Germany; 2 <strong>GSI</strong>, Darmstadt, Germany; 3 LBNL, Berkeley, CA, U.S.A; 4 University of California,<br />
Berkeley, CA, U.S.A.; 5 University of Liverpool, UK; 6 University of Lund, Sweden; 7 ITE, Warsaw, Poland<br />
During the TASCA commissioning phase competitive<br />
tests of two types of focal plane detectors for TASCA – a<br />
Position Sensitive Silicon Stripe Detector (PSSSD) and a<br />
Double Sided Silicon Strip Detector (DSSSD) - have been<br />
performed. The DSSSD proved to be more reliable and<br />
more sensitive for the detection of decay chains due to the<br />
high granularity of the DSSSD; moreover the position<br />
resolution of the DSSSD is independent of implantation<br />
position and deposited energy [1, 2]. The new TASCA<br />
focal plane detector setup consists of a Multi Wire Proportional<br />
Counter (MWPC) and a Focal Plane Detector<br />
Box (FPDB). The implantation detector of the FPDB consists<br />
of two side-by-side mounted 300 μm-thick DSSSDs<br />
with an active size of 72x48 mm 2 each mounted on a PCB<br />
frame. Eight 500 μm-thick Single Sided Silicon Strip Detectors<br />
(SSSSD) of the same size form a backward array –<br />
a four-sided box with an open side of 144x48 mm 2 and a<br />
depth of 72 mm (Fig. 1) [3]. The DSSSD comprises 144<br />
vertical strips on the front side and 48 horizontal strips on<br />
the back side, each with 1 mm pitch size. Spectrometric<br />
signals are read out from the front and back sides. They<br />
provide implantation and decay energies and (x,y) coordinates<br />
with a position resolution of 1 mm. While the registration<br />
efficiency from the back side is almost 100%, the<br />
one from the front side is about 90% due to a gap of 100<br />
μm between the strips. Each SSSSD has 8 strips with an<br />
active area 5.7x72 mm 2 without position resolution. The<br />
energy resolution in the DSSSD was 25 keV (FWHM)<br />
for 8.1 MeV α-particles measured with implanted 254 No<br />
depositing their full energy in the DSSSD and 170 keV<br />
for reconstructed α-particles that deposited a fraction of<br />
their energy inside the DSSSD and the remainder in the<br />
SSSSD. The average detection efficiency of the FPDB for<br />
α-particles emitted from a nucleus implanted in the active<br />
area of the DSSSD is 72%. Two additional SSSSDs are<br />
mounted behind the implantation detector and serve as a<br />
punch-through veto detector for light fast ions. The<br />
punch-through detector together with the MWPC serves<br />
for discriminating between ions recoiling from the target,<br />
radioactive decays of implanted species, and fast light<br />
ions. A cluster Ge-detector consisting of seven crystals<br />
was installed ~30 mm behind the FPDB for γ-ray measurements<br />
in coincidence with ¡- or SF decays.<br />
In total 640 spectrometric channels (320 for the ¡-<br />
particle branch and 320 for the SF branch) are required to<br />
readout the FPDB. To minimize the total number of ADC<br />
channels, 8-channel dual-range amplifiers with integrated<br />
multiplexers were built. 40 analog output signals from the<br />
¡-particle branch and 40 ones from the SF branch are connected<br />
to inputs of three V785 32-channel peak sensing<br />
ADCs (CAEN). 40 digital 3-bit outputs from the amplifiers<br />
with address codes of the fired strips are stored in four<br />
SIS 3820-3600 32-channel I/O VME registers (Struck<br />
GmbH). Analog signals from Ge-detectors are digitized in<br />
the SIS 3302 8-channel 100 MS/s 16-bit flash ADC<br />
(Struck GmbH). The amplifiers have a logical trigger output<br />
with adjustable discriminator level. All trigger outputs<br />
from the amplifiers are collected by “OR” in a CAMAC<br />
Common Trigger module. When a processed common<br />
trigger signal is accepted by a VME trigger module<br />
TRIVA5, the amplitudes of all fired ADC channels, the<br />
status of all registers, and time stamps are read out by a<br />
RIO4 (CES) frontend VME controller using the MBS<br />
software package. The total readout dead time was about<br />
50 μs; a shorter dead time of ~30 μs was measured without<br />
Ge-detectors reading. Visualization as well as on-line<br />
and off-line analysis was performed using the software<br />
package GO4 [4].<br />
The new detector setup and new DAQ system have<br />
been successfully used during the experiment on the synthesis<br />
of element 114 performed at TASCA in 2009 [5].<br />
Figure 1: The new DSSSD-based TASCA FPDB.<br />
References<br />
[1] A. Gorshkov et al., <strong>GSI</strong> Sci. Rep. 2008, p. 140,<br />
[2] A. Gorshkov et al., Phys. Rev. C, to be submitted.<br />
[3] A. Gorskov et al., NIM A, to be submitted.<br />
[4] H.G. Essel et al., <strong>GSI</strong> Sci. Report 2009, p. ???<br />
[5] Ch.E. Düllmann et al., <strong>GSI</strong> Sci. Report 2009, p. ???<br />
179
NUSTAR-SHE-11 <strong>GSI</strong> SCIENTIFIC REPORT 2009<br />
* Work supported by the BMBF (06MT247I, 06MT248);<br />
the <strong>GSI</strong>-F&E (MT/TÜR).<br />
† Current address: Bern University & PSI Villigen, Swit-<br />
zerland<br />
# alexander.yakushev@radiochemie.de<br />
<strong>GSI</strong>Temp late2007<br />
COMPACT Coupled to TASCA for Element 114 Chemistry*<br />
A. Yakushev 1# , J.M. Gates 1,2 , A. Gorshkov 1 , R. Graeger 1 , A. Türler 1† , D. Ackermann 2 , M. Block 2 ,<br />
W. Brüchle 2 , Ch.E. Düllmann 2,3 , H.G. Essel 2 , F.P. Heßberger 2,3 , A. Hübner 2 , E. Jäger 2 , J. Khuyagbaatar<br />
2 , B. Kindler 2 , J. Krier 2 , N. Kurz 2 , B. Lommel 2 , M. Schädel 2 , B. Schausten 2 , E. Schimpf 2 , K.<br />
Eberhardt 4 , M. Eibach 4 , J. Even 4 , D. Hild 4 , J.V. Kratz 4 , L.J. Niewisch 4 , J. Runke 4 , P. Töhrle-<br />
Pospiech 4 , N. Wiehl 4 , J. Dvorak 5,6 , H. Nitsche 5,6 , J.P Omtvedt 7 , A. Semchenkov 7 , U. Forsberg 8 , D.<br />
Rudolph 8 , J. Uusitalo 9 , L.-L. Andersson 10 , R.-D. Herzberg 10 , E. Parr 10 , Z. Qin 11 , M. Wegrzecki 12<br />
1 TU Munich, Garching, Germany; 2 <strong>GSI</strong>, Darmstadt, Germany; 3 Helmholtz Institute Mainz, Germany; 4 University of<br />
Mainz, Germany; 5 LBNL, Berkeley, CA, U.S.A; 6 University of California, Berkeley, CA, U.S.A.; 7 University of Oslo,<br />
Norway; 8 Lund University, Sweden; 9 University of Jyväskylä, Finland; 10 University of Liverpool, UK; 11 IMP, Lanzhou,<br />
P.R. China, 12 ITE, Warsaw, Poland<br />
The unambiguous identification of new superheavy<br />
elements (SHE) is a very difficult task for both, physicists<br />
and chemists due to very low production rates, absence of<br />
a link to known isotopes, and unknown chemical, and<br />
decay properties. Chemical studies of SHE are of great<br />
importance because they can identify the proton number<br />
of the studied isotopes. Coupling of chemistry setups to<br />
physical recoil separators allows chemical experiments<br />
with extremely high sensitivity due to a strong suppression<br />
of unwanted byproducts in the preseparator [1]. At<br />
<strong>GSI</strong>, the new gas-filled separator TASCA has been put<br />
into operation in 2008. It is designed specifically for<br />
chemical studies of transactinides produced in nuclear<br />
fusion reactions of 48 Ca beams with actinide targets [2].<br />
The highest cross section for SHE formation was observed<br />
in the reaction 48 Ca+ 244 Pu [3,4] leading to element<br />
114 (E114). First attempts to chemically identify E114<br />
were performed by a PSI-FLNR-LLNL collaboration in<br />
Dubna, and an unexpectedly low adsorption enthalpy of<br />
element 114 on gold was reported [5], in contradiction<br />
with theoretical predictions of the trend in the binding<br />
energy, Eb, Pb>>E114>Hg>E112 [6]. These studies were<br />
performed without preseparation, and the relatively high<br />
counting rate from unwanted byproducts led to controversially<br />
discussed results. An attempt to observe E114 in the<br />
chemistry experiment after preseparation failed [7].<br />
A chemistry experiment with E114 was carried out at<br />
TASCA in 2009. Because the lifetimes of even the longest-lived<br />
E114 isotopes, 288,289 114, are short [4], TASCA<br />
was operated in the Small Image Mode (SIM) [2], which<br />
focuses fusion products into a small area of about ~30x40<br />
mm 2 . The lower transmission efficiency of SIM (~35%)<br />
compared to HTM (~60%) is compensated by the smaller<br />
volume of the Recoil Transfer Chamber (RTC), which<br />
allows a faster transport of products to a detection setup.<br />
During the experiment on the synthesis of 288,289 114 [4],<br />
the operation of TASCA in SIM was successfully tested<br />
with a focal plane detector. A beam dose of 0.98⋅10 18 48 Ca<br />
ions at E*( 292 114)=42 MeV was acquired and two 288 114<br />
180<br />
decay chains were observed. In the preparation of the<br />
experiment two RTCs made of Teflon were tested: a<br />
“small” one with a volume of 14 cm 3 and a “large” one<br />
with 29 cm 3 . Transport times and yields to COMPACT<br />
[8] were optimized for both chambers with short-lived Hg<br />
and Pb isotopes produced with 40 Ar and 48 Ca beams.<br />
Transport times of 0.6 s and 0.8 s were measured at a gas<br />
flow rate 1.3 l/min for the “small” and “large” RTC, respectively.<br />
Three different He/Ar gas mixtures with ratios<br />
of 30:70, 50:50, and 70:30 were explored. The last one<br />
was selected for the E114 chemistry experiment. Two<br />
similar COMPACT detectors connected in series were<br />
used; each detector consisted of 32 pairs of 1x1 cm 2 PIN<br />
diodes covered with a 35-nm thick gold layer. The first<br />
detector, kept at the room temperature, was connected<br />
directly to the RTC exit via a 2-cm long Teflon tube.<br />
The second detector, connected via a 30-cm long Teflon<br />
capillary, was placed downstream of the first one; a<br />
temperature gradient from +20 to −162 °C was applied<br />
along it. The use of two detectors in series allows detecting<br />
species in a wide range of volatilities – from the nonvolatile<br />
Pb to the noble gas Rn (Fig. 1). With this setup<br />
the adsorption enthalpy of short-lived 288,289 114 on gold<br />
was measured with relatively high efficiency under background-free<br />
conditions. The data are under evaluation.<br />
Figure1:Pb, Hg and Rn distributions in COMPACT.<br />
References<br />
[1] Ch. E. Düllmann, Eur. Phys. J. D 45, 75 (2007).<br />
[2] A. Semchenkov et al. NIM B 266, 4153 (2008).<br />
[3] Yu. Oganessian, J. Phys. G 34, R165 (2007).<br />
[4] Ch. E. Düllmann et al. This report, p.???(2010).<br />
[5] R. Eichler et al. Radiochim. Acta, accepted (2009).<br />
[6] V. Pershina et al. J. Chem. Phys. 131, 084713 (2009).<br />
[7] D. Wittwer et al. Nucl. Instr. Meth. B 268, 28 (2010).<br />
[8] J. Dvorak et al. Phys. Rev. Lett. 97, 242501 (2006).
<strong>GSI</strong> SCIENTIFIC REPORT 2009 NUSTAR-SHE-12<br />
Pilot-Test Experiment with Os of a SISAK Setup for Hs-Chemistry Studies<br />
F. Samadani 1 , J. Alstad 1 , F. Schulz 1 , J. Nilssen 1 , J.P. Omtvedt 1 , H.B. Ottesen 1 , S. Qureshi 1 , Ch.E.<br />
Düllmann 2 , J.M. Gates 2 , E. Jäger 2 , J. Khuyagbaatar 2 , J. Krier 2 ,M. Schädel 2 , B. Schausten 2 , K. Eberhardt<br />
3 , J. Even 3 , D. Hild 3 , J.V. Kratz 3 , Ch. Roth 3 , N. Wiehl 3 , A. Türler 4 , A. Yakushev 4<br />
<strong>GSI</strong>Template2007<br />
1 University of Oslo, Norway, 2 <strong>GSI</strong>, Darmstadt, Germany, 3 Johannes Gutenberg-<br />
University of Mainz, Germany, 4 TU Munich, Garching, Germany<br />
A liquid-liquid extraction system for investigating<br />
chemical properties of element 108, hassium, was developed<br />
[1] using γ-emitting 181 Os produced at the Oslo Cyclotron<br />
Laboratory (OCL). The system is targeted for the<br />
fast solvent extraction system SISAK [2] and based on<br />
OsO4 reacting with NaOH. Such an experiment would be<br />
the first attempt to study Hs in the liquid phase. Successful<br />
Rf and Db experiments [3-5] performed at LBNL in<br />
Berkeley indicate that SISAK with its liquid scintillation<br />
detectors is sensitive enough to detect Hs, even though<br />
the Hs cross section is ~3 orders of magnitude lower.<br />
The first investigation of the reaction between HsO4<br />
and NaOH was performed in a gas phase experiment [6].<br />
The interaction of HsO4 appeared somewhat weaker with<br />
NaOH than that of OsO4, in fair agreement with theoretical<br />
predictions [7]. The liquid-liquid extraction Hsexperiment<br />
proposed in the work presented here is based<br />
on results from this gas-phase experiment. In aqueous<br />
solution, it is assumed [1] that the reactions occurring are:<br />
4 (aq) NaOH(aq) ↔ Na[<br />
OsO (OH) ] ( aq)<br />
[ OsO ( OH)<br />
] NaOH Na [ OsO (OH) ]<br />
OsO 4<br />
4<br />
+ (1)<br />
Na + ↔<br />
(2)<br />
OsO (aq) OsO 4(org)<br />
4 → (3)<br />
The distribution ratio between NaOH solution and toluene,<br />
which was selected as organic phase because it is<br />
also suitable as solvent for the liquid scintillation detection<br />
used by SISAK, is given by:<br />
D<br />
[ ]<br />
[ ] [ ] [ ] −<br />
− OsO4<br />
org<br />
OsO + OsO (OH) + OsO (OH)<br />
= 2<br />
4 aq<br />
4<br />
4 2<br />
which can be rewritten as:<br />
D =<br />
1+<br />
K<br />
K D<br />
−<br />
OH + K K OH<br />
[ ] [ ] 2 −<br />
1<br />
1<br />
2<br />
where K1, K2 and KD are equilibrium constants for reactions<br />
(1), (2), and (3), respectively. Experiments were<br />
performed in Oslo, utilizing manual extractions and SI-<br />
SAK on-line measurements to carefully study the behavior<br />
of Os in this chemical system, see Samadani et al. [1]<br />
for details. The results are summarized in Fig. 1.<br />
Based on the results from Oslo a ”proof-of-principle”<br />
experiment with α-decaying Os isotopes was performed at<br />
<strong>GSI</strong>: the full SISAK setup [8], as it would be used for a<br />
Hs experiment with double α-detector arrays to simultaneously<br />
measure both phases (for the aqueous phase done<br />
indirectly, after a second extraction step) was set up and<br />
tested. 40 Ar 11+ ions from the UNILAC irradiated a nat Ce<br />
target in the gas-filled separator TASCA (TransActinide<br />
Separator and Chemistry Apparatus) producing 172-175 Os.<br />
2<br />
4<br />
2<br />
(4)<br />
(5)<br />
In the separator focal plane a Recoil Transfer Chamber<br />
(RTC) was mounted. It was flushed with a He/O2 gas<br />
mixture, which passed an oven (run at 600°C) mounted at<br />
the exit of the RTC to ensure fast and complete oxidation<br />
of Os. The volatile osmium tetroxide was transported to<br />
SISAK by the He/O2 gas and dissolved in NaOH solution.<br />
After extraction into toluene the α-activity was measured<br />
in on-line flow cells by liquid scintillation detection. This<br />
was the first SISAK experiment behind TASCA. Results<br />
from this run using α-decaying 172 Figure 1: Comparison of data from OCL and <strong>GSI</strong>, together<br />
with fit of eq. (5) to OCL data.<br />
Os agree well with<br />
those of γ-measurements obtained in Oslo, as shown in<br />
Fig. 1. This successful experiment proved that the system<br />
is suitable for studying Hs.<br />
References<br />
[1] F. Samadani et al., "Development of a SISAK<br />
extraction system for chemical studies of element<br />
108, hassium", submitted to Radiochim. Acta.<br />
[2] J.P. Omtvedt et al., J. Alloy Comp. 271-273, 303<br />
(1998).<br />
[3] J.P. Omtvedt et al., Journ. Nucl. Radiochem.<br />
Sciences, 3, 121 (2002).<br />
[4] L. Stavsetra et al., Nucl. Instrum. Method Phys. Res.<br />
Sect. A, 543, 509 (2005).<br />
[5] J.P. Omtvedt et al. "Detection of 258 Db with the SI-<br />
SAK Liquid Scintillation Detection System", manuscript<br />
in preparation for Radiochim. Acta.<br />
[6] A. von Zweidorf et al., Radiochim. Acta, 92, 855<br />
(2004).<br />
[7] V. Pershina, Radiochim. Acta, 93, 373-376 (2005).<br />
[8] J.P Omtvedt, et al., Eur. Phys. J. D, 45, 91 (2007).<br />
181
NUSTAR-SHE-13 <strong>GSI</strong> SCIENTIFIC REPORT 2009<br />
182<br />
<strong>GSI</strong>Template2007<br />
Theoretical Investigations of Trends in Volatility of the Heaviest Elements<br />
V. Pershina 1 , A. Borschevsky 2 , J. Anton 3 , and T. Jacob 3<br />
1 <strong>GSI</strong>, Darmstadt, Germany; 2 School of Chemistry, Tel Aviv University, Israel; 3 Institut <strong>für</strong> Elektrochemie, Universität<br />
Ulm, Germany<br />
Elements 112 through 118 are expected to be very volatile.<br />
Early extrapolations of the sublimation enthalpies,<br />
ΔHsub=ΔHf(g), of the solid state in groups 12 through 17<br />
have indeed shown the lowest ΔHsub for the heaviest elements<br />
in each group of the elements, respectively [1,2].<br />
(The gas-phase chemistry experiments give ΔHsub as a<br />
measure of volatility of an element using measured ΔHads<br />
on metal surfaces and an assumed linear correlation between<br />
these values [3]). The reason for the high volatility<br />
is strong relativistic effects on the valence electrons of<br />
these elements.<br />
It was also recognized that linear extrapolations of<br />
properties within the chemical groups should be made<br />
cautiously due to increasing (non-linearly with Z) relativistic<br />
effects. Thus, relativistic calculations are nowadays a<br />
must for reliable predictions of properties of the heaviest<br />
elements. Since ΔHsub should be related to the interaction<br />
energy of an atom with itself, we have performed a systematic<br />
calculations of the M-M dissociation energies<br />
(De) for the entire 6p and 7p rows of the elements and<br />
compared them with the known values of De(M2) and<br />
ΔHsub in groups 13 through 18.<br />
For the calculations of the electronic structures of M2<br />
(M = Hg/112, Tl/113, Pb/114, Bi/115, Po/116, At/117,<br />
Rn/118), we have used our 4c-DFT method [4] proven to<br />
be a reliable tool in predicting binding energies and bond<br />
lengths. Very large optimized basis sets were used including<br />
5g virtual atomic orbitals. Results of the calculations<br />
are summarized in Table 1.<br />
Table 1. Optimized bond lengths Re (in Å) and dissociation<br />
energies De (in eV) in M2 (M = Tl/113 through<br />
Rn/118)<br />
M2 Re De M2 Re De<br />
Tl2<br />
3.185<br />
3.00 *<br />
Pb2 2.97<br />
Bi2<br />
2.93 *<br />
2.685<br />
2.6596 *<br />
0.47<br />
0.42 *<br />
1.18<br />
1.17 * ;0.83 *<br />
2.23<br />
2.05 *<br />
(113)2 3.613<br />
(114)2 3.49<br />
(115)2 3.072<br />
0.06<br />
0.13<br />
0.82<br />
Po2 2.813<br />
-<br />
2.15<br />
1.94 *<br />
(116)2 3.238 1.34<br />
At2 3.041<br />
-<br />
1.02<br />
0.87±1.3 *<br />
(117)2 3.524 0.77<br />
Rn2 - unbound (118)2 4.498 0.012<br />
* Experimental values; Re(Tl2) is questionable.<br />
Good agreement with experiment was obtained for the<br />
lighter homologs of the heaviest elements. The Rn dimer<br />
was obtained unbound, so that calculations with even larger<br />
basis sets could follow.<br />
D e(M2), eV<br />
3<br />
2,5<br />
2<br />
1,5<br />
1<br />
0,5<br />
6 th row<br />
0<br />
11 12 13 14 15 16 17 18 19<br />
Group<br />
7 th row<br />
Figure 1: Calculated binding energies in group 12 through<br />
18 homonuclear dimers.<br />
Fig. 1 shows that De[M2] of the 7p elements are much<br />
smaller than De[M2] of the 6p homologs in groups 13<br />
through 16. This is due to the fact that bonding in the<br />
lighter M2 is due to the participation of both the np1/2 and<br />
np3/2 AOs, while the contribution of the former one is<br />
drastically diminished in the heaviest homologs (it practically<br />
forms a closed-shell). A remarkable fact is that the<br />
difference in De between the 6 th and 7 th row elements diminishes<br />
with the group number from group 15 on and<br />
gets even reversed in group 18: thus, element 118 is<br />
stronger bound to itself than Rn.<br />
A good correlation between De(M2) and ΔHf(g) was<br />
found for groups 13 through 17. On their basis, the following<br />
ΔHsub for the heaviest elements were obtained:<br />
145 kJ/mol for element 113, 70 kJ/mol for element 114,<br />
164 kJ/mol for element 115, 101 kJ/mol for element 116,<br />
and 92 kJ/mol for element 117. These values are close to<br />
those obtained via linear extrapolations of ΔHf(g) in the<br />
groups [1,2]. Extensive cluster calculations should be<br />
performed to confirm the predicted values.<br />
References<br />
[1] O.L. Keller et al. J. Phys. Chem. 74, 1127 (1970);<br />
ibid, 78 (1974) 1945.<br />
[2] B. Eichler, Kernenergie, 10 (1976) 307.<br />
[3] B. Eichler, R. Eichler, In: "The Chemistry of Superheavy<br />
Elements", Kluwer, 2003, Ed. M. Schädel, p.<br />
205.<br />
[4] J. Anton, B. Fricke, E. Engel, Phys. Rev. A, 69 (2004)<br />
012505.<br />
[5] H. Rossbach and B. Eichler, Akademie der Wissenschaft<br />
der DDR, Report No. ZFK-527, 1984.
<strong>GSI</strong> SCIENTIFIC REPORT 2009 NUSTAR-SHE-14<br />
<strong>GSI</strong>Template2007<br />
Theoretical Investigations of Trends in Adsorption of the Heaviest Elements on<br />
Gold<br />
V. Pershina 1 , A. Borschevsky 2 , J. Anton 3 , and T. Jacob 3<br />
1 <strong>GSI</strong>, Darmstadt, Germany; 2 School of Chemistry, Tel Aviv University, Israel; 3 Institut <strong>für</strong> Elektrochemie, Universität<br />
Ulm, Germany<br />
Elements 112 through 118 are expected to be very volatile<br />
due to strong relativistic effects on their valence electrons.<br />
Their volatility is to be studied via the gas-phase<br />
thermochromatography technique by measuring the adsorption<br />
enthalpy, ΔHads, on gold plated detectors located<br />
along the chromatography column (see results for elements<br />
112 and 114 [1,2]). The obtained ΔHads is then related<br />
to the sublimation enthalpy, ΔHsub, of macroamounts<br />
using a linear correlation between these values [1].<br />
Results of our extended cluster calculations [3] have<br />
shown that ΔHads of group 12 and 14 atoms M adsorbed<br />
on gold surface can reliably be predicted on the basis of<br />
knowledge of binding energies (De) of gold dimers, MAu:<br />
the difference in De(M-Aun), where 1 ≤ n ≤ 120, between<br />
the adatoms M is kept almost constant independently of<br />
the gold cluster size and adsorption position. Accordingly,<br />
in this work, we try to estimate ΔHads of the 7p elements<br />
and their 6p homologs, as well as trends in the chemical<br />
rows, on the basis of the calculated De(MAu), where M =<br />
Tl/113, Pb/114, Bi/115, Po/116, At/117, Rn/118.<br />
The calculations were performed with the use of our<br />
fully relativistic 4c-DFT method [4] proven to be a reliable<br />
tool in predicting binding energies and bond lengths.<br />
Very large optimized basis sets including 5g virtual AOs<br />
were used. Results of the calculations of the bond lengths<br />
(Re) and De are summarized in Table 1.<br />
Table 1. Optimized bond lengths Re (in Å) and dissociation<br />
energies De (in eV) in MAu (M = Hg/112 through<br />
Rn/118)<br />
MAu Re De MAu Re De<br />
HgAu 2.67 0.06 112Au 2.73 0.51<br />
TlAu 2.668 2.72 113Au 2.716 1.83<br />
PbAu 2.64 2.15 114Au 2.88 0.73<br />
BiAu 2.638 2.43 115Au 2.892 2.44<br />
PoAu 2.631 2.29 116Au 2.867 2.17<br />
AtAu 2.644 1.97 117Au 2.835 1.87<br />
RnAu 3.023 0.23 118Au 3.003 0.66<br />
The calculated De are depicted in Fig. 1 together with<br />
the measured -ΔHads of Hg, Tl and Pb on gold; - ΔHads of<br />
element 112 (measured [1]) and 4c-DFT predicted for<br />
elements 113 and 114 [3]; as well as the calculated -ΔHads<br />
for Hg through Po and for elements 112 through 116 using<br />
semi-empirical models [5]. The obtained De(MAu)<br />
indicate that there should be no decrease in the binding<br />
energies with gold from Bi to element 115, and a very<br />
little decrease from Po and At to elements 116 and 117,<br />
respectively. Moreover, the trend in De gets reversed for<br />
RnAu and 118Au, in line with the expected higher reactivity<br />
of element 118 in comparison with Rn. Thus, taking<br />
into account our experience for groups 12 - 14 [3], one<br />
can expect that -ΔHads of Bi through Rn and elements 115<br />
through 118 should follow the trends found for the<br />
De(MAu) of these elements (Fig. 1).<br />
D e(MAu), -ΔH ads, eV<br />
3<br />
2,5<br />
2<br />
1,5<br />
1<br />
0,5<br />
0<br />
11 12 13 14 15 16 17 18 19<br />
Group<br />
Figure 1: Binding energies: filled squares – calculated<br />
here De(MAu) (M = Hg through Rn), and filled rhomboids<br />
– De(MAu) (M = elements 112 through 118); open<br />
squares – measured -ΔHads of Hg, Tl and Pb on gold; open<br />
triangles - -ΔHads of element 112 (measured [1]) and elements<br />
113 and 114 (4c-DFT predicted [3]); crosses – calculated<br />
-ΔHads for Hg through Po, and stars – for elements<br />
112 through 116 [5].<br />
The expected high -ΔHads of elements 115 through 117<br />
are in contrast with the results of the semi-empirical calculations<br />
[5]: the latter show a decrease in -ΔHads from the<br />
6p to 7p elements in groups 15 – 17, similar to that in<br />
groups 13 and 14. The present results also mean that the<br />
linear correlation between -ΔHads and ΔHsub used in [1] is<br />
questionable: the estimated (via a linear extrapolation in<br />
the groups) ΔHsub of elements 115 - 117 [6] are much<br />
smaller than ΔHsub of Bi through At. Extensive cluster<br />
calculations are needed to confirm these conclusions.<br />
References<br />
[1] R. Eichler, et al. Nature, Letters, 447 (2007) 72.<br />
[2] A. Yakushev, Presentation at the 7 th Workshop on the<br />
Chemistry of the Heaviest Elements, Mainz, 2009.<br />
[3] V. Pershina, J. Anton, T. Jacob, J. Chem. Phys. 131<br />
(2009) 084713.<br />
[4] J. Anton, et al., Phys. Rev. A, 69 (2004) 012505.<br />
[5] H. Rossbach and B. Eichler, Akademie der Wissenschaft<br />
der DDR, Report No. ZFK-527, 1984.<br />
[6] B. Eichler, Kernenergie, 10 (1976) 307.<br />
183
NUSTAR-SHE-15 <strong>GSI</strong> SCIENTIFIC REPORT 2009<br />
184<br />
<strong>GSI</strong>Template2007<br />
Theoretical Investigations of Chemical Reactivity of Element 113<br />
J. Anton 1 , V. Pershina 2 and T. Jacob 1<br />
1 Institut <strong>für</strong> Elektrochemie, Universität Ulm, Germany; 2 <strong>GSI</strong>, Darmstadt, Germany<br />
The heaviest element identified chemically is Z=112.<br />
Using the gas-phase thermochromatography technique, its<br />
volatility, i.e., the adsorption enthalpy, ΔHads, on gold<br />
plated detectors located along the chromatography column<br />
was investigated and compared to that of Hg [1].<br />
Very recently, results of the first chemical studies on element<br />
114 using the same technique were reported [2,3].<br />
Both elements, 112 and 114, were shown to be very volatile<br />
which is explained by their closed, 7s 2 6d 10 , and quasiclosed,<br />
7s 2 7p1/2 2 , shells, respectively. Element 113 (having<br />
the 7s 2 7p1/2 ground state) is to be studied next. It is<br />
expected to be also volatile and relatively inert, though<br />
less than 112 and 114, due to the relativistic stabilization<br />
of the 7s and 7p1/2 electrons. Feasibility experiments have<br />
already been conducted for its lighter homolog, Tl [4]<br />
Earlier, we have predicted ΔHads of elements 112 and<br />
114 on inert and gold surfaces by performing 4c-DFT<br />
calculations for the atoms adsorbed on very large gold<br />
clusters [5]. We have also predicted ΔHads of element 113<br />
on inert surfaces using result of accurate ab initio Dirac-<br />
Coulomb atomic calculations [6]. It was shown that element<br />
113 should be well transported through the Teflon<br />
capillaries from the target chamber to the chemistry setup.<br />
In this work, we study reactivity of element 113 and Tl<br />
on the basis of the calculations for their M2 and MAu<br />
dimers: it was shown that binding energies in MAu are<br />
directly related to ΔHads of M on gold [5]. In addition, we<br />
study the stability of hydroxides that can be formed in the<br />
oxygen atmosphere over the gold surface.<br />
For the calculations, we have used our 4c-DFT method<br />
[7]. Very large optimized basis sets were used. Results of<br />
the calculations for M2, MAu and MOH (M = Tl and element<br />
113) are given in Table 1 [9].<br />
Table 1. Optimized bond lengths Re (in Å), dissociation<br />
energies De (in eV) and vibrational frequencies we (in<br />
cm -1 ) for M2, MAu and MOH (M = Tl and element 113)<br />
Molecule Re De we<br />
Tl2 3.185 0.479 67<br />
(113)2 3.613 0.058 25<br />
TlAu 2.668 2.669 141<br />
113Au 2.716 1.825 144<br />
TlOH 2.176 3.680 a<br />
547<br />
113OH 2.282 2.424 a<br />
519<br />
a<br />
with respect to the MOH = M + OH decomposition<br />
The potential energy curves for TlAu and 113Au are<br />
shown in Fig. 1. One can see a decrease in De of 0.84 eV<br />
from TlAu to 113Au with a respective bond lengthening<br />
of 0.048 Å, similar to that of Tl2 with respect to (113)2 (of<br />
0.42 eV), and that of the simple hydrides and fluorides of<br />
these elements, found in other calculations.<br />
Figure 1: Calculated binding energies in TlAu and 113Au.<br />
Using the difference in De between MAu and 113Au,<br />
one can estimate -ΔHads(113) on a gold surface with respect<br />
to the measured -ΔHads(Tl) = 240 ± 5 kJ/mol [4].<br />
Thus, one can expect that element 113 will adsorb on gold<br />
at about 0.84 eV (82 kJ/mol) lower energies than Tl. This<br />
gives a preliminary value of ΔHads(113) = -158.6 kJ/mol,<br />
which is very close to -164.4 kJ/mol predicted with the<br />
use of adsorption models and extrapolation of properties<br />
in group 13 [8]. According to the results, the sequence in<br />
the volatility of the heaviest elements should be 112 ><br />
114 > 113.<br />
The data of Table 1 also indicate that the M-OH bonds<br />
should be stronger and shorter than the M-Au ones. This<br />
explains why Tl reacts preferentially with OH and not<br />
with gold in the oxygen atmosphere. The same is expected<br />
for element 113 forming a stronger 113-OH bond<br />
than the 113-Au one. The -ΔHads(113OH) on gold is expected<br />
to be lower than -ΔHads(113).<br />
References<br />
[1] R. Eichler et al. Nature, Letters, 447 (2007) 72.<br />
[2] R. Eichler, Abstract of the NRC7 International Conference,<br />
Budapest, 24-29 August 2008.<br />
[3] A. Yakushev, Presentation at the 7 th Workshop on the<br />
Chemistry of the Heaviest Elements, Mainz, 2009.<br />
[4] S. König, et al., PSI Annual Report 2005, 2006, p. 5.<br />
[5] V. Pershina, J. Anton, T. Jacob, J. Chem. Phys. 131<br />
(2009) 084713.<br />
[6] V. Pershina, A. Borschevsky, E. Eliav, U. Kaldor, J.<br />
Phys. Chem. A 112 (2008) 13712.<br />
[7] J. Anton, et al., Phys. Rev. A, 69 (2004) 012505.<br />
[8] H. Rossbach and B. Eichler, Akademie der Wissenschaft<br />
der DDR, Report No. ZFK-527, 1984.<br />
[9] V. Pershina, J. Anton, T. Jacob, Chem. Phys. Lett. 480<br />
(2009) 157.
<strong>GSI</strong> SCIENTIFIC REPORT 2009 NUSTAR-SHE-16<br />
Electron Affinity of Element 114, with Comparison to Sn and Pb<br />
A. Borschevsky 1 , V. Pershina 2 , E. Eliav 1 , and U. Kaldor 1<br />
1 School of Chemistry, Tel Aviv University, Israel; 2 <strong>GSI</strong>, Darmstadt, Germany<br />
Knowledge of the electronic structure and properties<br />
of element 114 is important for its chemical identification.<br />
By comparing its behaviour with that of the lighter group<br />
14 homologues, its position in the periodic table can be<br />
confirmed.<br />
In this work, we investigate the electron affinity (EA)<br />
of element 114, together with its lighter homologues in<br />
group 14, Sn and Pb [1]. Electron affinity is important for<br />
calculations of chemical potential, µ, and electronegativity,<br />
χ, which, in turn, reflect chemical reactivity of the<br />
element under study.<br />
The calculations were performed in the framework of<br />
the projected Dirac-Coulomb-Breit Hamiltonian,<br />
∑ ∑ (1)<br />
H = h + (1/ r + B ),<br />
DCB D ij ij<br />
i i< j<br />
where<br />
2<br />
h = cα<br />
⋅ p + βc<br />
+ V<br />
r r<br />
D<br />
nuc<br />
. (2)<br />
Here, Vnuc is the nuclear attraction operator, and α and β<br />
are the four-dimensional Dirac matrices. The nuclear potential,<br />
Vnuc, takes into account the finite size of the nucleus,<br />
modelled as a uniformly charged sphere. The two<br />
electron terms include the nonrelativistic electron repulsion<br />
and the Breit term, Bij, and are correct to the second<br />
order in the fine structure constant.<br />
Electron correlation is taken into account using the<br />
Fock space (FS) [2] and mixed sector intermediate Hamiltonian<br />
(MSIH) [3] coupled cluster (CC) methods, which<br />
are considered to be one of the most powerful tools in<br />
quantum chemistry.<br />
Two types of the basis sets were used in the calculations,<br />
that of Faegri [4] and the even tempered universal<br />
basis set of Malli et al. [5]. For each of the elements under<br />
study, both types of the basis sets were extended to<br />
convergence. The size of the model spaces used was<br />
gradually increased in order to obtain convergence of the<br />
results.<br />
The calculated electron affinities of Sn and Pb are<br />
shown and compared with experiment [6] in Table 1.<br />
Table 1. Electron affinities of Sn, Pb, and element 114<br />
(in meV).<br />
Method Sn Pb Element 114<br />
I II I II I II<br />
FSCC 736 735 247 245 No EA No EA<br />
MSIH 1085 1072 383 363 No EA No EA<br />
Exp. [6] 1112 364<br />
I- Faegri basis set; II – Malli basis set.<br />
The FSCC EA values are about 35% too low, while the<br />
MSIH results are within 5% of the experiment. This is<br />
due to the possibility of employing large and flexible<br />
model spaces within the MSIH framework. Good agreement<br />
with experiment, as well as the very small differences<br />
between the results for the two types of the basis<br />
sets, confirm the convergence of the MSIH calculations.<br />
The same methods were used to estimate the electron<br />
affinity of element 114. All the calculations have given<br />
negative electron affinities. Thus, the very good agreement<br />
of the MSIH EAs of Pb and Sn, and the converged<br />
exhaustive calculations for element 114, lead to the conclusion<br />
that element 114 will not bind an extra electron.<br />
This prediction is in accord with the trend in the EAs<br />
of group 14 elements. The EAs of the group 14 elements<br />
go down monotonically, as is shown in Fig. 1. The decrease<br />
is enhanced for Pb by the relativistic destabilization<br />
of the 6p1/2 orbital. As is shown by the dashed line in<br />
Figure 1, an extrapolation of the line from Sn to Pb<br />
crosses the x axis well before Z=114. In fact, an even<br />
steeper decrease may be expected for element 114, which<br />
should exhibit stronger relativistic effects than Pb. This<br />
supports our prediction that no electron binding will occur<br />
in element 114.<br />
Fig. 1. Electron affinities of group 14 elements. The<br />
dashed line is an extrapolation from Sn and Pb.<br />
References<br />
[1] A. Borschevsky, V. Pershina, E. Eliav, and U. Kaldor.<br />
Chem. Phys. Lett. 480 (2009) 49.<br />
[2] E. Eliav, U. Kaldor, and Y. Ishikawa, Phys. Rev. A<br />
49 (1994) 1724.<br />
[3] A. Landau, E. Eliav, Y. Ishikawa, and U. Kaldor, J.<br />
Chem. Phys. 121 (2004) 6634.<br />
[4] K. Faegri, Theor. Chim. Acta 105 (2001) 252.<br />
[5] G.L. Malli, A.B.F. Da Silva, Y. Ishikawa, Phys. Rev.<br />
A 47 (1993) 143.<br />
[6] H. Hotop, W.C. Lineberger, J. Phys. Chem. Ref. Data<br />
4 (1975) 539, ibid, 14 (1985) 731.<br />
185
NUSTAR-SHE-17 <strong>GSI</strong> SCIENTIFIC REPORT 2009<br />
186<br />
<strong>GSI</strong>Template2007<br />
244 Pu-targets for production of element 114 at TASCA*<br />
K. Eberhardt 1,# , J. V. Kratz 1 , J. Runke 1 , Ch. E. Düllmann 2 , B. Lommel 2 and M. Schädel 2<br />
1 Institut <strong>für</strong> Kernchemie, Johannes Gutenberg-Universität Mainz, Germany; 2 <strong>GSI</strong>, Darmstadt, Germany<br />
Introduction<br />
In a series of recent experiments at TASCA, production<br />
and decay as well as chemical properties of element 114<br />
have been investigated using the 244 Pu( 48 Ca,3/4n)-reaction<br />
leading to 288,289 114 [1,2]. Because the 244 Pu target material<br />
is available only in very limited amounts, the target<br />
preparation technique should give high yields. Easy and<br />
complete recovery of the target material is another prerequisite<br />
[3]. Thus, we have chosen Molecular Plating<br />
(MP) onto 2 µm thin pinhole-free titanium foils as the<br />
target preparation technique. At TASCA, a rotating target<br />
wheel is used composed of three banana-shaped target<br />
segments with an active target area of 1.44 cm 2 each. The<br />
rotating target is confined in a nearly closed container in<br />
order to protect the beam line as well as the separator<br />
against contamination in the case that a target gets destroyed.<br />
244<br />
Pu target production and characterization<br />
For the production of one target segment by MP about<br />
1 mg of 244 Pu in the form of its nitrate is dissolved in a<br />
small volume (100-200 µl) of nitric acid in a Teflon<br />
beaker and mixed with a surplus of isopropanol (800 µl).<br />
The mixture is then transferred into the electrochemical<br />
deposition cell (EDC) made of Teflon which is subsequently<br />
filled up with isobutanol to a total volume of 16<br />
ml [4]. MP is carried out by applying a voltage of 150-<br />
200 V at a maximum current density of about 1.2<br />
mA/cm 2 . After 5-6 hours plating time, deposition yields<br />
up to 90 % are achieved. The backing foils are produced<br />
by cold rolling at <strong>GSI</strong> [5]. They should be pinhole-free<br />
and are pre-cleaned with isopropanol, 6 M hydrochloric<br />
acid and water. Prior to use, the foil integrity is checked<br />
by optical microscopy to ensure that the backing is pinhole-free.<br />
The average foil thickness is determined by<br />
weighing, whereas the homogeneity of the foil thickness<br />
is checked by α-particle energy-loss measurements. For a<br />
target backing foil with a nominal thickness of 2.2 µm<br />
deviations are in the order of ± 0.2 µm.<br />
The target thickness is determined by two independent<br />
methods: (i) . After the deposition<br />
is completed, the target is dismounted from the EDC,<br />
dried under an infrared lamp and measured with a surface<br />
barrier α-detector at a distance of about 30 cm. (ii) The<br />
Pu-content of the solution in the EDC is determined by<br />
. Subsequent to MP an aliquot<br />
of the supernatant solution in the EDC (1 ml) is irradiated<br />
for 2 h in the TRIGA Mainz research reactor with a thermal<br />
neutron flux of 7 x 10 11 cm -2 s -1 . Here, 10.5 h- 245 Pu is<br />
formed via the reaction<br />
244 Pu(n,γ) 245 Pu.<br />
______________________________________________<br />
*Supported by the <strong>GSI</strong> F&E (MZJVKR).<br />
# klaus.eberhardt@uni-mainz.de<br />
The Pu content of the irradiated solution is determined by<br />
means of γ-spectrometry using the prominent γ-lines re-<br />
245<br />
sulting from the Pu decay at 327 keV,<br />
308 keV, and 560 keV, respectively [3]. Table 1 comprises<br />
all 244 Pu-targets produced for TASCA so far.<br />
Table 1: 244 Pu-targets for TASCA<br />
Target# Thickness [µg/cm 2 ]<br />
08-395 401<br />
08-482 502<br />
08-485 490<br />
08-486 390<br />
08-487 472<br />
09-562 673<br />
09-594 724<br />
09-623 790<br />
09-624 785<br />
The homogeneity of the Pu-layer is checked with radiography<br />
[6] using a commercial radiographic imager<br />
(FLA 7000 from FUJIFILM Corp.). Figure 1 shows a<br />
picture of a target segment. Here, the brown layer indicates<br />
the Pu-oxide deposit. Also shown is a 3-dimensional<br />
plot of the activity distribution. With this technique it<br />
could be shown that the active target area is completely<br />
covered and, in addition, that Pu is homogeneously distributed<br />
over the entire target area. From this one can<br />
conclude that variations in target thickness are in the order<br />
of about 15%.<br />
Figure 1: 244 Pu target segment (the brown layer indicates<br />
the Pu-oxide deposit) and corresponding plot of the activity<br />
distribution as obtained by radiographic imaging.<br />
References<br />
[1] Ch. E. Düllmann , contribution to this report.<br />
[2] A. Yakushev , contribution to this report.<br />
[3] J. Runke , contribution to this report.<br />
[4] K. Eberhardt et al., NIM A 590 (2008) 134<br />
[5] B. Lommel et al., NIM A 590 (2008) 141<br />
[6] D. Liebe et al., NIM A 590 (2008) 145
<strong>GSI</strong> SCIENTIFIC REPORT 2009 NUSTAR-SHE-18<br />
<strong>GSI</strong>Template2007<br />
Recovery of 244 Pu from irradiated targets for production of element 114*<br />
J. Runke 1,# , K. Eberhardt 1 , J. V. Kratz 1 , Ch. E. Düllmann 2 and M. Schädel 2<br />
1 Institut <strong>für</strong> Kernchemie, Johannes Gutenberg-Universität Mainz, Germany; 2 <strong>GSI</strong>, Darmstadt, Germany<br />
The 244 Pu targets [1] (PuO2 electrodeposited on Ti<br />
backing) were irradiated during recent bombardments<br />
with 48 Ca 10+ ions to produce 288, 289 114 [2,3]. During these<br />
bombardments with up to 3.6 x 10 18 ions, targets and<br />
backings underwent changes that made reprocessing and<br />
production of new targets for forthcoming experiments<br />
desirable.<br />
Figure 1: Teflon vessel.<br />
Recovery of 244 Pu from one arc-shaped segment was<br />
accomplished as follows: The Al-target frame was inserted<br />
into a Teflon vessel containing a cavity into which<br />
the frame could be inserted, see Figure 1. With a sharp<br />
knife, the target was cut out of the frame, the frame was<br />
removed, and the target together with the Ti backing was<br />
dissolved in hot conc. HCl. The dissolution of the Ti<br />
backing was incomplete. The central part of the backing<br />
that had received the highest beam intensity did not dissolve.<br />
The resulting solution with the remainder of the<br />
undissolved Ti was evaporated to near dryness, transferred<br />
into a 10 ml measuring flask and filled with 8 M<br />
HCl. An aliquot of that solution was removed, evaporated<br />
to dryness, and the �-particle activity was determined.<br />
The total activity was used for yield determination. The<br />
results indicate that more than 80 % of the Pu had been<br />
recovered.<br />
_______________<br />
*Sponsored in the frame of a <strong>GSI</strong> R&D project<br />
(MZJVKR).<br />
# runke@uni-mainz.de<br />
Counts<br />
2500<br />
2000<br />
1500<br />
1000<br />
Alphaspectrum of the Pu eluate<br />
239 Pu<br />
238 Pu<br />
500<br />
0<br />
241<br />
244 Pu<br />
Pu<br />
3,00 3,50 4,00 4,50 5,00 5,50 6,00 6,50 7,00<br />
Energy [MeV]<br />
Figure 2: Alphaspectrum of the Pu eluate.<br />
The Pu/Ti solution in 8 M HCl was transferred to a AG<br />
1x8 anion-exchange column (3 x 50 mm), and was<br />
washed subsequently with 10 x 1 ml of 8 M HCl to remove<br />
the Ti and the 241 Am from the column. Then, the Pu<br />
was eluted from the column in 8 x 1 ml of 0.5 M HCl.<br />
Figure 2 shows the spectrum of � particles of an aliquot<br />
of the eluate. Due to the isotopic composition of the plutonium<br />
(97.9 % 244 Pu, 1.3 % 242 Pu, 0.7 % 240 Pu, < 0.1%<br />
other), the main � activities are associated with 238 Pu and<br />
239 Pu. 100 µl of that solution was removed, filled up to 2<br />
ml and was irradiated with thermal neutrons in the<br />
TRIGA reactor at the Institute of Nuclear Chemistry at<br />
the University of Mainz at 100 kW together with a second<br />
reference sample containing 9.62 µg 244 Pu for 6 h. After a<br />
decay time of 18 h, both samples were assayed for the<br />
327.6 keV γ-activity of 245 Pu at a Ge detector, see Figure<br />
3. The activation analysis showed a 244 Pu recovery of 89<br />
%.<br />
Counts<br />
6000<br />
5000<br />
4000<br />
3000<br />
2000<br />
1000<br />
0<br />
Gammaspectrum of 245 Pu in the eluate<br />
308 keV<br />
327 keV<br />
560 keV<br />
0 200 400 600 800<br />
Energy [keV]<br />
Figure 3: Gammaspectrum of 245 Pu solution.<br />
References<br />
[1] K. Eberhardt et al., contribution to this report.<br />
[2] Ch. E. Düllmann et al., contribution to this report.<br />
[3] A. Yakushev et al., contribution to this report.<br />
187
NUSTAR-SHE-18 <strong>GSI</strong> SCIENTIFIC REPORT 2009<br />
188
<strong>GSI</strong> SCIENTIFIC REPORT 2009 NUSTAR-EXPERIMENTS-01<br />
Investigation of New Isotopes produced with a High-Intensity Uranium Beam<br />
J. Kurcewicz 1 , S. Pietri 1 , F. Farinon 1,2 , H. Geissel 1,2 , C. Nociforo 1 , A. Prochazka 1,2 , H. Weick 1 ,<br />
P. Allegro 3 , J. Benlliure 4 , G. Benzoni 5 , M. Bunce 6 , M. Bowry 6 , P. Boutachkov 1 , J.Gerl 1 , M. Górska 1 ,<br />
A. Gottardo 7 , N. Gregor 1 , R. Janik 8 , R. Knöbel 1 , I. Kojouharov 1 , T. Kubo 9 , Yu. A. Litvinov 1,10 ,<br />
E. Merchan 1 , I. Mukha 1 , F. Naqvi 1,11 , B. Pfeiffer 1 , M. Pfützner 12 , W. Plaß 2 , M. Pomorski 12 ,<br />
Zs. Podolyak 6 , P. Regan 6 , B. Riese 1 , M.V. Ricciardi 1 , H. Schaffner 1 , C. Scheidenberger 1,2 , B. Sitar 8 ,<br />
P. Spiller 1 , J. Stadlmann 1 , P. Strmen 8 , B. Sun 2,13 , I. Szarka 8 , H. Takeda 9 , I. Tanihata 14 , S. Terashima 9 ,<br />
J.J. Valiente-Dobón 7 , J.S. Winfield 1 , M. Winkler 1 , H.-J. Wollersheim 1 , Ph. Woods 15<br />
1<strong>GSI</strong>, Darmstadt, Germany; 2 JLU Giessen, Germany; 3 USP, Sao Paulo, Brazil; 4 USC, Santiago de Compostela, Spain;<br />
5 INFN-Universita di Milano, Italy; 6 University of Surrey, Guildford, UK; 7 LNL-INFN Legnaro, Italy; 8 Comenius University,<br />
Bratislava, Slovakia; 9 RIKEN Nishina Center, Wako, Japan; 10 MPI-K, Heidelberg, Germany; 11 IKP, Köln, Germany;<br />
12 IEP, Warsaw, Poland; 13 Beijing University, China; 14 Osaka University, Japan; 15 University of Edinburgh, UK<br />
The experiment was performed at the SIS synchrotron<br />
of <strong>GSI</strong> Darmstadt, which delivered a 1 A GeV 238 U beam<br />
in spills lasting 0.5-2 s with a repetition period of 2–4 s.<br />
The beam impinged on a 1.6 g/cm 2 thick beryllium target<br />
placed at the entrance to the Projectile Fragment Separator<br />
(FRS) [1]. The primary beam intensity was about<br />
2*10 9 ions/spill. The reaction products were separated by<br />
the FRS operated in the standard achromatic mode. The<br />
FRS, combining two stages of magnetic selection and an<br />
energy loss in two degraders located at the first (S1) and<br />
second (S2) focal plane, allows a full identification of<br />
reaction products with respect to their nuclear charge Z<br />
and mass A. After the first magnetic selection and the S1<br />
degrader, reaction products are slowed down in a thick<br />
aluminium degrader located at the intermediate focal<br />
plane. A second magnetic selection is applied to the ions<br />
leaving the S2 degrader. To decrease the abundance of<br />
not-fully stripped ions, a niobium and iron foil strippers<br />
were placed behind the target and the degrader, respectively.<br />
The time-of-flight measurement was performed between<br />
two pairs of plastic scintillator detectors, one located in<br />
the intermediate focal plane and the other one at the final<br />
focus. The typical flight time was around 160 ns.<br />
Four TPC detectors, two placed at the intermediate and<br />
two other located at the final focal plane provided tracking<br />
information (position and angle of ions).<br />
At the exit of the spectrometer, two ionization chambers<br />
(MUSIC) were mounted with a 104 mg/cm 2 copper strippers<br />
placed in front of each. The MUSIC detectors delivered<br />
the energy loss signal of fragments, thus providing<br />
the information about their atomic number.<br />
The implantation point located at the final focal plane<br />
was surrounded by the RISING germanium detector setup<br />
[2] composed of fifteen Euroball cluster of seven crystals,<br />
used in 4π configuration. The isomer tagging technique<br />
was applied in order to facilitate the identification of the<br />
reaction products as seen, for example, in Figure 1.<br />
In this experiment several Bρ settings of the FRS were<br />
used, which were chosen to yield optimum beam intensities<br />
for neutron rich Dy, Os, Hf, Pt and At isotopes. A<br />
preliminary identification spectrum of ions registered in<br />
the 226 At setting at the final focal plane of the FRS is<br />
<strong>GSI</strong>Template2007<br />
shown in Figure 2. From the online spectra we could positively<br />
identify new isotopes in the Tl-Ra region, while<br />
having hints of new isotopes in the other regions. A more<br />
detailed analysis is ongoing.<br />
Figure 1 Identification spectrum obtained at the final focal<br />
plane (S4) of the FRS for the 205 Pb setting. The figure<br />
inlets show the gamma spectrum registered within 100 μs<br />
after the implantation of the 213 At and the decay scheme<br />
of 213 At.<br />
Figure 2 Preliminary identification spectrum of ions registered<br />
at the last focal plane (S4) of the separator. The FRS<br />
Bρ setting was optimised for 226 At. The red line indicates<br />
the limit of the previously observed nuclei.<br />
References<br />
[1] H. Geissel et al. NIM B 70, (1992) 286<br />
[2] S. Pietri et al. NIM B 261, (2007) 1079<br />
189
NUSTAR-EXPERIMENTS-02 <strong>GSI</strong> SCIENTIFIC REPORT 2009<br />
Spectroscopy of neutron-rich lead nuclei<br />
G. Benzoni1 , J.J. Valiente-Dobón2 , R. Nicolini1 , A. Gottardo2 , A. Bracco1 , F.C.L. Crespi1 ,<br />
F. Camera1 , A. Corsi1 , S. Leoni1 , B. Million1 , O. Wieland1 , D.R. Napoli2 , E. Sahin2 , S. Lunardi3 ,<br />
R. Menegazzo3 , D. Mengoni3,4 , F. Recchia3 , P. Boutachkov5 , L. Cortes5 , C. Domingo-Prado5 ,<br />
F. Farinon5 , H. Geissel5 , J. Gerl5 , N. Goel5 , M. Gorska5 , J. Grebosz5 , E. Gregor5 , T. Haberman5 ,<br />
I. Kojouharov5 , N. Kurz5 , C. Nociforo5 , S. Pietri5 , A. Prochazka5 , W. Prokopowicz5 , H. Schaffner5 ,<br />
A. Sharma5 , H. Weick5 , H-J. Wollersheim. 5 , A.M. Bruce6 , A.M. Denis Bacelar6 , A. Algora7 ,<br />
A. Gadea7 ,M.Pfützner8 , Zs. Podolyak9 , N. Al-Dahan9 , N. Alkhomashi9 ,M.Bowry9 , M. Bunce9 ,<br />
A. Deo9 , G.F. Farrelly9 , M.W. Reed9 , P.H. Regan9 , T.P.D. Swan9 , P.M. Walker9 , K. Eppinger10 ,<br />
S. Klupp10 , K. Steger10 , J. Alcantara Nuñez11 , Y. Ayyad11 , J. Benlliure11 , E. Casarejos11 , R. Janik12 ,<br />
B. Sitar12 , P. Strmen12 , I. Szarka12 , M. Doncel13 , S. Mandal14 , D. Siwal14 , F. Naqvi15,5 , T. Pissulla15 ,<br />
D. Rudolph16 , R. Hoischen16,5 , P.R.P. Allegro17 , R.V. Ribas17 , and Zs. Dombradi18 1 2 3 Università degli Studi e INFN sezione di Milano, Milano, I; INFN-LNL, Legnaro (Pd), I; Università di Padova e<br />
INFN sezione di Padova, Padova, I; 4University of the West of Scotland, Paisley, UK; 5<strong>GSI</strong>, Darmstadt, D; 6Univ. Of<br />
Brighton, Brighton, UK; 7IFIC, Valencia, E; 8University of Warsaw, Warsaw, Pl; 9Universiy of Surrey, Guildford, UK;<br />
10 11 12 TU Munich, Munich, D; University of Santiago de Compostela, Santiago de Compostela, E; Comenius<br />
University, Bratislava, Sk; 13Univ. Of Salamanca, Salamanca, E; 14Univ. of Delhi, Delhi, IND; 15IKP Koeln, Koeln, D;<br />
16 17 18 Lund University, Lund, S; Univ. Of Sao Paulo, Sao Paulo, Br; ATOMKI, Debrecen, H.<br />
Introduction<br />
The experiment described in this report aims at studying<br />
the shell evolution along Z=82.<br />
The region of heavy Pb isotopes presents high-spin isomers,<br />
which involve the high-j orbitals, νi 11/2, νg 9/2,<br />
νj 15/2. The spectroscopic information derived from these<br />
isomeric states reflects the underlying microscopic nuclear<br />
structure. Previous to this experiment, the most n-rich lead<br />
isotope studied was 212 Pb, in which hints of an isomeric<br />
8 + state were found [1].<br />
This experiment, performed in September 2009, also<br />
aimed at measuring β-decay half lives, which are particularly<br />
needed for r-process calculations, as an essential test<br />
to validate the nuclear and β decay models away from stability<br />
[2].<br />
Experimental Details<br />
The nuclei of interest were produced following projectile<br />
fragmentation of 238 U primary beam at 1 GeV/u, impinging<br />
on a Be target, 2.5 g/cm 2 thick. The 238 U beam was<br />
provided by the SIS synchrotron with an intensity of 1.5-<br />
2.0×10 9 ions/spill. Fragmentation reaction products were<br />
separated using the FRagment Separator (FRS) [3], operated<br />
in monochromatic mode with an aluminium wedge degrader<br />
in the intermediate focal plane (S2). In order to decrease<br />
the contaminations due to the population of nuclear<br />
species close to the primary beam an additional aluminium<br />
degrader, 2 g/cm 2 thick, was placed after the first bending<br />
dipole of the FRS (S1).<br />
The RISING stopped beam set-up [4] has been used,<br />
with the addition of an active stopper consisting of<br />
DSSSD [5], allowing to study ion-β-γ correlations.<br />
190<br />
Z<br />
Pb<br />
2.6<br />
A/Q<br />
Figure 1: Z vs. A/Q plot for the 215 Pb setting. Pb isotopes<br />
are highlighted.<br />
Two different settings were used in the present experiment:<br />
the first one centred around 215 Pb and the second<br />
around 217 Pb, in order to populate more exotic nuclei.<br />
Figure 1 shows an example of a Z vs. A/Q identification<br />
plot for the 215 Pb setting, where Pb, Tl and Bi isotopes<br />
are, in particular, recognizable. New isomers have already<br />
been identified.in many Pb and Bi isotopes. Data analysis<br />
is ongoing.<br />
References<br />
[1] M. Pfutzner et al., Phys. Lett. B 444 (1998) 32-37.<br />
[2] I.N. Borzov. Phys. Rev. C67 (2004) 025802.<br />
[3] H. Geissel et al., Nucl. Instr. Meth. B70 (1992) 286.<br />
[4] S. Pietri et al., Nucl. Instr. Meth. B 261 (2007)1079 .<br />
[5] R. Kumar et al., Nucl. Instr. Meth.A 598 (2009) 754.
<strong>GSI</strong> SCIENTIFIC REPORT 2009 NUSTAR-EXPERIMENTS-03<br />
Total fission cross section of Ta + H at 1, 0.8, 0.5 and 0.3 GeV studied in<br />
inverse kinematics.<br />
Y. Ayyad 1 , J. Benlliure 1 , E. Casarejos 1 , H. Álvarez 1 , A. Bacquias 2 , A. Boudard 2 , T. Enqvist 3 ,<br />
V. Foehr 3 , A. Kelic 3 , K. Kezzar 1 , S. Leray 2 , C. Paradela 1 , D. Pérez-Loureiro 1 , R. Pleskac 3 , and<br />
D. Tarrío 1<br />
1 GENP, Univ. de Santiago de Compostela, Spain; 2 CEA-Saclay,Gif sur Yvette, France; 3 <strong>GSI</strong>, Darmstadt, Germany<br />
Total fission cross-sections provide valuable information<br />
on the dynamics of the fission process [1] but they are also<br />
fundamental data of interest in a wide range of applications.<br />
Despite that interest the available experimental information<br />
is scarce considering the many combinations of nuclei and<br />
energies involved. Moreover, state-of-the-art models show<br />
discrepancies with the data at different energies. One of<br />
the most demanding application of this type of data are related<br />
to accelerator-driven-systems and nuclear waste incineration.<br />
The spallation data related to proton-induced<br />
reactions in different materials, provide clue information<br />
about the spallation target efficiency, and structural- and<br />
general-related parameters. In this context, it was soon recognized<br />
the importance of measuring key cases that would<br />
provide both: direct information on the nuclei of interest,<br />
and also to serve as benchmark data to test the simulation<br />
codes based on related models.<br />
The experimental setup was mounted behind the FRS.<br />
The liquid hydrogen target (85 mg/cm ) was surrounded<br />
by two Multi Sample Ionization Chamber (MUSIC) in order<br />
to identify the reactions produced in the hydrogen. Two<br />
scintillator paddles mounted one on top of the other provided<br />
, not only the fission trigger but also an energy loss<br />
measurement.In a second step a ’twin’ ionization chamber<br />
and a ToF-wall detector would allow to identify in charge<br />
the residues. Only by using the information of the first part<br />
of the setup we have already accessed to the total fission<br />
cross-section.<br />
The analysis was performed selecting the region of data<br />
that correspond to fission events in the MUSIC spectrum,<br />
separating Ta ions from other species, applying the condition<br />
in the two paddles scintillators plot where the energy<br />
loss provides the charge distribution region of differents<br />
reactions and the clear selection of the fission events,<br />
and normalizing to the beam counting and target thickness.<br />
Special attention was paid to the evaluation of the fission<br />
background since the fission channel, contributes less than<br />
1% to the total reaction cross section. The two scintillators,<br />
allow to further study the background that partially<br />
overlaps the fission region. This is actually the most important<br />
part of the analysis in order to guaranty the final<br />
quality and accuracy of the measurement.<br />
The preliminary values of total fission cross-section of<br />
Ta + p at different energies are the following: 18.49<br />
3.93 mb at 1 GeV, 11.40 1.85 mb at 800 MeV, 5.14<br />
Fission Cross Section (mb)<br />
2<br />
10<br />
10<br />
1<br />
300 400 500 600 700 800 900 1000<br />
Beam energy (AmeV)<br />
Figure 1: Experimental Results vs Simulation. Solid Circle:<br />
This work - Solid line: Simulation (dissipation) - Dotted<br />
Line: Simulation (statistical) - Dashed Line: Prokofiev<br />
Systematics<br />
1.36 mb at 500 MeV and 2.79 1.39 mb at 300 MeV.<br />
In figure 1 we compare the measured cross sections with<br />
sevaral model calculations. The dashed line represents a<br />
widely-used systematics on previously measured data [3].<br />
As can be seen, this systematics clearly over-predict the<br />
data obtained in this work, in particular for the lowest energies.<br />
The two other lines correspond to microscopic calculations<br />
obtained with the intra-nuclear cascade model<br />
(INCL v4.1) coupled to de-excitation code (ABLAv3p).<br />
The dotted line represents a calculation where the fission<br />
probability is calculated according to the statisticl model<br />
of Bohr and Wheeler while the calculation described by<br />
solid line includes a dynamical description of the fission<br />
probability where a nuclear dissipation parameter reduces<br />
the fission flux across the barrier. Both calculation provide<br />
very different predictions of the total fission cross sections,<br />
while the statistical calculation (dotted line) clearly overestimate<br />
the fission cross section, the dynamical model of<br />
the fission width provide a reasonable good description of<br />
the measured data. This work confirms then the validity<br />
of the dynamical description of fission at high excitation<br />
energies as previously stated [2].<br />
References<br />
[1] B. Jurado et al Phys. Rev. Lett. 93(2004) 072501.<br />
[2] J.Benlliure et al Nucl. Phys. A 700 (2002) 469.<br />
[3] A.V. Prokofiev Nucl. Inst. Meth. A 463 (2001) 557.<br />
191
NUSTAR-EXPERIMENTS-04 <strong>GSI</strong> SCIENTIFIC REPORT 2009<br />
Total interaction cross sections of medium mass nuclei<br />
D. Dragosavac 1 , H. Álvarez-Pol 1 , J. Benlliure 1 , B. Blank 2 , E. Casarejos 1 , V. Föhr 3 , M. Gascón 1 ,<br />
W. Gawlikowicz 4 , A. Heinz 5 , K. Helariutta 6 , A. Kelić 3 , S. Lukić 3 , F. Montes 3 , D. Pérez-Loureiro 1 ,<br />
L. Pieńkowski 4 , K-H. Schmidt 3 , M. Staniou 3 , K. Subotić 7 , K. Sümmerer 3 , J. Taieb 8 , A. Trzcińska 4 ,<br />
and M. Veselsky 9<br />
1 USC, Santiago, Spain; 2 CENBG, Gradignan, France; 3 <strong>GSI</strong>, Darmstadt, Germany; 4 Uni. Warsaw, Poland; 5 Yale Uni.,<br />
USA; 6 Uni. Helsinki, Finland; 7 Inst. Vinča, Serbia; 8 CEA/DAM, France; 9 SAS, Bratislava, Slovakia<br />
The radial distribution of protons and neutrons are<br />
fundamental properties of nuclei directly related to the<br />
nucleon-nucleon interaction that sometimes manifest in abnormal<br />
phenomena such as the proton or neutron haloes or<br />
the neutrons skins. Moreover, we know that nuclear radii<br />
can also help to constrain the equation of state (EOS) of<br />
nuclear matter, in particular the symmetry term, at subsaturation<br />
density [1].<br />
Total interaction cross sections of relativistic projectiles<br />
can give access to matter radii for a large variety of nuclear<br />
species [2-4]. In this work we have performed systematic<br />
measurements of total interaction cross sections for long<br />
isotopic chains of medium-mass nuclei covering the radial<br />
evolution of the matter distribution with neutron excess.<br />
The experiment was performed at <strong>GSI</strong> Fragment Separator<br />
(FRS) [5]. Beams of 238 U and 132 Xe around 1 A<br />
GeV were used to produce by fission and fragmentation<br />
reactions medium-mass nuclei (46 < Z < 55) covering<br />
long isotopic chains (e.g. 111 Sn to 136 Sn). The first section<br />
of the FRS provides the separation and identification<br />
of the cocktail beam of exotic projectiles coming from the<br />
production target placed at the entrance of the FRS. The<br />
second section was used to separate and identify the residual<br />
nuclei produced in the interaction of the cocktail beam<br />
species with the beryllium interaction target placed at the<br />
intermediate-image plane of the separator. Both sections<br />
of the spectrometer were equipped with time-projection<br />
chambers, ionization chambers and plastic scintillators for<br />
measuring the magnetic rigidity, atomic number and timeof-flight<br />
of the transmitted nuclei [6,7].<br />
The two reaction mechanism used for producing nuclei<br />
far from stability made it possible to cover long isotopic,<br />
isotonic and isobaric chains of medium-mass nuclei. Then,<br />
total interaction cross sections were determined using the<br />
transmission method, counting the number of projectiles<br />
impinging the interaction target and the number of projectiles<br />
arriving to the final image plane of the spectrometer.<br />
The measured values were corrected by the optical transmission<br />
of the ions, detection efficiency and interaction in<br />
other layers of matter than the target by using the measurements<br />
without interaction target. Using this method we<br />
could determine total interaction cross sections for more<br />
than 150 different medium-mass nuclei with an accuracy<br />
mainly limited by statistics for the most exotic species.<br />
Figure 1 shows the measured total interaction cross sections<br />
for the 23 tin isotopes produced in this experiment.<br />
192<br />
These cross sections are compared with the predictions obtained<br />
with a Glauber-model calculation using the optical<br />
limit approach and two parameter Fermi distributions to describe<br />
the radial distribution of protons and neutrons [8]. In<br />
this case the half-density radius and the surface thickness<br />
parameter of the Fermi distributions were obtained from<br />
the droplet model of Myers [9].<br />
(mb)<br />
i<br />
σ<br />
2700<br />
2600<br />
2500<br />
2400<br />
2300<br />
2200<br />
2100<br />
2000<br />
1900<br />
Sn isotopes<br />
GMOL+Fermi droplet<br />
1800<br />
110 115 120 125 130 135<br />
Mass number<br />
Figure 1: Total interaction cross sections for tin isotopes<br />
compared to model calculation.<br />
The total interaction cross sections for the most neutrondeficient<br />
tin isotopes increase smoothly with the mass but<br />
for the most neutron-rich isotopes this increase is much<br />
stronger. This result would indicate that the spatial extension<br />
of the most neutron-rich tin isotopes is wider than predicted,<br />
and could be signature for a skin structure in those<br />
nuclei.<br />
References<br />
[1] A.W. Steiner et al., Phys. Rep. 411 (2005) 325<br />
[2] A. Ozawa et al., Nucl. Phys. A 709 (2002) 32<br />
[3] A. Khouaja et al., Nucl. Phys. A 780 (2006) 1<br />
[4] N. Aissaoui et al., Phys. Rev. C60 (1999) 034614<br />
[5] H. Geissel et al., Nucl. Instr. and Meth. B 70 (1992) 286<br />
[6] J. Benlliure et al., Phys. Rev. C 78 (2008) 054605<br />
[7] J. Pereira et al., Phys. Rev. C 75 (2006) 044612<br />
[8] P.J. Karol, Phys. Rev. C 11 (1975) 1203<br />
[9] W.D. Myers and K.-H. Schmidt, Nucl. Phys A 410 (1983) 61
<strong>GSI</strong> SCIENTIFIC REPORT 2009 NUSTAR-EXPERIMENTS-05<br />
Improved modelling of helium and tritium production for spallation targets<br />
S. Leray 1 , A. Boudard 1 , J. Cugnon 2 , J.C. David 1 , A. Kelić-Heil 3 , D. Mancusi 2 , M.V. Ricciardi 3<br />
1 CEA/Saclay, Irfu/SPhN, Gif-sur-Yvette, France; 2 FIPA, University of Lige, Belgium; 3 <strong>GSI</strong>, Darmstadt, Germany<br />
Reliable predictions of light-charged particle (LCP) production<br />
in spallation reactions are important to correctly<br />
assess gas production in spallation targets. In particular,<br />
He production yield is important for assessing damage in<br />
the window separating the target and the accelerator vacuum,<br />
and tritium is a major contributor to the target radioactivity.<br />
Up to now, the models available in the MCNPX<br />
transport code, including the widely used default option<br />
Bertini-Dresner and the INCL4.2-ABLA combination of<br />
models, were not able to correctly predict light-charged<br />
particle yields. Here, we present the work done recently<br />
on both the intranuclear cascade model INCL4.5 [1] and<br />
on the de-excitation model ABLA07 [2] to improve the<br />
LCP prediction, in particular tritium and helium.<br />
In LCP energy spectra, two different components are<br />
generally observed: a low-energy isotropic peak coming<br />
from the evaporation stage, and a high-energy forwardpeaked<br />
tail, coming from initial reaction stage. The contribution<br />
of the latter in the production cross sections of<br />
tritium and 3 He is far from being negligible. This is why a<br />
coalescence mechanism leading to LCP emission has been<br />
implemented into INCL (first in ref. [2], later in ref. [1,<br />
3]). The cluster emission mechanism is based on surface<br />
coalescence in phase-space i.e. on the assumption that a<br />
cascade nucleon ready to escape at the nuclear surface can<br />
coalesce with other nucleons close enough in phase space<br />
and form a cluster. All possible clusters up to a given<br />
mass number are formed and the priority is given to the<br />
one with the lowest excitation energy per nucleon. The<br />
selected cluster is emitted only if it succeeds to go<br />
through the Coulomb barrier. In INCL4.5 clusters up to<br />
mass 8 are considered.<br />
In the original version of ABLA only nucleons and alphas<br />
could be evaporated. The new version [2] now allows<br />
the evaporation of all the types of light charged particles<br />
from p to 4 He and also of intermediate mass fragments.<br />
It uses improved parameterizations of inverse<br />
reaction cross sections and barriers of potential in order to<br />
better reproduce experimental particle energy spectra. A<br />
simultaneous break-up (multifragmentation) mechanism<br />
has been added for systems overcoming a certain limiting<br />
temperature. The fission part has also been modified.<br />
In figure 1, the experimental light composite particle<br />
energy spectra [5] for the reaction p+Ta at 1.2 GeV are<br />
compared with the results obtained with INCL4.5-<br />
ABLA07. The dashed curve shows the contribution coming<br />
from the coalescence process in INCL4.5. It is evident<br />
that the combination of the two new models is rather successful<br />
and represents a definite improvement compared<br />
to the former models, which did not evaporate tritium and<br />
3 He and were unable to account for the high energy tail of<br />
the particle spectra. A more detailed description of this<br />
work can be found in ref. [6]. Comparisons with many<br />
more experimental data and with other available models<br />
are also presented there.<br />
This work was partly supported by the FP6 Euratom project<br />
EUROTRANS/NUDATRA, EC contract number<br />
FI6W-CT-2004-516520.<br />
Figure 1: Light composite particle double-differential cross sections<br />
in the p+Ta reaction at 1.2 GeV [5] compared with the<br />
results of INCL4.5-ABLA07. Each successive curve, starting<br />
from the smallest angle, is scaled by a multiplicative factor of<br />
10 −1 . The contribution due to the coalescence process in<br />
INCL4.5 is given by the dashed line.<br />
References<br />
[1] A. Boudard and J. Cugnon, Proc. of the ICTP-IAEA<br />
Advanced Workshop on Model Codes for Spallation<br />
Reactions, ICTP Trieste, Italy, 4-8 February 2008.<br />
[2] A. Kelic, M.V. Ricciardi and K.-H. Schmidt, Proc. of<br />
the ICTP-IAEA Advanced Workshop on Model<br />
Codes for Spallation Reactions, ICTP Trieste, Italy,<br />
4-8 February 2008.<br />
[3] A. Boudard et al., Nucl. Phys. A 740, 195 (2004).<br />
[4] J. Cugnon et al., Proc. of the International Topical<br />
Meeting on Nuclear Research Applications and Utilization<br />
of Accelerators, 4-8 May 2009, Vienna.<br />
[5] C.M. Herbach et al., Nucl. Phys. A 765, 426 (2006).<br />
[6] S. Leray et al., Nucl. Inst. Meth. B. In press.<br />
193
NUSTAR-EXPERIMENTS-06 <strong>GSI</strong> SCIENTIFIC REPORT 2009<br />
194<br />
S304: Measurement of the spallation of 136 Xe in inverse kinematics<br />
at 1 GeV per nucleon<br />
J.-É. Ducret 1 , T. Aumann 2 , Y. Ayyad 3 , S. Bianchin 2 , O. Borodina 2,4 , A. Boudard 1 , C. Caesar 2 ,<br />
E. Casajeros 3 , B. Czech 5 , T. Gorbinet 1 , S. Hlavac 6 , N. Kurz 2 , C. Langer 2 , T. Le Bleis 2 , A. Le<br />
Fèvre 2,6 , S. Leray 1 , J. Lukasik 5 , P. Pawlowski 5 , S. Pietri 2 , C. Rappold 2,8 , M.-D. Salsac 1 , T.R. Saito 2,4 ,<br />
H. Simon 2 , M. Veselsky 6 , and O. Yordanov 9<br />
1 IRFU, CEA-Saclay, F91191 Gif sur Yvette, France; 2 <strong>GSI</strong>, Darmstadt, Germany; 3 University of Santiago de<br />
Compostella, Spain; 4 Institut <strong>für</strong> Kernphysik, University of Mainz, Germany; 5 Institute of Nuclear Physics, Polish<br />
Academy of Sciences, Krakow, Poland; 6 Institute of Physics, Slovak Academy of Sciences, Bratislava, Slovakia;<br />
7 Subatech, Nantes, France; 8 IPHC, Strasbourg, France; 9 Institute of Nuclear Research & Nuclear Energy, Bulgarian<br />
Academy of Sciences, Sofia, Bulgaria<br />
A few years ago, a program of spallation experiments<br />
in inverse kinematics was undertaken in <strong>GSI</strong> with extensive<br />
measurements of spallation-residue production crosssections<br />
at FRS on systems ranging from 56 F e + p to<br />
238 U + d at energies from 250 to 1500 MeV per nucleon<br />
with highly-resolved mass - charge identification & centreof-mass<br />
longitudinal velocity reconstruction [1]. In 2000,<br />
new experiments began with the detection in coincidence<br />
of the produced light & heavy fragments & neutrons [2].<br />
These experiments were aiming at understanding in detail<br />
the spallation mechanism, with emphasis either on the<br />
fission channels of spallation [3] or on the de-excitation<br />
mechanisms as a function of the mean excitation energy<br />
of the projectile (i.e. of the projectile size) [2, 4]. Our<br />
first results were published in 2008 [5] for the 56 F e + p<br />
reaction at 1 GeV per nucleon, where we could distinguish<br />
between different decay channels of the excited projectile<br />
& where we studied the production of fragments (Z ≥ 3)<br />
as a function of the excitation of the projectile in a modelindependent<br />
way. The experiment S304 [4] is aiming at<br />
such a coincidence measurement on 136 Xe+p & 28 Si+p.<br />
We did our 136 Xe run in April 2009, in Cave C.<br />
Figure 1: Sketch of the S304 Set-up in Cave C.<br />
Our set-up is sketched on Fig. 1. The beam diagnostics<br />
of Cave C were used. The projectile residues of charge<br />
Z ≥ 15 were detected in a Multiple Sampling Ionisation<br />
Chamber (MUSIC) set between the target & the ALADIN<br />
magnet entrance & in a (TWIN) MUSIC behind. The neu-<br />
trons were detected in LAND & the lighter charged fragments<br />
in the highly-segmented ALADIN TOF WALL, installed<br />
at the exit of the magnet. A charge spectrum (up<br />
to Z = 14) of one scintillator is shown on Fig. 2.<br />
Figure 2: Charge spectrum of one scintillator of the AL-<br />
ADIN TOF WALL.<br />
We used two different targets: a new thin-wall liquidhydrogen<br />
target built on purpose in Saclay & a 12 C target,<br />
which will permit to study two reactions, 136 Xe + p &<br />
136 Xe + 12 C, at a beam energy of 1 GeV per nucleon.<br />
The experiment ran well with very stable beam conditions<br />
& high statistics of events were recorded. The data analysis<br />
is currently running, with the aim of producing our first<br />
results by the end of 2010. Emphasis is made on the understanding<br />
of LAND to reconstruct the expected high neutron<br />
multiplicities.<br />
References<br />
[1] C. Villagrasa-Canton et al., Phys. Rev. C 75, 044603 (2007)<br />
& references therein.<br />
[2] J.-É. Ducret et al., exp. S248, <strong>GSI</strong>-EA (2000)<br />
[3] A. Boudard et al., exp. S293, <strong>GSI</strong>-EA (2005)<br />
[4] J.-É. Ducret et al., exp. S304, <strong>GSI</strong>-EA (2005)<br />
[5] É. Le Gentil et al., Phys. Rev. Lett. 100, 022701 (2008)
<strong>GSI</strong> SCIENTIFIC REPORT 2009 NUSTAR-EXPERIMENTS-07<br />
High-Precision Momentum Measurements of Projectile Fragments in<br />
112,124 Sn+ 112,124 Sn Collisions at 1 A GeV*<br />
V. Föhr 1 , A. Bacquias 2 , V. Henzl 3 , A. Kelić-Heil 1 , M.V. Ricciardi 1 , K.-H. Schmidt 1 for the<br />
CHARMS collaboration<br />
1 <strong>GSI</strong>, Darmstadt, Germany; 2 CENBG, Bordeaux-Gradignan, France; 3 MSU, East Lansing, MI 48824, U.S.A.<br />
The longitudinal re-acceleration phenomenon of the<br />
fragmentation residues, was observed originally in the<br />
projectile fragmentation of uranium [1,2] at the Fragment<br />
Separator (FRS), <strong>GSI</strong> Darmstadt. According to transport<br />
calculations [3], this phenomenon is related to the participants<br />
blast, and the longitudinal momenta of the surviving<br />
residues can give a direct access to the momentumdependent<br />
properties of the nuclear mean field (MF), little<br />
affected by the uncertainties in nuclear incompressibility<br />
[3]. After this first experimental observation, a set of experiments<br />
was carried out at the FRS. The aim was to<br />
explore the dependence of the reacceleration phenomenon<br />
on the initial beam energy, on the system size, as well as<br />
the importance of the isospin effects on the evolution and<br />
strength of the participants' blast. The dependence on the<br />
initial beam energy and on the size of the system was pursued<br />
by studying the reactions 197 Au+ 197 Au and 197 Au+Al<br />
at 500 and 1000 A MeV [4] at the FRS, <strong>GSI</strong>.<br />
This work is devoted to study the importance of the<br />
isospin effects. To this purpose the fragmentation of two<br />
systems, 112 Sn+ 112 Sn and 124 Sn+ 124 Sn at 1000 A MeV,<br />
whose N/Z ratio is 1.24 and 1.48 respectively, was studied.<br />
If there are sensible effects of the momentum on the<br />
isospin dependence of the MF (as it is expected in this<br />
energy regime [5]) one could expect sensible differences<br />
[3] for the momentum transfer to the spectators, that<br />
would be detectable in the mean longitudinal velocity of<br />
fragments from systems with different isospin content.<br />
The experiment was performed using the highresolution<br />
magnetic spectrometer, the FRS, at <strong>GSI</strong>. The 1<br />
A GeV 112 Sn and 124 Sn beams impinged on two thin targets<br />
of 112 Sn and 124 Sn, respectively. The magnetic rigidity<br />
of each projectile-residue could be measured with high<br />
precision by determining the deflection in a magnetic<br />
dipole field. This gave a measure of the longitudinal momentum<br />
– and hence on the longitudinal velocity – with a<br />
uncertainty of ± 5⋅10 -4 once the product is identified in<br />
mass and atomic number. Details of the experimental setup<br />
and the detector equipment, as well as a description of<br />
the analysis method can be found in ref. [1,2,4,6].<br />
To give an idea of the precision of the method, in figure<br />
1, as an example of longitudinal velocity distribution, we<br />
present the measured spectra of two fragments, 65 Zn and<br />
82 Sr. The velocity is given in the frame where the beam is<br />
at rest. The mean values of the velocity distributions of<br />
fragmentation residues as a function of their mass number<br />
are shown in figure 2. Statistical uncertainties are not<br />
shown in order not to overload the figure. They correspond<br />
to the fluctuations of the points. The absolute un-<br />
* This work forms part of Ville Föhr 's PhD thesis.<br />
certainty amounts to less than 0.03 cm/ns for each system,<br />
independently.<br />
With increasing mass loss, the velocities first decrease<br />
as expected from previously established systematics [6],<br />
described bye the dashed line, then level off, and finally<br />
increase again, the same tendency as observed in ref.<br />
[1,2,4]. The discussion on the physical results and the<br />
comparison of the experimental results with theoretical<br />
predictions is still in progress.<br />
Figure 1: Example of longitudinal velocity spectra for two<br />
final fragments: 65 Zn and 82 Sr.<br />
Figure 2: Measured mean value of the longitudinal velocity<br />
as a function of the mass of the fragments produced in<br />
the reactions 112,124 Sn+ 112,124 Sn at 1 A GeV. The dashed<br />
line gives the prediction of the Morrissey's systematic [7].<br />
References<br />
[1] T.Enqvist et al., Nucl. Phys. A658 (1999) 47.<br />
[2] M.V.Ricciardi et al., Phys. Rev. Lett. 90 (2003)<br />
212302<br />
[3] L.Shi, P.Danielewicz and R.Lacey, Phys. Rev. C64<br />
(2001) 034601.<br />
[4] V. Henzl, PhD Thsis, TU Prague, Czech Rep., 2001.<br />
[5] V.Greco et al., Phys. Let. B 562 (2003) 215.<br />
[6] V. Föhr, PhD Thesis, Univ. of Jyväskylä, Finland, in<br />
prepapartion.<br />
[7] D. J. Morrissey, Phys. Rev. C 39 (1989) 460.<br />
195
NUSTAR-EXPERIMENTS-08 <strong>GSI</strong> SCIENTIFIC REPORT 2009<br />
196<br />
Origin of the even-odd effect in the yields from high-energy reactions<br />
M. Valentina Ricciardi 1 , Karl-Heinz Schmidt 1 and Aleksandra Kelić-Heil 1<br />
1 <strong>GSI</strong>, Darmstadt, Germany<br />
In 2004, the analysis of experimental production crosssections<br />
of relatively light nuclei produced by fragmentation<br />
in the reaction 238 U+Ti at 1 A GeV revealed a very<br />
strong and complex even-odd staggering [1]. The experiment<br />
was performed at the FRS, at <strong>GSI</strong>, Darmstadt. It was<br />
concluded that structural effects cannot be attributed to<br />
the surviving of nuclear structure of the colliding nuclei,<br />
as in low-energy fission; the structures appear as the result<br />
of the condensation process of heated nuclear matter<br />
while cooling down in the evaporation process [1].<br />
Here, we want to discuss which kind of staggering we<br />
have to expect in the cold final products due to the influence<br />
of an evaporation cascade starting from hot prefragments.<br />
After their formation, the initial pre-fragments<br />
are definitely free of any even-odd structure, because<br />
there is no pairing above the critical pairing energy. The<br />
number of available states from a certain total excitation<br />
energy of the decaying system is essentially determined<br />
by a mostly structureless level density above a fictive<br />
liquid-drop ground state. This structureless cloud in N and<br />
Z rains down in excitation energy and in nucleon number<br />
due to evaporation. This process is essentially deterministic,<br />
because in most cases one particle dominates and the<br />
variation of the kinetic energy of the emitted particle is<br />
small compared to the binding energy. In this way, a welldefined<br />
3-dimensional subspace of the N, Z ,E* initial<br />
production cloud ends up in a certain fragment. As a consequence,<br />
the final yields will be modulated by the range<br />
of excitation energy below the lowest particle threshold.<br />
In order to visualise this idea, in figure 1 we present the<br />
lowest particle threshold for each nuclide, calculated as<br />
the minimum value between the proton and neutron separation<br />
energies. The data are taken from ref. [3].<br />
Recently, we performed a new systematic analysis of<br />
the even-odd effect over a large range of nuclear reactions,<br />
nuclear systems and energies. It is impressive how<br />
the staggering of the lowest particle threshold, shown in<br />
figure 1, is consistent with the even-odd staggering in the<br />
yields of ref. [1] and all other analysed data.<br />
Hereafter, among all new analysed data, we focus on<br />
the reaction 56 Fe+Ti at 1 A GeV [2], where it was possible<br />
to extend the measurement of production cross sections<br />
down to Li isotopes. The kinematical properties of the<br />
light products (IMF) indicate that they are produced in<br />
multifragmentation events, as a consequence of a thermal<br />
instability. We will consider two possible scenarios at<br />
freeze-out. In the first scenario, the IMFs are essentially<br />
produced in their ground state; the yields are governed by<br />
Boltzmann statistics under certain conditions. This implies<br />
that the essential parameter related to the yields is<br />
the binding energy of the respective IMF. In the second<br />
scenario, the fragments at freeze-out are essentially produced<br />
with excitation energies above the critical pairing<br />
energy and will undergo the de-excitation process; the<br />
essential parameter related to the yields is the lowest particle<br />
threshold of the respective IMF. In figure 2, the<br />
measured IMF cross sections from ref. [2] are compared<br />
to the extra binding energy due to pairing (obtained by<br />
subtracting a calculated LD part from the values of ref.<br />
[3]) and to the lowest particle separation energy. The results<br />
indicate clearly that assuming that IMFs are produced<br />
cold at freeze-out is wrong, even for very light<br />
IMFs such as Li isotopes. So, it is dangerous to extract<br />
fundamental properties of hot nuclear matter assuming<br />
that the population at freeze-out is given by the<br />
Boltzmann factor. The situation is even more severe when<br />
these methods are extended to treat even heavier final<br />
fragments. It was recognized previously that the determination<br />
of the freeze-out temperature with the isotopic<br />
yield thermometer might be disturbed by the evaporation<br />
process [4]. Several authors investigated this problem by<br />
means of nuclear models and proposed suitable corrections<br />
to this effect. Our analysis on the fine structure observed<br />
in the yields indicates in a model-independent way<br />
the dominant role of the evaporation process.<br />
Figure 1: Lowest particle threshold (in keV).<br />
Figure 2: Staggering in the lowest particle threshold<br />
(MeV) and in the binding energies (MeV) compared to<br />
measured fragmentation cross sections (mb).<br />
References<br />
[1] M.V. Ricciardi et al., Nucl. Phys. A 733 (2004) 299.<br />
[2] P. Napolitani et al., Phys. Rev. C 70 (2004) 054607.<br />
[3] G. Audi, A. H. Wapstra and C. Thibault, Nucl. Phys.<br />
A729 (2003) 337.<br />
[4] M. B. Tsang et al., Phys. Rev. Let. 78 (1997) 3836
<strong>GSI</strong> SCIENTIFIC REPORT 2009 NUSTAR-EXPERIMENTS-09<br />
Properties of the 7 He ground state from 8 He neutron knockout ∗<br />
Yu. Aksyutina 1,2 , H.T. Johansson 2 , T. Aumann 1 , K. Boretzky 1 , M.J.G. Borge 3 , A. Chatillon 1 ,<br />
L.V. Chulkov 1,4 , D. Cortina-Gil 5 , U. Datta Pramanik 6 , H. Emling 1 , C. Forssén 1 , H.O.U. Fynbo 7 ,<br />
H. Geissel 1 , G. Ickert 1 , B. Jonson 2 , R. Kulessa 8 , C. Langer 1,9 , M. Lantz 2 , T. Le Bleis 1,9 , K. Mahata 1 ,<br />
G. Münzenberg 1 , T. Nilsson 2 , G. Nyman 2 , S. Paschalis 10 , W. Prokopowicz 1 , R. Reifarth 1,9 ,<br />
A. Richter 11 , K. Riisager 7 , G. Schrieder 11 , H. Simon 1 , K. Sümmerer 1 , O. Tengblad 3 , H. Weick 1 , and<br />
M. Zhukov 2<br />
1 <strong>GSI</strong>, Germany; 2 Chalmers University of Technology, Sweden; 3 CSIC Madrid, Spain; 4 RRC Kurchatov Institute<br />
Moscow, Russia; 5 University of Santiago de Compostela, Spain; 6 SINP Kolkata, India; 7 Aarhus University, Denmark;<br />
8 Jagellonian University Krakow, Poland; 9 University of Frankfurt, Germany; 10 University of Liverpool, United<br />
Kingdom; 11 Technische Universität, Darmstadt, Germany<br />
Neutron-knockout reactions with a 240 MeV/u 8 He<br />
beam in a liquid-hydrogen target have been studied in an<br />
experiment at the ALADIN-LAND setup. The detection of<br />
6 He in coincidence with a neutron permits to reconstruct<br />
the relative-energy of the unbound 7 He system using the<br />
relativistic equation:<br />
Efn = |Pf + Pn| − Mf − mn, (1)<br />
where Pf (Pn) is the fragment (neutron) four-momentum<br />
and Mf (mn) is the mass of the fragment (neutron).<br />
A previous measurement of 7 He, performed with a carbon<br />
target, showed a spectrum which could not be described<br />
as a single Breit-Wigner resonance [1, 2]. The deviation<br />
from the Breit-Wigner shape was tentatively interpreted<br />
as corresponding to the first excited state in 7 He with<br />
possible spin-parity 1/2 − . The present experiment was performed<br />
at the same setup, but with a hydrogen target. The<br />
obtained relative-energy spectrum of 6 He +n is shown in<br />
Fig. 1 (upper panel). It can be described by single Breit-<br />
Wigner resonance at an energy above the neutron-decay<br />
threshold Er = 0.387(2) MeV with Γ = 0.190(6) MeV.<br />
No excited states are observed.<br />
The difference between results of the two experiments<br />
may originate in a eventual target dependence. Hydrogen<br />
is the simplest nuclear probe, while the carbon nucleus<br />
exhibits a complex structure and may affect the reaction<br />
mechanism. One possible explanation is multiple scattering,<br />
which can play a role even at relativistic energies and<br />
is more pronounced in the case of the carbon target. A second<br />
possibility is, that an excited state with a 6 He(2 + ) + n<br />
structure was observed on the carbon target. Such state,<br />
however, cannot be excited in a single-step process on a<br />
hydrogen target.<br />
The spectroscopic factor for the 6 He(0 + )+n configuration<br />
was obtained as ratio of the observed reduced width<br />
and the single-particle reduced width, Sn=γ 2 obs /γ2 sp. In order<br />
to perform a model-independent analysis, the singleparticle<br />
reduced width was taken from the 5 He spectrum<br />
obtained in Ref. [1]. Its ground state represents an ideal<br />
∗ This work was supported by the Alliance Program of the Helmholtz<br />
Association (HA216/EMMI)<br />
Figure 1: Relative-energy spectrum of 6 He+n, obtained<br />
after one neutron knockout in hydrogen target [3] (upper<br />
panel) and the relative-energy spectrum of 4 He+n [1], obtained<br />
with a carbon target (lower panel).<br />
case of a single-particle p 3/2 state. However, the lowenergy<br />
part of the spectrum shows a deviation from a<br />
pure Breit-Wigner shape. In the reanalysis, performed in<br />
Ref. [3] a contribution from s-wave scattering was suggested.<br />
This permits to separate the contribution from the<br />
s-wave component and to extract the single-particle width<br />
for the p-state. The obtained γ 2 sp value for 5 He was scaled<br />
to the mass of 7 He. The deduced spectroscopic factor<br />
Sn=0.61 disagrees with the assumption of a single-particle<br />
structure of the 7 He ground state and suggests configuration<br />
mixing.<br />
References<br />
[1] K. Markenroth et al., Nucl. Phys. A 679 (2001) 462<br />
[2] M. Meister et al., Phys. Rev. Lett. 88 (2002) 102501<br />
[3] Yu. Aksyutina et al., Phys. Lett B 679 (2009) 191<br />
197
NUSTAR-EXPERIMENTS-10 <strong>GSI</strong> SCIENTIFIC REPORT 2009<br />
Three-body correlations as a key to the structure of 10 He ∗<br />
H.T. Johansson 1 , Yu. Aksyutina 1,2 , T. Aumann 2 , K. Boretzky 2 , M.J.G. Borge 3 , A. Chatillon 2 ,<br />
L.V. Chulkov 2,4 , D. Cortina-Gil 5 , U. Datta Pramanik 6 , H. Emling 2 , C. Forssén 1 , H.O.U. Fynbo 7 ,<br />
H. Geissel 2 , G. Ickert 2 , B. Jonson 1 , R. Kulessa 8 , C. Langer 2,9 , M. Lantz 1 , T. Le Bleis 2,9 , K. Mahata 2 ,<br />
G. Münzenberg 2 , T. Nilsson 1 , G. Nyman 1 , S. Paschalis 10 , W. Prokopowicz 2 , R. Reifarth 2,9 ,<br />
A. Richter 11 , K. Riisager 7 , G. Schrieder 11 , H. Simon 2 , K. Sümmerer 2 , O. Tengblad 3 , H. Weick 2 , and<br />
M. Zhukov 1<br />
1 Chalmers University of Technology, Sweden; 2 <strong>GSI</strong>, Germany; 3 CSIC Madrid, Spain; 4 RRC Kurchatov Institute<br />
Moscow, Russia; 5 University of Santiago de Compostela, Spain; 6 SINP Kolkata, India; 7 Aarhus University, Denmark;<br />
8 Jagellonian University Krakow, Poland; 9 University of Frankfurt, Germany; 10 University of Liverpool, United<br />
Kingdom; 11 Technische Universität, Darmstadt, Germany<br />
The results of an experiment with a relativistic 11 Li<br />
beam, with energy of 280 MeV/u, impinging on a liquid<br />
hydrogen target are discussed. Proton knockout from 11 Li<br />
leads to the formation of the unbound 10 He system, followed<br />
by its subsequent decay. The experimental setup,<br />
consisting of the neutron detector LAND, the dipole spectrometer<br />
ALADIN and different types of tracking detectors,<br />
allows to reconstruct the momentum vectors of all decay<br />
products measured in coincidence. The properties of<br />
the unbound nucleus 10 He are investigated by determining<br />
the relative-energy spectrum as well as by studying the angular<br />
and energy correlations between the decay products.<br />
The relative-energy spectrum allows to observe resonances<br />
and determine their position and width, while three-body<br />
correlations provide information about their structure.<br />
The obtained relative-energy spectrum in the 8 He+n+n<br />
system can be affected by the initial correlations in the 11 Li<br />
( 9 Li + n + n) projectile. This leads to two possible alternative<br />
interpretations that are shown in Fig. 1. The spectrum<br />
can be described either as a ground-state resonance superimposed<br />
to the correlated background explained in the beginning<br />
of this paragraph, Fig. 1(a), or as a ground-state<br />
resonance overlapping with an excited state, Fig. 1(b).<br />
Figure 1: Two interpretations of the relative-energy spectrum<br />
of 10 He.<br />
The correlations between the decay products of 10 He<br />
permit to give a preference to the latter version. A convenient<br />
description of the three-body system is achieved<br />
in terms of so-called Jacobi momenta. One of them, q12,<br />
∗ This work was supported by the Alliance Program of the Helmholtz<br />
Association (HA216/EMMI)<br />
198<br />
is the relative momentum between two particles, core-n or<br />
n-n, while the second connects center of mass of this system<br />
to the third particle – q3−12. After integration over<br />
all possible orientations of the three-body system, the correlations<br />
can be described by three variables: the angle θ<br />
between Jacobi momenta q12 and q3−12, the total relative<br />
energy ECnn in the three-body system and the fractional<br />
energy ε12 =q 2 12/ECnn in a particular pair of particles.<br />
The obtained distributions, corresponding to the relativeenergy<br />
interval 0 – 3 MeV are shown in Fig. 2. The<br />
Figure 2: Energy and angular correlations in 8 He + n + n<br />
system in the relative-energy interval 0 – 3 MeV.<br />
dashed line corresponds to predicted correlations using a<br />
11 Li wave-function [1] as correlated background. The solid<br />
line represents a fit assuming a spin-parity of I π = 0 + .<br />
The difference between experimental and theoretical distribution<br />
demonstrates the effect of the final-state interaction<br />
leading to the 10 He ground state. The correlations observed<br />
for 3 < ECnn < 7 MeV give a more evident picture and<br />
can be described assuming I π = 2 + . Eventually, the experimental<br />
spectrum is interpreted as 0 + 10 He ground state<br />
and an 2 + excited state.<br />
References<br />
[1] N. Schulgina et al., Nucl. Phys. A825(2009)175.
<strong>GSI</strong> SCIENTIFIC REPORT 2009 NUSTAR-EXPERIMENTS-11<br />
One nucleon knockout reactions from light carbon isotopes ∗<br />
V. Volkov † 1 , T. Aumann 2 , J. Enders 1 , F. Farinon 2 , H. Geissel 2 , M. Holl 1 , N. Iwasa 5 , R. Janik 6 , R.<br />
Krucken 4 , P. Maierbeck 4 , C. Nociforo 2 , A. Prochazka 2 , C. Rodriguez-Tajes 3 , H. Simon 2 , B. Sitar 6 , P.<br />
Strmen 6 , K. Summerer 2 , H. Weick 2 , and J. Winfield 2<br />
1 Technische Universitat Darmstadt, Germany; 2 <strong>GSI</strong>, Darmstadt, Germany; 3 Universidad de Santiago de Compostela,<br />
Spain; 4 Technische Universitat Munchen, Germany; 5 Tohoku University, Japan; 6 Univerzita Komenskeho, Bratislava,<br />
Slovakia<br />
Knockout of single nucleons from beams with intermediate<br />
to relativistic velocities is widely used to elucidate<br />
the single-particle structure of nuclei, in particular<br />
for rare isotopes, see Ref. [1]. It has been argued [2]<br />
that nucleon knockout reactions provide access to absolute<br />
spectroscopic factors. Measured spectroscopic factors<br />
C 2 exp are smaller than those predicted within a shell-<br />
model calculation, C2 th . The quenching factor Rs =<br />
σexp/σth = C2 exp /C2 th from relativistic appears to approach<br />
unity for small binding energies of the knockedout<br />
nucleon, whereas for deeply bound nucleons significant<br />
quenching Rs ≪ 1 is observed, see [3].<br />
Experiment S341 studied, among others, the inclusive<br />
knockout reactions 9Be( 12C, 11C)X, 9Be( 11C, 10C)X, 9 10 9 9 9 8 Be( C, C)X, and Be( C, B)X, thereby covering a large<br />
range of binding energy difference values. The reactions<br />
with residues 9C and 8B benefit from the fact that the<br />
ground state is the only bound state in these nuclei. The<br />
reactions 9Be( 12C, 11C)X and 9Be( 9C, 8B)X have been carried<br />
out before and may serve for benchmarking the experiment.<br />
The experiment used an incident 12C beam from the SIS<br />
at 1670 MeV/nucl. impinging on a 4 g/cm2 beryllium sheet<br />
at the FRS target position. At the intermediate F2 focus of<br />
the FRS, a 4.9 g/cm2 Be target served as secondary breakup<br />
target after charge identification in a preceding scintillator.<br />
The outgoing residues were tracked using timeprojection<br />
chambers (TPC). To maximize transmission, the<br />
reaction residues were detected at the third FRS focus F3<br />
using TPC tracking and scintillation detectors for charge<br />
identification and time-of-flight measurement.<br />
The ongoing data analysis resulted in preliminary cross<br />
sections between 21(2) mb (for ( 10C, 9C)) and 51(4) mb<br />
(for ( 12C, 11C)). Using the Glauber model for describing the<br />
reaction and shell-model predictions for the spectroscopic<br />
factors from the Cohen-Kurath p-shell interaction, we extract<br />
the following preliminary reduction factors: 0.55(5)<br />
for ( 12C, 11C), 0.33(5) for ( 11C, 10C), 0.47(6) for ( 10C, 9C), and 0.79(7) for ( 9C, 8B). With the exception of the unexpectedly<br />
low value for the ( 11C, 10C) reaction, the preliminary<br />
results support the trend of Ref. [3] and are in agreement<br />
with previous data.<br />
∗ Work supported by <strong>GSI</strong> research and development program DA PIET<br />
and BMBF, contract 06DA9040I<br />
† v.volkov@gsi.de<br />
Figure 1: Charge identification at F2 (left) and mass to<br />
charge ratio identification at F3 (right)<br />
It has been argued that the reduction of spectroscopic<br />
strength originates from correlations that are not accounted<br />
in conventional shell-model calculations. While, e.g., the<br />
Cohen-Kurath value for the spectroscopic factor amounts<br />
to 1.73, within the Green’s function Monte-Carlo approach<br />
a value of 1.04 is obtained [4] so that with respect to that<br />
model the quenching factor would be much closer to unity.<br />
We note that Timofeyuk suggested recently [5] how contributions<br />
from excluded model spaced in shell-model calculations<br />
with limited model space could be accounted for.<br />
References<br />
[1] P. G. Handen, J. A. Tostevin, Annu. Rev. Nucl. Part. Sci. 53,<br />
219 (2003)<br />
[2] B. A. Brown et al., Phys. Rev. C 65, 061601(R) (2002)<br />
[3] A. Gade et al., Phys. Rev. C 77, 044306 (2008)<br />
[4] R. B. Wiringa, private communication<br />
[5] N. K. Timofeyuk, Phys. Rev. Lett. 103, 242501 (2009)<br />
199
NUSTAR-EXPERIMENTS-12 <strong>GSI</strong> SCIENTIFIC REPORT 2009<br />
Two-Nucleon Knockout Reactions from 11 C ∗<br />
M. Holl 1 , T. Aumann 2 , D. Cortina-Gil 3 , J. Enders 1 , F. Farinon 2 , H. Geissel 2 , N. Iwasa 5 , R. Janik 6 ,<br />
R. Krücken 4 , P. Maierbeck 4 , C. Nociforo 2 , A. Prochazka 2 , C. Rodriguez-Tajes 3 , H. Simon 2 ,<br />
B. Sitar 6 , P. Strmen 6 , K. Sümmerer 2 , V. Volkov 1 , H. Weick 2 , and J. Winfield 2<br />
1 Technische Universität Darmstadt, Germany; 2 <strong>GSI</strong>, Darmstadt, Germany; 3 Universidad de Santiago de Compostela,<br />
Spain; 4 Technische Universität München, Germany; 5 Tohoku University, Sendai, Japan; 6 Univerzita Komenskeho,<br />
Bratislava, Slovakia<br />
Two-nucleon knockout reactions of the more deficient<br />
nucleon species have the property to proceed as an almost<br />
completely direct process which makes them interesting for<br />
nuclear spectroscopy [1]. The FRS experiment S341 studied,<br />
amongst other things, an example of such a reaction,<br />
the two-neutron knockout reaction from 11 C. For this reaction<br />
the momentum distribution was measured as well as<br />
the reaction cross section.<br />
If one compares the cross sections obtained experimentally<br />
to those calculated by the theory described above,<br />
one often observes that the experimental values are significantly<br />
lower. As a measure of these deviations one can<br />
define a reduction factor by taking the ratio of the experimentally<br />
and theoretically found spectroscopic factors or,<br />
in the case of a knockout reaction, by taking the ratio of the<br />
experimental and theoretical cross sections [1, 2].<br />
The 11 C beam was created by a particle beam of 1670<br />
AMeV 12 C hitting a 4 g<br />
cm 2 production target placed at the<br />
entrance of the FRS. It then impinged on a 4.8 g<br />
cm 2 beryllium<br />
target at F2. The incident beam was identified using<br />
only the atomic mass obtained from the energy loss in a<br />
plastic scintillator in front of the target. The residues of the<br />
collision were identified using two scintillators at F3 which<br />
were used to measure the energy loss of the particles as<br />
well as their time of flight.<br />
TPCs and multiwire chambers at F2 and F3 were used to<br />
measure the positions of the ions, and to reconstruct their<br />
momentum distribution. The position distribution at F3<br />
was tracked back to the focal plane and is hence proportional<br />
to the parallel momentum. Since the FRS was used<br />
in a non-achromatic mode it was necessary to correct the<br />
momentum distribution of the reaction residues for the influence<br />
of the reactions in the production target. This was<br />
done by substracting the momentum spread of the incoming<br />
beam.<br />
The reaction cross section was measured to be σ = (2.89<br />
± 0.12) mb. Together with a theoretical cross section of<br />
4.55 mb [3] this corresponds to a reduction factor of Rs<br />
= 0.63 ± 0.03. The position distribution of the detected<br />
11 C at F3 is shown in figure 1. The function fitted to the<br />
experimental data is a convolution of a Gaussian with the<br />
response function of the spectrometer. The width of the<br />
momentum distribution of the reaction residues was found<br />
to be σp = (133 ± 7) MeV<br />
c . This corresponds well with a<br />
∗ Work supported in part by the <strong>GSI</strong> Research and Development Program<br />
(DA PIET) and by the BMBF (06DA9040I)<br />
200<br />
Figure 1: The position distribution at F3 for 9 C.<br />
knockout of two single, strongly bound nucleons and supports<br />
that the the two-neutron knockout 11 C proceeds as a<br />
completely direct reaction.<br />
Figure 2: The position distribution at F3 for 9 Be.<br />
The two-proton knockout from 11 C was also examined.<br />
Here a significant contribution from indirect reaction processes<br />
is expected. In agreement with this expectation, a<br />
significantly larger reaction cross section of σ = (8.36 ±<br />
0.41) mb was measured (preliminary). The position distribution<br />
of the detected 11 C at F3 is shown in figure 2.<br />
The width of the momentum distribution was found to be<br />
σp = (135 ± 8) MeV<br />
c .<br />
References<br />
[1] P.G. Hansen, J.A. Tostevin, Annu. Rev. Nucl. Part. Sci. 53<br />
(2003)<br />
[2] A. Gade et al., Phys. Rev. C 77 (2008)<br />
[3] J.A. Tostevin, private communication
<strong>GSI</strong> SCIENTIFIC REPORT 2009 NUSTAR-EXPERIMENTS-13<br />
Study of 27,28 Ne via one-neutron knockout reactions<br />
C. Rodríguez-Tajes ∗ for the S245 collaboration 1<br />
1USC (Spain), IEM CSIC (Spain), <strong>GSI</strong> (Germany), TUM (Germany), Chalmers (Sweden), CERN (Switzerland), Saint<br />
Mary’s (Canada)<br />
The proximity of neutron-rich neon isotopes to the island<br />
of inversion has motivated several experimental studies in<br />
the last years. The description of the results obtained for the<br />
most exotic nuclei requires SDPF-M calculations, which<br />
allow the mixing sd and pf configurations. This is the case<br />
for the 3/2− level of 27Ne at 765 keV and the first excited<br />
state of 28Ne, located at 1293 keV, with Iπ = 2 + . Experimental<br />
evidences that show the importance of intruder<br />
states in the ground-state configuration of 28Ne have also<br />
been found [1].<br />
In the work presented here, the ground state of 27,28Ne was<br />
explored by means of one-neutron knockout reactions in<br />
a beryllium target at relativistic energies. In the high energy<br />
regime, stripping reactions dominate the process and<br />
the measurement of the longitudinal-momentum distribution<br />
of the A-1 fragment can be used to identify the orbital<br />
angular momentum of the removed neutron inside the projectile.<br />
This interpretation assumes that the target is transparent<br />
to the A-1 fragment and is commonly known as the<br />
transparent limit of the Serber model [2].<br />
The experiment was performed in the Fragment Separator<br />
(FRS), at <strong>GSI</strong>. A fully ionised 40Ar primary beam was accelerated<br />
up to 700 MeV/nucleon and directed towards a<br />
beryllium target located at the entrance of the FRS, where<br />
a cocktail of exotic neutron-rich projectiles, with Z = 6-<br />
13 and N = 9-22, was produced via fragmentation reactions.<br />
The identification and selection of the projectiles<br />
were performed in the first stage of the FRS. Then, the<br />
one-neutron knockout reaction took place at the intermediate<br />
focal plane, in a 1720 mg/cm2 beryllium target, and<br />
the second part of the FRS was dedicated to the analysis of<br />
the resulting knockout fragments. The different detectors<br />
included in this experimental setup allowed a clean determination<br />
of the reaction channel, based on the identification<br />
of both the projectile and the A-1 fragment.<br />
The longitudinal-momentum distribution of the fragments<br />
was measured by Time Projection Chambers. The interpretation<br />
of this observable was carried out with the help<br />
of a simple theoretical model that takes into account the<br />
fact that only the outer part of the wave function is sampled<br />
with this technique by using the asymptotic form of the<br />
wave function and including a lower cut-off on the impact<br />
parameter [3]. The ground-state structure of the 27,28Ne projectiles was descibed as the contribution of two different<br />
core(I π , E) ⊗ neutron(l) configurations, where Iπ was used to fit the measured momentum distributions. The<br />
results obtained with this procedure are displayed in Fig. 1.<br />
A major l = 2 component was expected due to the population<br />
of the 0d3/2 neutron orbital at N = 17. However, the<br />
analysis of the momentum distributions clearly contradicts<br />
this hypothesis, showing that these nuclei are dominated by<br />
s1/2 neutrons coupled to an excited core. In particular, it<br />
was found that excited core states contribute with probabilities<br />
of 64 ± 12 and 81 ± 9 % to the ground state of<br />
and E<br />
refer to the spin-parity and to the excitation energy of the<br />
core and l is the orbital angular momentum of the copupled<br />
neutron. On this basis, an admixture of two different functions,<br />
each representing a core ⊗ neutron configuration,<br />
27Ne and 28Ne, respectively.<br />
−3<br />
× 10<br />
8<br />
27<br />
Ne<br />
6<br />
4<br />
2<br />
0<br />
−200 0 200<br />
p (MeV/c)<br />
||<br />
−3<br />
× 10<br />
10<br />
8<br />
28<br />
Ne<br />
6<br />
4<br />
2<br />
0<br />
−200 0 200<br />
p (MeV/c)<br />
||<br />
Figure 1: Inclusive momentum distribution of 26,27Ne after<br />
one-neutron knockout of 27,28Ne (normalised to unity).<br />
The solid lines represent the fit to the experimental data.<br />
The dotted (dashed) lines correspond to the calculated l =<br />
0 (l = 2) contributions.<br />
References<br />
[1] J. R. Terry et al., Phys. Lett. B 640 (2006) 86.<br />
[2] R. Serber, Phys. Rev. 72 (1947) 284.<br />
[3] M. Smedberg, PhD thesis, Chalmers tekniska höskola och<br />
Göteborgs universitet (1998).<br />
∗ carme.rodriguez@usc.es<br />
Counts (arb. units)<br />
Counts (arb. units)<br />
201
NUSTAR-EXPERIMENTS-14 <strong>GSI</strong> SCIENTIFIC REPORT 2009<br />
One-Neutron-Knockout Reactions on Scandium Isotopes ∗<br />
S. Schwertel † 1 , R. Gernhäuser 1 , P. Maierbeck 1 , R. Krücken 1 , T. Kröll 1 , H. Alvarez-Pol 2 , F. Aksouh 3 ,<br />
T. Aumann 3 , K. Behr 3 , E.A. Benjamim 2 , J. Benlliure 2 , V. Bildstein 1 , M. Böhmer 1 , K. Boretzky 3 ,<br />
M.J.G. Borge 4 , A. Brünle 3 , A. Bürger 5,6 , M. Caamano 2 , A. Chatillon 3 , L.V. Chulkov 3 ,<br />
D. Cortina-Gil 2 , J. Enders 7 , K. Eppinger 1 , T. Faestermann 1 , J. Friese 1 , L. Fabbietti 1 , M. Gascon 2 ,<br />
H. Geissel 3 , J. Gerl 3 , M. Gorska 3 , P.G. Hansen †8 , B. Jonson 9 , R. Kanungo 3,10 , O. Kiselev 3 ,<br />
I. Kojouharov 3 , A. Klimkiewicz 3 , T. Kurtukian 2 , N. Kurz 3 , K. Larsson 3,9 , T. Le Bleis 3 , K. Mahata 3 ,<br />
L. Maier 1 , T. Nilsson 7 , C. Nociforo 3 , G. Nyman 9 , C. Pascual-Izarra 4 , A. Perea 4 , D. Perez 2 ,<br />
A. Prochazka 3,11 , C. Rodríguez-Tajes 2 , D. Rossi 3,12 , H. Schaffner 3 , G. Schrieder 7 , H. Simon 3 ,<br />
B. Sitar 11 , M. Staniou 3 , K. Sümmerer 3 , O. Tengblad 4 , H. Weick 3 , and S. Winkler 1<br />
1 TU München, Physik-Department E12, Garching, Germany; 2 USC, Santiago de Compostela, Spain; 3 <strong>GSI</strong>, Darmstadt,<br />
Germany; 4 CSIC, Madrid, Spain; 5 CEA, Saclay, France; 6 ISKP, Bonn, Germany; 7 TU Darmstadt, Germany; 8 MSU,<br />
East Lansing, USA; 9 Chalmers University of Technology, Göteborg, Sweden; 10 St. Mary’s University, Halifax, Canada;<br />
11 Comenius University, Bratislava, Slovakia; 12 Johannes Gutenberg Universität, Mainz, Germany<br />
It is known for many years that the structure of nuclei far<br />
away from the valley of stability changes. E.g. there is a<br />
new shell closure predicted for N = 34 in 54 Ca [1]. In recent<br />
years knockout reactions have proven to be important tools<br />
for investigations of the structure of light exotic nuclei. An<br />
experiment extending this method to medium-mass nuclei<br />
with energies of about 400 MeV was performed with the<br />
fragment separator (FRS) at <strong>GSI</strong>.<br />
The FRS was operated in the dispersion matched mode<br />
where the dispersion of the first half is cancelled by the<br />
dispersion of the second half and the momentum transfer<br />
can be measured directly. A 500 AMeV 86 Kr beam<br />
was fragmented on a 1625 mg/cm 2 9 Be production target.<br />
The knockout target (1720 mg/cm 2 9 Be) was located at<br />
S2. Because of the high acceptance of the FRS, mother<br />
and daughter nuclei of one-neutron knockout reactions in<br />
the isotopes 51,52,53,54,55 Sc were transported with high efficiency.<br />
The fragments were identified before and after the<br />
knockout target. So the one-neutron-knockout reaction can<br />
be measured for each isotope.<br />
Entries / 40 MeV/c<br />
3500<br />
3000<br />
2500<br />
2000<br />
1500<br />
1000<br />
500<br />
mom_incl3<br />
Fit<br />
L = 3<br />
0<br />
53200 53400 53600 53800 54000 54200<br />
p [MeV/c]<br />
||<br />
Figure 1: Longitudinal momentum distribution of the reaction<br />
53Sc → 52Sc with a fit function and its contributions<br />
from different orbital angular momenta including the expected<br />
resolution.<br />
In 51,52,53,54,55Sc single neutrons will be knocked-out<br />
mostly from the f7/2, the p3/2, p1/2 ( 54,55Sc) or f5/2 orbitals.<br />
Fig. 1 shows the longitudinal momentum distribu-<br />
∗ Work supported by <strong>GSI</strong>, BMBF, DFG (Exc. Clust. 153-Universe),<br />
and EU (RII3-EURONS 506065)<br />
† sabine.schwertel@ph.tum.de<br />
202<br />
L = 1<br />
tion for the reaction 53 Sc → 52 Sc. The continous line is a<br />
fit, which consists of a L = 1 and a L = 3 part. In dashed<br />
and dotted these parts are shown according to their contribution<br />
to the fit. For this reaction an inclusive knockout<br />
cross section of 101(15) mbarn was determined with an assignment<br />
of 65(10) mbarn to L = 1 and 36(15) mbarn to<br />
L = 3. Fig. 2 shows the measured (stars) and calculated<br />
(squares) [2] inclusive cross sections for all isotopes (left)<br />
and for knockout of a L = 3 neutron (right).<br />
Cross section [mbarn]<br />
140<br />
Σ<br />
Theory<br />
Experiment<br />
120<br />
100<br />
80<br />
60<br />
40<br />
20<br />
0<br />
30 31 32 33 34<br />
N<br />
Cross section [mbarn]<br />
80<br />
70<br />
60<br />
50<br />
40<br />
30<br />
20<br />
10<br />
0<br />
L = 3<br />
Theory<br />
Experiment<br />
30 31 32 33 34<br />
N<br />
Figure 2: Knockout cross sections for one-neutron removal<br />
from L = 1 and L = 3 orbital (left) and from L = 3 orbital<br />
(right) vs. neutron number for experiment (stars) and theory<br />
(squares), respectively.<br />
The experimental and theoretical inclusive cross sections<br />
are consistent as well as the cross sections for knockout of<br />
a L = 1 neutron. For L = 3 neutrons we observe good agreement<br />
for 55 Sc and 54 Sc, but for the other isotopes there is<br />
a discrepancy of a factor of about two. A reason could be<br />
that the actual spectroscopic strength is different than expected<br />
from theory as collective excitations are not taken<br />
into account. This could lead to lower cross sections.<br />
The decrease of the L = 3 cross section for N = 34 shows<br />
that the f 5/2 orbital is relatively high above the p 1/2 orbital.<br />
This confirms that the residual interaction GXPF1A<br />
[3], which results in this orbital order and in a shell closure<br />
for this neutron number, describes the data very well<br />
confirming findings in different measurements [4].<br />
References<br />
[1] M.Honma et al., Phys. Rev. C 65, 061301,2002<br />
[2] T. Otsuka and J.A. Tostevin, private communication<br />
[3] T.Otsuka et al., Phys. Rev. Lett. 87,08502, 2001<br />
[4] P.Maierbeck, PhD Thesis, 2009
<strong>GSI</strong> SCIENTIFIC REPORT 2009 NUSTAR-EXPERIMENTS-15<br />
Electromagnetic Excitation of Neutron-Rich Ni Isotopes ∗<br />
T. Le Bleis 1,2,3 , D. Rossi 4 , P. Adrich 1 , F. Aksouh 1 , H. Alvarez-Pol 5 , T. Aumann 1 , J. Benlliure 5 ,<br />
M. Boehmer 6 , K. Boretzky 1 , E. Casarejos 5 , M. Chartier 7 , A. Chatillon 1 , D. Cortina-Gil 5 ,<br />
U. Datta Pramanik 8 , H. Emling 1 , O. Ershova 1,3 , B. Fernandez-Dominguez 7 , H. Geissel 1 , M. Gorska 1 ,<br />
M. Heil 1 , H. Johansson 1,9 , A. R. Junghans 10 , A. Klimkiewicz 1,11 , O. Kiselev 1,4 , J.V. Kratz 4 , N. Kurz 1 ,<br />
M. Labiche 12 , R. Lemmon 13 , Y. Litvinov 1 , K. Mahata 1 , P. Maierbeck 6 , T. Nilsson 9 , C. Nociforo 1 ,<br />
R. Palit 14 , S. Paschalis 7 , R. Plag 1,3 , R. Reifarth 1,3 , H. Simon 1 , K. Sümmerer 1 , A. Wagner 10 ,<br />
W. Walus 11 , H. Weick 1 , and M. Winkler 1<br />
1 <strong>GSI</strong>, Darmstadt, Germany; 2 IPHC, Strasbourg, France; 3 Univ. Frankfurt, Germany; 4 Univ. Mainz, Germany; 5 Univ.<br />
Santiago de Compostela, Spain; 6 TU Munich, Germany; 7 Univ. Liverpool, UK; 8 SINP Kolkata, India; 9 Chalmers<br />
Göteborg, Sweden; 10 FZ Dresden Rossendorf, Germany; 11 Jagiellonian Univ., Krakow, Poland; 12 Univ. Paisley, UK;<br />
13 Daresbury, UK; 14 TIFR Mumbai, India<br />
As a response to an external electromagnetic field, a<br />
nucleus can be collectively excited to a Giant-Resonance<br />
state. The Giant Resonances, and in particular the isovector<br />
Giant Dipole Resonance (GDR), have been extensively<br />
studied both theoretically and experimentally in stable nuclei.<br />
In the early 1990s, theoretical studies predicted the<br />
presence of low-lying dipole strength below the GDR region<br />
in isospin-asymmetric nuclei. This new dipole mode,<br />
usually referred to as Pygmy Dipole Resonance (PDR),<br />
has been attributed to the oscillation of a neutron- or a<br />
proton-skin against an isospin-saturated core [1]. More recently,<br />
experimental developments allowed the investigation<br />
of the dipole response of short-lived nuclei. In particular,<br />
neutron-rich Sn isotopes were studied using heavyion-induced<br />
electromagnetic excitation at relativistic energies<br />
in inverse kinematics at the LAND-R3B setup at <strong>GSI</strong>.<br />
The differential cross section dσ/dE∗ , which is obtained<br />
from invariant-mass reconstruction, shows the presence of<br />
low-lying strength in the dipole response that cannot be explained<br />
by the GDR alone, and which has been associated<br />
with the Pygmy Resonance mentioned above [2].<br />
In order to study the dipole response of neutron-rich Ni<br />
isotopes including 68Ni, a similar experiment has been performed<br />
by the LAND collaboration using the Coulomb<br />
excitation technique. The neutron-evaporation channels<br />
have been investigated and the strength distribution was<br />
obtained. Measurements were performed with three different<br />
targets (C, Sn and Pb) in order to distinguish electromagnetic<br />
and nuclear-induced excitations. A measurement<br />
without target yielded the background contribution.<br />
While electromagnetic excitation occurs at impact parameters<br />
larger than the sum of the radii of the colliding nuclei,<br />
the nuclear contribution stems from a narrow impactparameter<br />
range close to the grazing impact parameter bc.<br />
This determines the target dependence of the nuclear cross<br />
section σN scaling basically with the sum of the two radii,<br />
i.e., σN ∝ A 1/3<br />
T + A1/3<br />
P . In addition to this ’black-disc’ approach,<br />
we have considered a model taking into account the<br />
∗ This work is supported in part by BMBF grant 06MZ2221, by the<br />
HGF Young Investigators Project VH-NG-327, and by the Alliance Program<br />
of the Helmholtz Association (HA216/EMMI).<br />
transparency of the nuclei for an impact-parameter range<br />
∆b, yielding σN ∝ � bc − ∆b<br />
�<br />
2 ∆b. Here, we adopt the<br />
parametrization of bc based on empirical nuclear densities<br />
and Eikonal calculations, which has been checked against<br />
measured cross sections for electromagnetic dissociation of<br />
stable nuclei [3]. The charge dependence of the electromagnetic<br />
contribution σC ∝ Zα T was determined from a<br />
semi-classical calculation resulting in, e.g., α = 1.61(2)<br />
for the 1n cross section of 68Ni. Fits to the obtained cross<br />
sections with the three targets show that both models lead<br />
to the same results. It is then possible to determine the nuclear<br />
component of the interaction with Pb using the results<br />
P b<br />
obtained on C, e.g., σN = 1.57(20)σC for 68Ni. The preliminary analysis of both integrated and differential<br />
cross sections for electromagnetic dissociation of<br />
67−69Ni shows that the cross sections cannot be explained<br />
only by the excitation of the GDR with parameters from<br />
various systematics. In particular, a larger cross section<br />
in the low-energy part of the spectrum is observed, which<br />
can be described by the addition of extra dipole strength<br />
exhausting 5 to 10% of the energy-weighted sum rule.<br />
The comparison of our result, which refers to the dominant<br />
neutron-decay, with a recent (γ, γ ′ ) measurement for<br />
68Ni [4] yields a decay branching ratio of about 3% for the<br />
gamma back-decay of the Pygmy resonance in this nucleus.<br />
Although the analysis is still on-going, we can say in<br />
summary that evidence for the presence of a low-energy<br />
component in the dipole-strength distribution of neutronrich<br />
Ni isotopes has been obtained indicating, a systematic<br />
nature of the PDR mode.<br />
References<br />
[1] N. Paar et al., Rep. Prog. Phys. 70 (2007) 691 and references<br />
cited therein.<br />
[2] P. Adrich et al., Phys. Rev. Lett. 95 (2005) 132501.<br />
A. Klimkiewicz et al., Phys. Rev. C 76 (2007) 051603(R).<br />
[3] T. Aumann et al., Phys. Rev. C 51 (1995) 416; C.J. Benesh et<br />
al., Phys. Rev. C 40 (1989) 1198.<br />
[4] O. Wieland et al., Phys. Rev. Lett. 102 (2009) 062502.<br />
203
NUSTAR-EXPERIMENTS-16 <strong>GSI</strong> SCIENTIFIC REPORT 2009<br />
Gamow-Teller decay of the Ge nucleus<br />
E.Grodner 1,2 , A.Gadea 1,3 , A.Algora 3 , M.Gorska 4 , G de Angelis 1 , J.J.Valiente-Dobón 1 , J.Grebosz 4,5 ,<br />
P.Boutachkov 4 , L. Caceres 4 , S.Pietri 4 , Zs.Podolyak 6 , H.Weick 4 , J. Agramunt 3 , L. Amon 7 , E.<br />
Banioplu 7 , D. Bazzacco 8 , J. Benlliure 9 , G.Benzoni 10 , R. Burcu-Gakirli 7 , A. Bracco 10 , F.Camera 10 ,<br />
F.C.L.Crespi 10 , P. Doornenbal 4 , E.Farnea 8 , W. Gelletly 6 , H.Geissel 4 , J.Gerl 4 , T.Haberman 4 ,<br />
I.Kojouharov 4 , N.Kurz 4 , S.Leoni 10 , S.Lunardi 8 , D. Mengoni 8 , F. Molina 3 , A. Morales 9 , B.Million 10 ,<br />
D.R.Napoli 1 , R. Orlandi 1 , Y. Okten 7 , R. Page 11 , D. Perez 9 , F.Recchia 8 , P.Regan 7 , S. Rinta-Antila 11 ,<br />
B. Rubio 3 , D.Rudolph 12 , E.Sahin 1 , H.Schaffner 4 , B. S. Nara Singh 13 , A. N. Steer 13 , S.Verma 9 , R.<br />
Wadsworth 13 , O. Wieland 10 , and H-J.Wollersheim 4<br />
1 INFN-LNL, Legnaro, I; 2 University of Warsaw, Pl; 3 IFIC, CSIC - Uni. Valencia, E ; 4 <strong>GSI</strong>, Darmstadt, D; 5 IFJ PAN,<br />
Krakow, Pl; 6 Universiy of Surrey, Guildford, UK; 7 University of Istanbul, Tr; 8 Università and INFN Padova, I;<br />
9 University of Santiago de Compostela, E; 10 Università degli Studi e INFN sezione di Milano, I; 11 University of<br />
Liverpool, U.K; 12 Lund University, S; 13 University of York, U.K.<br />
The experiment to measure the -decay of was performed<br />
at <strong>GSI</strong> using the FRagment Separator (FRS) and<br />
the Rare Isotope Spectroscopic INvestigations at <strong>GSI</strong> (RIS-<br />
ING) setups [2, 1]. The fully stripped ions were produced<br />
by fragmentation of a beam with an energy of<br />
750 impinging on a production target with<br />
a thickness of 4.0 placed at the entrance position<br />
of the fragment separator FRS. The 750<br />
beam, provided by the <strong>GSI</strong> heavy-ion synchrotron SIS, had<br />
intensity about ions per spill. The spill period was<br />
thus providing an average primary beam intensity<br />
of ions/s. The reaction products were<br />
selected in the FRS. The various FRS scintillation time-offlight<br />
and ionization detectors were used to perform A and<br />
Z identification as well as position tracking for each individual<br />
ion [2]. At the final focal plane of FRS it was placed<br />
the RISING array in the stopped beam configuration [4]<br />
with the active implantation setup in the center of the array.<br />
RISING consist of 15 Cluster composite detectors [3] in<br />
this case mounted in a close configuration with an average<br />
distance from the centre of the implantation detector<br />
to the front face of the Cluster detectors [4]. For the present<br />
experiment an efficiency of about 9%, for the source<br />
transition, has been determined for the array. The<br />
active implantation setup for RISING [5] consisted on six<br />
thick double-sided silicon strip detectors (DSSSD).<br />
In a first step od data analysis the lifetime of Ge isotope<br />
has to be extracted. This can be done from the spectrum<br />
of beta activity as a function of time. Such a spectrum<br />
contains not only Ge Ga decay events but also<br />
the activity of Ga Zn transition making lifetime analysis<br />
difficult. To unbind the result from the decay of Ga<br />
daughter nucleus special beta activity spectrum was constructed.<br />
In this spectrum a time distribution of the first<br />
beta decay was collected if the second one was detected.<br />
In such a way the activity spectrum got clean (only Ge<br />
has double sequential decay) and contained only single<br />
exponential decay of the nucleus of interest. A lifetime<br />
of has been measured for the<br />
204<br />
Work supported by EU, EURONS contract No. 506065.<br />
ground state.<br />
GT transition from Ge leads to 1 states of Ga<br />
which then decay via gamma transitions to the ground state<br />
of Ga.The gamma spectrum was constructed from triple<br />
coincidences: FRS implantation - beta - gamma. A polygon<br />
gate on Z vs A/q spectrum from FRS was set in order to<br />
select the implantation of Ge nuclei only. Gamma quanta<br />
were registered when a beta decay was detected by silicon<br />
detectors in the given time limits after the implantation The<br />
resulting spectrum can be seen in Fig.1.<br />
Counts<br />
40<br />
30<br />
20<br />
10<br />
0<br />
15<br />
10<br />
5<br />
0<br />
511 keV<br />
571 keV<br />
978 keV<br />
1017 keV<br />
600 800 1000 1200 1400<br />
1600 1800 2000 2200 2400<br />
Energy (keV)<br />
Figure 1: Gamma-ray spectrum populated in the decay of<br />
Ge<br />
References<br />
[1] H. Wollersheim, et al., Nucl. Instr. and Meth. A537, 637<br />
(2004)<br />
[2] H. Geissel, et al., Nucl. Instr. and Meth. B70, 286 (1992);<br />
Ann. Rev. Nucl. Part. Sci. 45, 163 (1995).<br />
[3] J. Eberth, et al., Nucl. Instr. and Meth. A369, 135 (1996).<br />
[4] S. Pietri, et al., Acta Phys. Pol. 38, 1255 (2007); Nucl. Instr.<br />
and Meth. B261, 1079 (2007).<br />
[5] R. Kumar,et al., Nucl. Instr. and Meth. in press.<br />
2163 keV<br />
1247 keV<br />
2413 keV
<strong>GSI</strong> SCIENTIFIC REPORT 2009 NUSTAR-EXPERIMENTS-17<br />
News from the S352 experiment – Isomer spectroscopy of 96 Ag ∗<br />
P. Boutachkov 1 , M. Górska 1 , H. Grawe 1 , N. Braun 2 , T. Brock 3 , A. Blazhev 2 , B.S. Nara Singh 3 ,<br />
Z. Liu 4 , R. Wadsworth 3 , S. Pietri 1 , C. Domingo-Pardo 1 , S. Steer 5 , L. Cáceres 1 , T. Faestermann 6 ,<br />
F. Farinon 1 , N. Goel 1 , J. Gre¸bosz 7 , R. Hoischen 1,8 , I. Kojuharov 1 , N. Kurz 1 , C. Nociforo 1 ,<br />
J. Nyberg 9 , A. Prochazka 1 , Zs. Podolyák 5 , H. Schaffner 1 , P-A. Söderström 9 , H. Weick 1 , A. Ataç 10 ,<br />
L. Bettermann 2 , K. Eppinger 6 , T. Engert 1 , F. Finke 2 , K. Geibel 2 , J. Gerl 1 , A. Gottardo 4 , C. Hinke 6 ,<br />
G. Ilie 2 , H. Iwasaki 2 , J. Jolie 2 , R. Krücken 6 , E. Merchán 11 , M. Pfützner 12 , P. Regan 5 , P. Reiter 2 ,<br />
D. Rudolph 8 , S. Rinta-Antila 13 , C. Scholl 2 , N. Warr 2 , H-J. Wollersheim 1 , and P. Woods 4<br />
1 <strong>GSI</strong>, Darmstadt, Germany; 2 University of Cologne, Germany; 3 University of York, UK; 4 University of Edinburgh,<br />
UK; 5 University of Surrey, UK; 6 Technische Universität München, Germany; 7 IFJ PAN, Krakow, Poland; 8 Lund<br />
University, Sweden; 9 Uppsala University, Sweden; 10 Ankara University, Turkey; 11 Universidad Nacional de Colombia,<br />
Colombia; 12 Warsaw University, Poland; 13 University of Liverpool, UK<br />
The S352 experiment investigated isomeric and β decay<br />
of N ∼ Z Cd, Ag and Pd isotopes. This study provides<br />
information on the p-n interaction and the shell evolution<br />
around the N=Z=50 shell closure [1], and it can be used as<br />
a benchmark for large-scale shell-model calculations.<br />
The experiment was performed in July 2008 with the<br />
RISING stopped-beam setup [2, 3] at the <strong>GSI</strong>-FRS facility<br />
[4]. Fragmentation of 124 Xe on a 9 Be target was used<br />
to produce the nuclei of interest [5]. In Fig. 1 an identification<br />
plot, including the N=Z+2 nuclei 96 Ag, 98 Cd and<br />
94 Pd is shown. Preliminary results on 94 Pd and 98 Cd were<br />
reported in Refs. [6] and [7, 8], respectively. In this report<br />
we present new results on 96 Ag.<br />
In 96<br />
47 Ag49 a microsecond isomer and two γ-ray transitions<br />
from its decay were known [9]. The new data<br />
from the S352 experiment revealed three isomers, with life<br />
times ranging from hundreds of nanoseconds to tens of microseconds.<br />
These data extend the level scheme to highspin<br />
spherical structures, including core-excited states. The<br />
quality of the data allowed for γ − γ coincidence analysis,<br />
uniquely placing the observed transitions in the 96 Ag level<br />
scheme. A spectrum with γ-transitions depopulating the<br />
isomers in 96 Ag is shown in Figure 2.<br />
�<br />
��� ��<br />
��� ��<br />
��� ��<br />
���<br />
Figure 1: A Z vs A/Q identification plot of the nuclei under<br />
investigation in the S352 run. The 98 Cd, 96 Ag and 94 Pd<br />
nuclei are marked with red circles.<br />
∗ Work supported by BMBF 06KY205I and 06MT238 (Germany), by<br />
STFC (UK) and the Swedish Science Council.<br />
������<br />
������<br />
Figure 2: A preliminary γ-ray spectrum of the isomeric decays<br />
of 96 Ag fragments. The transitions marked with filled<br />
circles were observed for the first time in this experiment.<br />
The 470 and 668 keV transitions, marked with open circles<br />
were reported in Reference [9].<br />
In the reported measurement, only part of the approved<br />
beam time of the S352 experiment was completed. The<br />
remaining beam time will be devoted to the completion of<br />
the original goals of the experiment. The analysis of the<br />
data for further isomeric decays and β − γ correlations is<br />
currently in progress.<br />
References<br />
[1] H. Grawe et al., Eur. Phys. J A27, S01, (2006) 257.<br />
[2] S. Pietri et al., Nucl. Inst. and Meth. B261 (2007) 1079.<br />
[3] R. Kumar et al., Nucl. Inst. and Meth. A598 (2009) 754.<br />
[4] H. Geissel et al., Nucl. Instr. and Meth. B70 (1992) 286.<br />
[5] P. Boutachkov et al., <strong>GSI</strong> Scientific Report (2008) 149.<br />
[6] R. Wadsworth et al., Acta. Phys. Pol. B40 (2009) 611.<br />
[7] A. Blazhev et al., J. Phys.: Conf. Ser. (2010) in press.<br />
[8] A. Blazhev et al., this Scientific Report.<br />
[9] R. Grzywacz et al. Phys. Rev. C55 (1997) 1126.<br />
205
NUSTAR-EXPERIMENTS-18 <strong>GSI</strong> SCIENTIFIC REPORT 2009<br />
News from experiment S352 – Isomer spectroscopy of 98 Cd ∗<br />
A. Blazhev 1 , N. Braun 1 , H. Grawe 2 , P. Boutachkov 2 , B.S. Nara Singh 3 , T. Brock 3 , Z. Liu 4 ,<br />
R. Wadsworth 3 , M. Górska 2 , S. Pietri 2 , C. Domingo-Pardo 2 , I. Kojuharov 2 , L. Cáceres 2 , T. Engert 2 ,<br />
F. Farinon 2 , J. Gerl 2 , N. Goel 2 , J. Gre¸bosz 5 , R. Hoischen 2,6 , N. Kurz 2 , C. Nociforo 2 , A. Prochazka 2 ,<br />
H. Schaffner 2 , S. Steer 7 , H. Weick 2 , H-J. Wollersheim 2 , A. Ataç 8 , L. Bettermann 1 , K. Eppinger 9 ,<br />
F. Finke 1 , T. Faestermann 9 , K. Geibel 1 , A. Gottardo 4 , C. Hinke 9 , G. Ilie 1 , H. Iwasaki 1 , J. Jolie 1 ,<br />
R. Krücken 9 , E. Merchan 10 , F. Nowacki 11 , J. Nyberg 12 , M. Pfützner 13 , Zs. Podolyák 7 , P. Regan 7 ,<br />
P. Reiter 1 , D. Rudolph 6 , S. Rinta-Antila 14 , C. Scholl 1 , P-A. Söderström 12 , N. Warr 1 , and P. Woods 4<br />
1 University of Cologne, Germany; 2 <strong>GSI</strong>, Darmstadt, Germany; 3 University of York, UK; 4 University of Edinburgh,<br />
UK; 5 IFJ PAN, Krakow, Poland; 6 Lund University, Sweden; 7 University of Surrey, UK; 8 Ankara University, Turkey;<br />
9 Technical University of Munich, Germany; 10 Universidad Nacional de Colombia, Colombia; 11 IPHC, Strasbourg,<br />
France; 12 Uppsala University, Sweden; 13 Warsaw University, Poland; 14 University of Liverpool, UK<br />
Studies of isomerism in the neutron-deficient N ≃ Z<br />
nuclei around 100 Sn give important insights into the role of<br />
proton-neutron pairing, serve as testing grounds for nuclear<br />
models and give input for understanding the astrophysical<br />
rp-process [1]. In the S352 Stopped-RISING experiment<br />
the nuclei of interest were produced via the fragmentation<br />
of a 124 Xe beam on a 9 Be target, selected and identified<br />
by the FRS [2] and finally implanted into an active stopper<br />
[3]. The active stopper was surrounded by the highly<br />
efficient RISING Ge-array [4] and γ rays correlated with<br />
ion implantation and particle decays were collected.<br />
Although only half of the approved beam time was used,<br />
several new isomeric states and γ rays in different isotopes<br />
were discovered. Preliminary results on 94 Pd [5], 96 Ag [6]<br />
and 98 Cd [7] were already reported at some conferences.<br />
The preliminary results from the S352 experiment have<br />
revealed a new high-energy isomeric γ-ray transition in<br />
98 Cd, which confirmed previous spin-parity assignments<br />
and enabled, for the first time, the measurement of the E2<br />
and E4 strength for the two decay branches of the highenergy<br />
core-excited (12 + ) isomer [7, 8]. Figure 1 presents<br />
a γ-ray spectrum gated on implanted 98 Cd ions showing<br />
the new isomeric transition. Both the γ-γ-coincidence<br />
relations as well as the halflife suggest the existence of<br />
an alternative cascade (12 + ) → (10 + ) → (8 + ), with a<br />
(10 + ) state at 6585 keV, and an E2 character of the new<br />
4157 keV high-energy transition (Fig. 1) [7]. This also<br />
implies an experimentally non-observed 50 keV E2 isomeric<br />
transition depopulating the (12 + ) state and feeding<br />
the (10 + ) state [7]. With this assignment from the measured<br />
halflife and the observed branching the preliminary<br />
transition strengths B(E2; 12 + → 10 + ) = 2.1(13) W.u.<br />
and B(E4; 12 + → 8 + ) = 3.0(10) W.u. are inferred [7].<br />
The new experimental results on the (12 + ) and (10 + )<br />
states in 98 Cd reveal problems with previous large-scale<br />
shell-model calculations [8]. Currently, two possible microscopic<br />
explanations exist [7]. The first one requires a<br />
“reversed” ordering of the neutron d 5/2 and g 7/2 orbitals<br />
above the N = 50 shell gap, i.e. νd 5/2 lies higher than<br />
∗ Work supported by BMBF 06KY205I and 06MT238 (Germany), by<br />
STFC (UK) and the Swedish Science Council.<br />
206<br />
νg 7/2, while the second explanation needs an increased<br />
strength of proton particle-hole excitations across the Z =<br />
50 shell gap. Nuclear structure data on 98 Cd is thus of key<br />
importance since it allows the fine tuning of the effective<br />
interaction around the 100 Sn.<br />
The analysis of the data for further isomeric decays and<br />
β − γ correlations continues.<br />
3500<br />
3000<br />
2500<br />
2000<br />
1500<br />
1000<br />
500<br />
147<br />
+ +<br />
8 → 6<br />
198<br />
+ +<br />
6 → 4<br />
688<br />
+ +<br />
4 → 2<br />
1395<br />
+ +<br />
2 → 0<br />
0<br />
0 200 400 600 800 1000 1200 1400<br />
E[keV]<br />
100<br />
80<br />
60<br />
40<br />
20<br />
0<br />
4207-1022<br />
4207-511<br />
4157<br />
+ +<br />
10 → 8<br />
4207<br />
+ +<br />
12 → 8<br />
3200 3400 3600 3800 4000 4200<br />
*<br />
E[keV]<br />
Figure 1: Preliminary γ-ray spectrum gated on implanted<br />
98 Cd ions. The new transition is marked with an asterisk.<br />
References<br />
[1] H. Grawe et al., Eur. Phys. J A27, S01, (2006) 257.<br />
[2] H. Geissel et al., Nucl. Instr. and Meth. B70 (1992) 286.<br />
[3] R. Kumar et al., Nucl. Inst. and Meth. A598 (2009) 754.<br />
[4] S. Pietri et al., Nucl. Inst. and Meth. B261 (2007) 1079.<br />
[5] R. Wadsworth et al., Acta Phys. Pol. B40 (2009) 611.<br />
[6] P. Boutachkov et al., this scientific report, and in preparation.<br />
[7] A. Blazhev et al., J. Phys.: Conf. Ser. (2010) in press.<br />
[8] A. Blazhev et al., Phys. Rev. C69 (2004) 064304.
<strong>GSI</strong> SCIENTIFIC REPORT 2009 NUSTAR-EXPERIMENTS-19<br />
Decay Properties of 100 Sn *<br />
C.Hinke 1 , N.Al-Dahan 2 , N.Alkhomashi 2 , A.Atac 3 , A.Blazhev 4 , M.Böhmer 1 , P.Boutachkov 5 ,<br />
N.Braun 4 , L.Caceres 5 , I.�elikovi� 6 , T.Davinson 7 , G.deFrance 8 , I.Dillmann 1 , C.Domingo-Pardo 5 ,<br />
P.Doornenbal 9 , K.Eppinger 1 , T.Faestermann 1# , G.Farell 2 , F.Farinon 5 , H.Geissel 5 , J.Gerl 5 ,<br />
R.Gernhäuser 1 , N.Goel 5 , M.Górska 5 , A.Gottardo 7 , H.Grawe 5 , J.Gr�bosz 10 , T.Habermann 5 ,<br />
R.Hoischen 5 , R.Janik 11 , M.Karny 12 , A.Kaskas 3 , I.Kojouharov 5 , Th.Kröll 1 , R.Krücken 1 , N.Kurz 5 ,<br />
M.Lewitowicz 8 , Y.Litvinov 5 , Z.Liu 7 , L.Maier 1 , S.Myalski 10 , F. Nebel 1 , S.Nishimura 9 , C.Nociforo 5 ,<br />
J.Nyberg 13 , A.Parikh 1 , S.Pietri 2,5 , Zs.Podolyák 2 , A.Procházka 5 , P.H.Regan 2 , C.Rigollet 14 ,<br />
H.Schaffner 5 , C.Scheidenberger 5 , S.Schwertel 1 , P.-A.Söderström 13 , S.Steer 2 , K.Steiger 1 , A.Stolz 15 ,<br />
P.Strme� 11 , H.Weick 5 , H.J.Wollersheim 5 , P.J.Woods 7 , and the RISING collaboration<br />
1 TU München, 2 U of Surrey, 3 U of Ankara, 4 U of Köln, 5 <strong>GSI</strong> , 6 Inst. Vinca Belgrade, 7 U of Edinburgh, 8 GANIL,<br />
9 RIKEN, 10 IFJ PAN Krakow, 11 U of Bratislava, 12 U of Warsaw, 13 U of Uppsala, 14 KVI - U of Groningen, 15 MSU<br />
The analysis of the data obtained in 2008 [1] for neutron<br />
deficient nuclei produced by fragmentation of a 124 Xe<br />
beam has progressed. Here we concentrate on the decay<br />
properties of 100 Sn, of which we identified about 250 ions.<br />
The time distribution of decay events after 100 Sn implantation<br />
in the same or neighbouring of the 1mm 3 pixels<br />
of the implantation detector yielded a preliminary value<br />
for the half-life of 1.16(0.20)s. This is much more precise<br />
than earlier values measured at <strong>GSI</strong> [2,3] or at MSU [4].<br />
The �-decay of 100 Sn is supposed to populate essentially<br />
a single 1 + state in 100 In, that is formed by coupling<br />
the g9/2 proton hole to a g7/2 neutron particle. In order to<br />
determine the decay energy we had placed on either side<br />
of the implantation detector 10mm of Si detectors as calorimeter.<br />
For every decay event the energies deposited in<br />
the implantation and calorimeter detectors were summed<br />
up and yielded the spectrum shown in Fig. 1. Around 200<br />
keV there is a line originating presumably from a sum of<br />
converted transitions after electron capture decay. From<br />
the centroid of the energy distribution in the range indicated<br />
by the blue bar we determined a preliminary value<br />
for the endpoint energy of 3.15(20)MeV. There are still<br />
small corrections necessary for energy losses in the dead<br />
layers, but the quality of this result is very much improved<br />
compared to our earlier estimate based on 7 decays<br />
[2,3]. With the preliminary values for half-life and<br />
decay energy we calculate a log(ft) value of 2.54(20)<br />
<strong>GSI</strong>Template2007<br />
Fig. 1: �-spectrum of events following the implantation<br />
of identified 100 Sn nuclei. The red curve shows the calculated<br />
spectrum for an endpoint energy adjusted to<br />
have the same centroid as the measured spectrum in the<br />
range indicated by the blue bar.<br />
which is the smallest of all known �-decays and thus<br />
100 Sn shows the largest transition strength. The Gamov-<br />
Teller strength BGT=11(4) shows a reduction by only a<br />
factor 1.6 compared to the value from the extreme singleparticle<br />
model, where 10 protons contribute to the decay.<br />
With the 105 Ge-detectors of the RISING setup we<br />
measured with high efficiency for the first time the �spectrum<br />
after �-decay of 100 Sn, which is shown in Fig. 2.<br />
Besides the annihilation radiation we observe 5 lines after<br />
feeding the 1 + daughter state(s) in 100 In. Shell model calculations<br />
predict a cascade of �-transitions down to the 6 +<br />
ground-state, but whether the observed �-lines are all in<br />
cascade or in parallel branches, we cannot decide yet.<br />
Fig. 2: �-spectrum of events following the �-decay of<br />
identified 100 Sn nuclei. The low-energy part is shown<br />
enlarged in the inset.<br />
References<br />
[1] K. Eppinger et al., <strong>GSI</strong> Scientific Report 2008, p.147<br />
[2] J. Friese, Proc. Hirschegg 1996, p. 123<br />
[3] A. Stolz et al., AIP Conf. Proc. 610 (2002) 728<br />
and T. Faestermann et al., EPJA15 (2002) 185<br />
[4] D. Bazin et al., PRL 101 (2008) 252501<br />
* work supported by MLL, BMBF, DFG, <strong>GSI</strong>, EPSRC,<br />
STFC(UK), and EURONS<br />
# thomas.faestermann@ph.tum.de<br />
207
NUSTAR-EXPERIMENTS-20 <strong>GSI</strong> SCIENTIFIC REPORT 2009<br />
Structure of excited states of 127 Cd<br />
F. Naqvi 1,2 , M. Górska 2 , L. Cáceres 2,3 , A. Jungclaus 3 , M. Pfützner 4 , H. Grawe 2 , F. Nowacki 5 ,<br />
K. Sieja 5 , S. Pietri 2 , P.H Regan 6 , D. Rudolf 7 , Z. Podolyák 6 , J. Jolie 1 , K. Andgren 8 , T. Beck 2 ,<br />
P. Bednarczyk 2,9 , J. Benlliure 10 , G. Benzoni 11 , A.M Bruce 12 , E. Casarejos 10 , B. Cederwall 8 ,<br />
F. Crespi 11 , P. Detistov 13 , Zs. Dombrádi 14 , P. Doornenbal 2 , H. Geissel 2 , J. Gerl 2 , J. Grebosz 2,9 ,<br />
B. Hadinia 8 , M. Hellström 7 , R. Hoischen 2,7 , G. Ille 1 , A. Khaplanov 8 , I. Kojouharov 2 , M. Kmiecik 9 ,<br />
R. Kumar 15 , N. Kurz 2 , S. Lalkovski 12,13 , A. Maj 9 , S. Mandal 16 , V. Modamio 3 , F. Montes 2 ,<br />
S. Myalski 9 , W. Prokopowicz 2 , P. Rieter 1 , H. Schaffner 2 , G. Simpson 17 , D. Sohler 14 , S.J Steer 6 ,<br />
S. Tashenov 2 , J. Walker 3 , H.J Wollersheim 2 , and O. Wieland 11<br />
1 2 Institut <strong>für</strong> Kernphysik, Universität zu Köln, D-50937 Köln, Germany; Gesselschaft <strong>für</strong> <strong>Schwerionenforschung</strong>(<strong>GSI</strong>),<br />
D-64291 Darmstadt, Germany; 3Departmento de fisica Teórica, Universidad Autónoma de Madrid, E-28049 Madrid,<br />
Spain; 4IEP, Warsaw University, PL-00681 Warsaw, Poland; 5IReS, IN2P3-CNRS/University Louis<br />
Pasteur,F-67037,Strasbourg,France; 6Department of Physics, University of Surrey, Guildford, Gu2 7XH, UK;<br />
7 8 Department of Physics, Lund University, S-22100 Lund, Sweden; KTH Stockholm,S-10691 Stockholm, Sweden;<br />
9 10 The Henryk Niewodniczański Institute of Nuclear Physics, PL-31342 Kraków, Poland; Universidad de Santiago de<br />
Compostela, E-175706 Santiago de Campostela, Spain; 11INFN, Universitadegli Studi di Milano and INFN Sezione di<br />
Milano, I-20133 Milano, Italy; 12School of Enigineering, University of Brighton, Brighton, Bn2 4GJ, UK; 13Faculty of<br />
Physics, University of Sofia, Bg-1164, Sofia, Bulgaria; 14Institute National Polytechnique de Grenoble, F-98026<br />
Grenoble Cedex, France; 15Inter University Accelerator Centre, New Delhi, India; 16University of Delhi,New Delhi,<br />
India; 17Institut Laue-Langevin, F-38042 Grenoble, France<br />
The region around doubly magic 132 Sn has attracted intense<br />
research interest because of several features. Few valence<br />
particles/holes outside the inert core make the nuclei<br />
good candidates for studying the shell structure and<br />
residual interactions between valence nucleons in neutron<br />
rich environment. The astrophysical r-process, responsible<br />
for synthesizing heavy neutron rich nuclei in nature, follows<br />
a path along the N = 82 line up to Z = 50. To test<br />
the theoretical models explaining the r-process in this region,<br />
experimental data on the evolution of N = 82 nuclei<br />
is crucial. Therefore recently, several even mass Cd isotopes<br />
were investigated. To complete the systematics for<br />
odd heavy Cd isotopes, a detailed examination of data from<br />
the RISING experimental campaign using relativistic fragmentation<br />
of a 136 Xe beam performed at the FRagment<br />
Separator (FRS) at <strong>GSI</strong> was done.<br />
Ions of 127 Cd were selected and identified in the FRS<br />
and were implanted in a plastic catcher, surrounded by a<br />
close geometry of 15 Ge cluster detectors from the RISING<br />
array. A single γ - ray spectrum containing five γ transitions<br />
at energies between 110 and 849 keV assigned to the<br />
decay of the isomer in 127 Cd is shown in Fig. 1.<br />
Coincidence relations of observed γ transitions and intensity<br />
balance yielded the level scheme for 127Cd as<br />
shown in Fig. 2. Spins and parities of the excited states<br />
were determined based on reduced transition probabilities<br />
and comparison with the systematics of known neighbouring<br />
odd-mass heavy Sn isotopes [1] . The isomerism in<br />
127Cd is attributed to a competition between M2 and E3<br />
transitions from the (19/2 + ) state, formed from the coupling<br />
of πg −2<br />
9/2 and νh−2<br />
11/2d−1 3/2 . Comparison of experimental<br />
data with large scale shell model (LSSM)[2] and shell<br />
model (SM) calculations was performed . The discrepancy<br />
208<br />
visible in the sequence of the (13/2 − ) and (15/2 − ) states<br />
is due to a deficiency in the quadrupole part of the interaction.<br />
Further details on experiment, analysis and interpretation<br />
will be given in the forthcoming paper[3].<br />
Counts/keV<br />
1300<br />
1100<br />
900<br />
700<br />
500<br />
300<br />
100<br />
*<br />
*<br />
200 600 1000 1400<br />
Energy [keV]<br />
Figure 1: Single gamma ray energy spectrum of 127 Cd.<br />
1508 19/2 +<br />
1694 27/2 –<br />
1580 19/2 –<br />
1585 15/2 +<br />
1689 23/2 +<br />
1809 23/2 –<br />
849 15/2 –<br />
874 13/2 –<br />
0 11/2 –<br />
LSSM<br />
1560 (19/2 + )<br />
1603 15/2 +<br />
1966 17/2 +<br />
1644 19/2 –<br />
1927 23/2 –<br />
1946 23/2 +<br />
2025 27/2 –<br />
1549 19/2 +<br />
739<br />
711 (13/2 – 821 (15/2<br />
)<br />
– 110<br />
)<br />
821<br />
849<br />
711<br />
0 (11/2 – )<br />
EX<br />
127Cd<br />
48 79<br />
*<br />
1055 13/2 –<br />
887 15/2 –<br />
0 11/2 –<br />
SM<br />
Figure 2: Level schemes of 127 Cd determined experimentally<br />
and calculated with LSSM and SM.<br />
References<br />
[1] R. Lozeva et al., Phys. Rev. C77, 064313 (2008).<br />
[2] K. Sieja et al., to be published.<br />
[3] F. Naqvi et al in preperation.
<strong>GSI</strong> SCIENTIFIC REPORT 2009 NUSTAR-EXPERIMENTS-21<br />
Isomeric states in 128 Cd<br />
L. Cáceres 1,2 , M. Górska 1 , A. Jungclaus 2,3 , M. Pfützner 4 , H. Grawe 1 , F. Nowacki 5 , K. Sieja 1 ,<br />
S. Pietri 6 , D. Rudolph 7 , Zs. Podolyák 6 , P. H. Regan 6 , E. Werner-Malento 1,4 , P. Detistov 8 ,<br />
S. Lalkovski 8,9 , V. Modamio 2 , J. Walker 2 , K. Andgren 10 , P. Bednarczyk 1,11 , J. Benlliure 12 ,<br />
G. Benzoni 13 , A. M. Bruce 9 , E. Casarejos 12 , B. Cederwall 10 , F. C. L. Crespi 13 , P. Doornenbal 1,14 ,<br />
H. Geissel 1 , J. Gerl 1 , J. Gre¸bosz 1,11 , B. Hadinia 10 , M. Hellström 7 , R. Hoischen 1,7 , G. Ilie 14,15 ,<br />
A. Khaplanov 10 , M. Kmiecik 11 , I. Kojouharov 1 , R. Kumar 16 , N. Kurz 1 , A. Maj 11 , S. Mandal 17 ,<br />
F. Montes 1 , G. Martínez-Pinedo 1 , S. Myalski 11 , W. Prokopowicz 1 , H. Schaffner 1 , G. S. Simpson 18 ,<br />
S.J. Steer 6 , S. Tashenov 1 , O. Wieland 13 , and H. J. Wollersheim 1<br />
1 2 4 <strong>GSI</strong>, Darmstadt, Germany; Departamento de Física Teórica, Universidad Autónoma de Madrid, Madrid, Spain; IEP,<br />
Warsaw University, Warsaw, Poland; 5IReS, IN2P3-CNRS/University Louis Pasteur, Strasbourg, France; 6Department of Physics, University of Surrey, Guildford, GU2 7XH, UK; 7Department of Physics, Lund University, S-22100 Lund,<br />
Sweden; 8Faculty of Physics, University of Sofia, Sofia, Bulgaria; 9School of Engineering, University of Brighton,<br />
Brighton, BN2 4GJ, UK; 10KTH Stockholm, Stockholm, Sweden; 11The Henryk Niewodniczański Institute of Nuclear<br />
Physics, PL-31342 Kraków, Poland; 12Universidade de Santiago de Compostela, Santiago de Compostela, Spain;<br />
13 14 INFN, Universitádegli Studi di Milano and INFN sezione di Milano, Milano, Italy; Institut <strong>für</strong> Kernphysik,<br />
Universität zu Köln, Köln, Germany; 15National Institute of Physics and Nuclear Engineering, Bucharest, Romania;<br />
16 17 18 Inter University Accelerator Centre, New Delhi, India; University of Delhi, New Delhi, India; LPSC, Université<br />
Joseph Fourier Grenoble 1, CNRS/IN2P3, Institut National Polytechnique de Grenoble, F-38026 Grenoble Cedex,<br />
France<br />
The flattening of the yrast 2 + state systemactics from<br />
N = 78 to N = 80 in the Cd isotopic chain has awaken<br />
the interest of both experimentalists and theoreticians. Previous<br />
experimental results [1] suggest that the anomalous<br />
behavior of the E(2 + ) excitation energies could have its<br />
origin on the persistence of some collectivity in those very<br />
neutron-rich Cd nuclei approaching the neutron shell closure.<br />
Recent results based on isomeric decays studies in<br />
130 Cd [2] and 131 In [3] have concluded the persistence of<br />
the N = 82 shell gap at Z = 48. Although the production<br />
cross section for 128 Cd, two-proton holes and twoneutron<br />
holes with respect to 132 Sn, is larger than the previously<br />
mentioned nuclei, its structural characteristic remained<br />
unknown up to date. In the S305 experiment performed<br />
within the RISING stopped beam campaign the decay<br />
pattern of 128 Cd has been unambiguously constructed<br />
based on γγ coincidence relations in conjunction with halflife<br />
analysis. The nucleus of interest was produced both<br />
by fragmentation of 136 Xe and fission of 238 U beams on<br />
a 9 Be target. In total 3.29 × 10 5 128 Cd nuclei were identified.<br />
The high efficiency and granularity of the RISING<br />
HpGe array in combination with the particle detection provided<br />
by the FRagment Separator at <strong>GSI</strong> allowed to measure<br />
γ rays with 1% intensity of the main cascade crucial<br />
to unambiguously establish the decay pattern associated<br />
to 128 Cd. Three isomeric states have been identified<br />
at 1871 keV, 2108 KeV and 2714 KeV excitation energies.<br />
The spin and parity assignment to the levels is based on<br />
the electromagnetic transition probabilities, relative intensity<br />
balance, and inferred conversion coefficients. The experimental<br />
data indicates that the isomeric decay pattern is<br />
selective to the structure of the populated states and their<br />
leading π or ν configuration. This conclusion is further<br />
supported by comparison to large scale shell model calculations<br />
that yield an overall good agreement and additionally<br />
strengthen the spin and parity assignment. The deviation<br />
in level energies between experiment and shell model at intermediate<br />
spins reveal the need for further adjustment of<br />
the interaction that could be achieved by minor monopole<br />
corrections [4]. Further details of this work can be found<br />
in Ref. [5]<br />
T 1/2 ( μ s)<br />
3.56(6) (10 )<br />
(8 ) 69<br />
2714<br />
2646<br />
(450)<br />
538<br />
(6 ) (2195)<br />
0.012(2) (7 ) 2108<br />
0.270(7) (5 ) 238(765)<br />
1871<br />
440<br />
4<br />
1430<br />
1224<br />
785<br />
2 646<br />
0<br />
646<br />
0<br />
8<br />
2184<br />
8<br />
10 2684<br />
2<br />
1<br />
6<br />
2616<br />
2446<br />
7<br />
5<br />
4<br />
2 828<br />
0 0<br />
1830<br />
1790<br />
1660<br />
Figure 1: Comparison of the deduced experimental level<br />
scheme for the isomeric decay of 128 Cd (left) with shell<br />
model calculations (right).<br />
References<br />
[1] T. Kautzsch et al., Eur. Phys. J. A 9, 201 (2000).<br />
[2] A. Jungclaus et al., Phys. Rev. Lett. 99, 132501 (2007).<br />
[3] M. Górska et al., Phys. Lett. B 672, (2009).<br />
[4] K. Sieja et al., unpublised.<br />
[5] L. Cáceres et al., Phys. Rev. C 79, 011301(R) (2009).<br />
209
NUSTAR-EXPERIMENTS-22 <strong>GSI</strong> SCIENTIFIC REPORT 2009<br />
MC Simulations for the PreSPEC campaign of AGATA at <strong>GSI</strong><br />
C. Domingo-Pardo 1 , P. Doornenbal 2 , E. Farnea 3 , J. Gerl 1 , E. Merchan 1 , and M. Reese 4<br />
1 <strong>GSI</strong>, Darmstadt, Germany; 2 RIKEN, Japan; 3 LNL, Legnaro, Italy; 4 TU-Darmstadt, Germany; 1<br />
Introduction<br />
The next campaign of in-flight γ-ray spectroscopy experiments<br />
at the <strong>GSI</strong> Fragment Separator (FRS) will be<br />
performed, in the framework of the PreSPEC project [1],<br />
using the advanced γ-tracking array AGATA [2].<br />
In order to exploit best its γ-efficiency and high intrinsic<br />
energy- and spatial-resolution, the geometry and the physical<br />
arrangement of this multidetector needs to be optimized<br />
according to the characteristics of the ion beam at the final<br />
focal plane of the FRS. To this aim we have performed systematic<br />
Monte Carlo calculations using the GEANT4-based<br />
AGATA code [3].<br />
One of the main experimental constraints is the transversal<br />
spatial distribution of the FRS ion beam at the focal<br />
plane (approx. 6 × 4 cm 2 FWHM). Thus, the secondary<br />
beam covers an area larger than the standard AGATA pentagon<br />
holes, commonly used for the beam-pipe at other facilities<br />
like LNL [4]. According to our MC calculations,<br />
it became clear that a remarkable improvement in γ-ray<br />
sensitivity can be achieved for the setup at <strong>GSI</strong> when the<br />
standard AGATA triple cluster detectors are complemented<br />
with double cluster detectors (see Fig. 1). This conclusion<br />
has triggered the development and production of 5 AGATA<br />
double cluster detectors, which will be used for the experiments<br />
at <strong>GSI</strong>, and probably also later at GANIL.<br />
Figure 1: AGATA geometry proposed for the next fastbeam<br />
campaign at <strong>GSI</strong>. It consists of an inner ring of 5<br />
double cluster plus an outer ring of 10 triple cluster AGATA<br />
detectors.<br />
Estimated performance of AGATA at <strong>GSI</strong><br />
The performance of this setup has been evaluated on<br />
the basis of a MC study, where 1 MeV γ-rays were emitted<br />
from a nucleus at a recoil energy of ∼100 MeV/u or<br />
β = 0.43. A systematic study was carried out for different<br />
target-array distances in the range from 0 cm to 25 cm.<br />
For each particular experiment, the latter distance can be<br />
adjusted in such a way that efficiencies from 10% to 18%<br />
210<br />
and the AGATA and PRESPEC collaboration<br />
and γ-ray resolutions between 5 keV and 10 keV FWHM<br />
can be obtained. Such a performance corresponds to more<br />
than one order of magnitude improvement in terms of γ-ray<br />
sensitivity, when compared to the present existing RISING<br />
array based on Euroball cluster detectors.<br />
Benchmark experiments<br />
In PreSPEC, experiments with exotic nuclei will be carried<br />
out at beam energies around 100 MeV/u. The performance<br />
of the proposed AGATA geometry for a real experiment<br />
can be evaluated using the AGATA code [4] complemented<br />
with an Event-Generator [5] and a ROOT-based<br />
analysis code. Simulations of three representative types of<br />
experiments are being carried out, namely Coulomb excitation,<br />
fragmentation and plunger [6] lifetime measurements.<br />
The example shown in Fig. 2 corresponds to the simulation<br />
of the first excited states in 50 Fe produced after fragmentation<br />
of a 54 Ni-beam impinging at 120 MeV/u on a<br />
700 mg/cm 2 Be-target.<br />
Counts<br />
Counts<br />
60<br />
40<br />
20<br />
400<br />
200<br />
400 600 800 1000 1200 1400 1600 1800<br />
addback<br />
Edep<br />
(keV)<br />
400 600 800 1000 1200 1400 1600 1800<br />
addback+DopplerCorr.<br />
E<br />
(keV)<br />
Figure 2: Raw (top) and Doppler-Corrected (bottom) γ-ray<br />
energy spectrum of the first excited states in 50 Fe.<br />
References<br />
[1] Gerl, J. March 2009 Acta Physica Polonica B 40, 767.<br />
[2] J. Gerl, W. Korten (Eds.) AGATA Technical report <strong>GSI</strong>,<br />
Darmstadt (2001).<br />
[3] Farnea, E. August 2006 volume 853, of American Institute of<br />
Physics Conference Series : pp. 473–478.<br />
[4] Farnea, E. August 2009 volume 1165, of American Institute<br />
of Physics Conference Series : pp. 390–393.<br />
[5] Doornenbal P., Short Manual of a Geant4 Simulation Code<br />
for γ-Ray Detectors used in the RIKEN-RIBF Facility<br />
(2009).<br />
[6] M. Reese, Simulations of PreSPEC Plunger experiments,<br />
AGATA Week, Legnaro (2010).<br />
dep<br />
hEdep<br />
Entries 26126<br />
Mean 1031<br />
RMS 395.7<br />
h2<br />
Entries 26126<br />
Mean 926<br />
RMS 357.9
<strong>GSI</strong> SCIENTIFIC REPORT 2009 NUSTAR-EXPERIMENTS-23<br />
The HypHI Phase 0 experiment ∗<br />
T.R. Saito † 1,2 , S. Bianchin 1 , O. Borodina 1,2 , V. Bozkurt 1,3 , B. Göküzüm 1,3 , M. Kavatsyuk 4 , E. Kim 1,5 ,<br />
S. Minami 1 , D. Nakajima 1,6 , B. Özel-Tashenov 1,3 , C. Rappold 1,7 , P. Achenbach 2 , S. Ajimura 8 , T.<br />
Aumann 1 , C. Caesar 1 , S. Erturk 3 , T. Fukuda 9 , E. Guliev 4 , Y. Hayashi 10 , T. Hiraiwa 10 , J. Hoffmann 1 ,<br />
G. Ickert 1 , Z.S. Ketenci 3 , D. Khaneft 1,2 , M. Kim 5 , S. Kim 5 , K. Koch 1 , N. Kurz 1 , Y. Ma 2,11 , F.<br />
Maas 1,2 , Y. Mizoi 9 , M. Moritsu 10 , T. Nagae 10 , A. Okamura 10 , W. Ott 1 , J. Pochodzalla 2 ,<br />
A.Sakaguchi 12 , M. Sako 10 , C.J. Schmidt 1 , M. Sekimoto 13 , H. Simon 1 , H. Sugimura 10 , T.<br />
Takahashi 13 , G.J. Tambave 4 , K. Tanida 5 , H. Tamura 11 , M. Träger 1 , W. Trautmann 1 , S. Voltz 1 , C.J.<br />
Yoon 5 , and K. Yoshida 12<br />
1 <strong>GSI</strong>,Darmstadt, Germany; 2 Johannes Gutenberg Universität Mainz, Mainz, Germany; 3 Nigde University, Nigde,<br />
Turkey; 4 KVI, Groningen, The Netherlands; 5 Seoul National University, Seoul, Korea; 6 The University of Tokyo,<br />
Tokyo, Japan; 7 Université Louis Pasteur Strasbourg, Strasbourg, France; 8 RCNP, Ibaraki, Japan; 9 Osaka<br />
Electro-Communication University, Osaka, Japan; 10 Kyoto University, Kyoto, Japan; 11 Tohoku University, Sendai,<br />
Japan; 12 Osaka University, Toyonaka, Japan; 13 KEK, Tsukuba, Japan<br />
The HypHI collaboration has conducted the first physics<br />
production experiment, so called ”Phase 0” in cave C. In<br />
the experiment, projectiles of 6 Li at 2 A GeV with an intensity<br />
in average of 5×10 7 per spill (10 s spill length) were<br />
impinged in a graphite target with a thickness of 8 g/cm 2 .<br />
The Phase 0 experiment was divided into two <strong>block</strong>s; three<br />
days in August for commissioning and 11 days in October<br />
for data taking. The main goal of the experiment is to<br />
reconstruct events of light hypernuclei as 3 Λ H→3 He+π − ,<br />
4<br />
Λ H→4 He+π − and 5 Λ He→4 He+π − +p.<br />
Figure 1: Experimental setup for the Phase 0 experiment<br />
Figure 1 shows a schematic layout of the experimental<br />
setup for the October run. Beams are delivered from the<br />
left side of the figure. In front of the target, an array of<br />
plastic finger detectors, TOF-start, measures the projectiles<br />
and defines time-zero for the Time-of-Flight (TOF)<br />
measurements /cite. Behind the target, three arrays of<br />
scintillating fiber detectors (TR0, 1 and 2) were used to<br />
track charged particles in the horizontal and vertical directions<br />
[2, 3]. Between TR1 and TR2, a drift chamber<br />
was mounted for tracking charged particles. Since the drift<br />
∗ The HypHI project is supported by the Helmholtz Association as<br />
Helmholtz University Young Investigators Group VH-NG-239 and by<br />
DFG with the research grant SA 1696/1-1.<br />
† t.saito@gsi.de<br />
chamber can not operate under the high beam intensity<br />
conditions, a beam killer has been developed by wrapping<br />
sense wires by teflon sheets around the beam region [4].<br />
Behind these detectors, charged particles are separated by<br />
ALADiN dipole magnet at 0.75 T. Time and hit position<br />
of positively charged particles were measured by a TOF<br />
wall indicated as TOF+, and negatively charged particles<br />
dominated π − are measured by two additional TOF walls<br />
referred as TFW and the ALADiN TOF wall [1]. Behind<br />
the ALADiN magnet, there is another drift chamber for<br />
tracking charged particles. For this drift chamber, a beam<br />
killer has also been implemented by connecting potential<br />
and sense wires around the beam region [4].<br />
In the trigger level to the data acquisition system, events<br />
with secondary vertex events observed by the scintillating<br />
fiber detectors, positively charged particles with Z = 1 and<br />
2 by TOF+, and negatively charged particles by TFW were<br />
selected in order to reduce the background events. Details<br />
of the trigger are found in ref. [5].<br />
Data analysis is in progress. The current data analysis<br />
algorithm employes Hough transform and Kalman filter for<br />
the track finding and propagation [6]. Preliminary analyses<br />
have already revealed indications of Λ-hyperons and 5 Λ He<br />
[7, 8].<br />
References<br />
[1] S. Bianchin, O. Borodina, V. Bozkurt et al., in these reports.<br />
[2] D. Nakajima, B. Özel-Tashenov et al., Nucl. Inst. Meth. A<br />
608 (2009) 287-290.<br />
[3] D. Nakajima, B. Özel-Tashenov et al., in these reports.<br />
[4] E .Kim, D. Nakajima, B. Özel-Tashenov et al., in these reports.<br />
[5] S .Minami, C. Rappold et al., in these reports.<br />
[6] C. Rappold et al., in these reports.<br />
[7] C. Rappold, Ph.D. thesis, Strasbourg University.<br />
[8] D. Nakajima, Ph.D. thesis, Tokyo University.<br />
211
NUSTAR-EXPERIMENTS-24 <strong>GSI</strong> SCIENTIFIC REPORT 2009<br />
The HypHI project at <strong>GSI</strong> and FAIR: Genfit package for track fitting in the<br />
hypernuclei event reconstruction analysis<br />
C.Rappold ∗1,2 , S. Bianchin 1 , O. Borodina 1,3 , V. Bozkurt 1 , B. Göküzüm 1 , M. Kavatsyuk 4 , E. Kim 1 , F.<br />
Maas 1,3 , S. Minami 1 , D. Nakajima 1,5,6 , B. Özel-Tashenov 1 , T.R. Saito 1,3 , and W. Trautmann 1<br />
1 <strong>GSI</strong>, Darmstadt, Germany; 2 Université de Strasbourg, Strasbourg, France; 3 Mainz University, Mainz, Germany;<br />
4 KVI, Groningen, The Netherlands; 5 KEK, Tsukuba, Japan; 6 Tokyo University, Tokyo, Japan<br />
The HypHI project aims to study hypernuclei by means<br />
of collisions of stable heavy ion and RI beams on stable<br />
target materials. As the first step (Phase 0), the feasibility<br />
of hypernuclear spectroscopy with heavy ion beams will<br />
be demonstrated with a 6Li beam at 2 A GeV impinged on<br />
a 12 C target by identifying 3 Λ H, 4 Λ H and 5 Λ<br />
He hypernuclei<br />
from their mesonic decay modes. The Phase 0 experiment<br />
was performed in August and October 2009 [2].<br />
A dedicated event reconstruction analysis has been developed<br />
in order to reconstruct hypernucleus event from<br />
the obtained data. The four-momentum of each particle is<br />
calculated by finding and fitting each possible tracks from<br />
hits collected by the tracker system [3, 4] and PID system<br />
[5]. The invariant mass method and vertex reconstruction<br />
of interested hypernuclei is performed from their respective<br />
daughter particles. Each daughter candidate is selected<br />
from the goodness of the track fitting.<br />
A new step has been included in the track reconstruction<br />
after the satisfied implementation of track finding [6]. Possible<br />
track found by the Hough transform across the full<br />
setup is fitted with a Kalman Filter algorithm. The implementation<br />
of the algorithm has been initially based on the<br />
Genfit package provided in the PandaROOT framework.<br />
Several modifications have done to handle experimental<br />
data and the specificity of the setup of Phase 0 experiment.<br />
One of the main change includes a new propagation algorithm<br />
: a track propagation in non-homogeneous magnetic<br />
field by a analytic formula for track extrapolation [7].The<br />
new implementation of the full reconstruction analysis with<br />
the track fitting algorithm gives us the opportunity to select<br />
the goodness of the tracking within a high confidence level.<br />
The reconstruction of hypernuclei from Monte Carlo<br />
simulations has been studied with the full event reconstruction<br />
analysis. Monte Carlo simulations have been based on<br />
a UrQMD event generator and the GEANT4 framework.<br />
20000 3 Λ H, 4 Λ H and 5 Λ<br />
He hypernucleus with their associated<br />
background particles from the production reaction have<br />
been used. For the background, firstly 20 million background<br />
events representing primary reaction which does<br />
not lead to any strangeness production have been used to<br />
simulate the primary reaction. This background represents<br />
∼1b reaction cross section, from which all other simulation<br />
results have been scaled. Secondly, the background<br />
associating free Λ production with other possible Z=2 projectile<br />
fragments is the most crucial background since those<br />
212<br />
∗ c.rappold@gsi.de<br />
Figure 1: Invariant mass of 4 Λ<br />
the background contribution while in red the 4 Λ<br />
H within 95 % CL. In blue :<br />
H signal.<br />
events behave like hydrogen hypernuclei if the proton from<br />
the free Λ decay is missing.<br />
Those three different inputs have been analyzed and the<br />
resulting invariant mass of 4 Λ<br />
H from all input has been<br />
scaled to each other to match the expected cross section difference.<br />
The figure 1 is showing this scaled invariant mass<br />
spectrum, with two color codes separating the background<br />
from the signal. It shows a clear separation between background<br />
(in blue) and the hypernuclei signal (in red). The<br />
full background from primary reactions is completely rejected<br />
thanks to a secondary vertex selection. Only the free<br />
Λ background is contributing to the background shown in<br />
blue. The invariant mass resolution obtained in this way is<br />
2.07 MeV for 4 Λ H. All other interested hypernuclei, 3 Λ<br />
5<br />
Λ<br />
He have been also studied in the same procedure.<br />
References<br />
H and<br />
[1] Proposal of the HypHI Phase 0 experiment, the HypHI collaboration.<br />
[2] T.R. Saito et. al., in these Scientific Reports.<br />
[3] D. Nakajima et. al., in these Scientific Reports.<br />
[4] E .Kim et. al., in these Scientific Reports.<br />
[5] S. Bianchin et. al., in these Scientific Reports.<br />
[6] C. Rappold et. al., <strong>GSI</strong> Scientific Report 2008, <strong>GSI</strong>, Darmstadt,<br />
2008, p. 53.<br />
[7] S. Gorbunov, I. Kisel, Analytic formula for track extrapolation<br />
in non-homogeneous magnetic field. Nucl. Instr. Meth.<br />
A 559 (2006) 148-152
<strong>GSI</strong> SCIENTIFIC REPORT 2009 NUSTAR-EXPERIMENTS-25<br />
213
NUSTAR-EXPERIMENTS-26 <strong>GSI</strong> SCIENTIFIC REPORT 2009<br />
Consistency of results from single- and many-ion lifetime spectroscopy<br />
N. Winckler 1,2 , F. Bosch 1 , H. Geissel 1 , C. Kozhuharov 1 , Yu. A. Litvinov 1,2 , and Z. Patyk 3<br />
1 <strong>GSI</strong>, Darmstadt; 2 MPI-K, Heidelberg; 3 Soltan Institute for Nuclear Studies, Warsaw<br />
Orbital electron capture decay of H-like 142 Pm and 140 Pr<br />
ions has been studied in ESR experiments at <strong>GSI</strong>. The experiments<br />
have been carried out in two modes. One of them<br />
was to store a large number of parent ions and to monitor<br />
continuously the number of parent and daughter ions. The<br />
other way was to inject on average 2 parent ions. In this<br />
way the decay times of each ion could be accurately determined.<br />
While the decay curves, measured with many parent<br />
ions, follow the expected exponential behavior [2, 3], a<br />
modulated in time exponential decay [1] has been observed<br />
in single-ion experiments . In this report we show that these<br />
results are consistent. Let us assume that the number of<br />
stored parent ions at time t, NM (t), decreases at a rate:<br />
dNM (t)<br />
dt<br />
where the total decay rate � λ is the sum:<br />
= − � λ · NM (t) (1)<br />
�λ = λβ + λEC(1 + a cos(ωt + φ)) + λloss<br />
The solution of equation (1) is:<br />
NM (t) = NM (0) · exp [−λt(1 + aλEC<br />
λ<br />
(2)<br />
· sin(ωt+φ)<br />
ωt )] (3)<br />
where λ = λβ + λEC + λloss. In the case of nonmodulated<br />
EC-decay rate (a = 0) we find the usual solution:<br />
N 0 M (t) = NM (0) · exp [−λt] The number of stored<br />
parent ions NM (t) and N 0 M (t) as well as the diference<br />
N 0 M (t) − NM (t) are plotted in Fig. 1 using the experimental<br />
parameters as the example of 142Pm [1, 3]. We note<br />
that the relative change has an upper bound:<br />
�<br />
�<br />
�<br />
N<br />
�<br />
0 M (t) − NM (t)<br />
N 0 M (t)<br />
�<br />
� aλEC �<br />
� ≤ ≈ 0.001 (4)<br />
ω<br />
which clearly shows that a modulated decay term leads to<br />
a per mille effect in the evolution of the number of stored<br />
parent ions. Within experimental error bars, it is clear that<br />
oscillation cannot be seen in multi-ions experiments.<br />
Similarly, the variation dND(t)/dt for the daughter ions<br />
(see Fig. 2) can be written as follows:<br />
dND(t)<br />
dt = λEC(1 + a cos(ωt))NM (t) − λlossND(t) (5)<br />
The solution of this differential equation is the sum of<br />
the solution of the homogeneous differential equation,<br />
ND(t) = ND(0)e −λlosst , with the particular solution<br />
to the inhomogeneous equation, ND(t) = F (t)e −λlosst ,<br />
which is derived by mean of the ”constant variation”<br />
method. One shows that, using the approximation<br />
≪ 1, the solution of eq. (5) is:<br />
aλEC<br />
λ<br />
214<br />
sin(ωt)<br />
ωt<br />
Figure 1: Decay curves of parent ions NM (t) and N 0 M (t)<br />
and their difference as a function of time. The curve with<br />
the modulation term, NM (t), can hardly be distinguished<br />
from the one without modulation, N 0 M (t).<br />
ND(t) =<br />
λEC<br />
λ−λloss (e−λlosst −λt − e )NM (0) (6)<br />
+ ND(0)e −λlosst<br />
+ aλEC[ ω sin(ωt)−(λ−λloss) cos(ωt)<br />
ω2 +(λ−λloss) 2 ]NM (0)e−λt +<br />
aλEC(λ−λloss)<br />
ω 2 +(λ−λloss) 2 NM (0)e −λlosst<br />
Figure 2: Growth curves of daughter ions and difference<br />
with respect to the solution with a = 0 as a function of<br />
time. The fit parameters were taken from [1, 3]. We also<br />
assumed NM (0) = 100 and ND(0) = 0.<br />
It is therefore clear that within the achieved experimental<br />
error bars, it was not possible to observe the modulation in<br />
the many-ion experiments.<br />
References<br />
[1] Y. A. Litvinov et al., Phys. Lett. B664, 162 (2008).<br />
[2] Yu. Litvinov et al., Phys. Rev. Lett. 99, 262501 (2007).<br />
[3] N. Winckler et al., Phys. Lett. B679, 36 (2009).
<strong>GSI</strong> SCIENTIFIC REPORT 2009 NUSTAR-EXPERIMENTS-27<br />
<strong>GSI</strong>Template2007<br />
Schottky Measurements of Stored Hafnium and Tantalum Isomers<br />
M.W. Reed 1 , P.M. Walker 1 , K. Blaum 2 , F. Bosch 3 , C. Brandau 4 , J.J. Carroll 5 , D.M. Cullen 6 , I.J. Cullen<br />
1 , A.Y. Deo 1 , B. Detwiller 5 , C. Dimopoulou 3 , F. Farinon 3 , H. Geissel 3,8 , E. Haettner 8 , M. Heil 3 ,<br />
R.S. Kempley 1 , R. Knöbel 3 , C. Kozhuharov 3 , J. Kurcewicz 3 , N. Kuzminchuk 8 , S. Litvinov 3 , Yu.A.<br />
Litvinov 2,3 , Z. Liu 7 , R. Mao 9 , C. Nociforo 3 , F. Nolden 3 , W.R. Plass 8 , A. Prochazka 3 , C. Scheidenberger<br />
3,8 , M. Steck 3 , T. Stöhlker 3 , B. Sun 3 , T.D. Swan 1 , G. Trees 5 , H. Weick 3 , N. Winckler 3 , M.<br />
Winkler 3 , P.J. Woods 7 and T. Yamaguchi 10<br />
1 Surrey Univ., 2 MPI Heidelberg, 3 <strong>GSI</strong> Darmstadt, 4 TU Munich, 5 Youngstown State Univ., 6 Manchester Univ.,<br />
7 Edinburgh Univ., 8 Giessen Univ., 9 IMPCAS Lanzhou, 10 Saitama Univ.<br />
Projectile fragmentation produces highly charged ions<br />
which can be selected by the <strong>GSI</strong> Fragment Separator,<br />
injected into the Experimental Storage Ring (ESR) and<br />
electron cooled. A Schottky pickup in the ESR enables<br />
single-ion identification, with a mass/energy uncertainty<br />
of less than 50 keV. This capability has been exploited for<br />
isomer discoveries. For example, a new isomer at 103±12<br />
keV in 125 Ce has been found with the ESR [1].<br />
We now report new isomers observed in 184 Hf and<br />
187 Ta. Figure 1 shows A = 184 (q = 72+) and A = 187 (q =<br />
73+) spectra selected from a series of injections into the<br />
ESR, following the fragmentation of 197 Au beam particles.<br />
184 Hf and 187 Ta are each seen to have two isomers, at<br />
excitation energies of about 1.5 and 2.5 MeV, in addition<br />
to their ground states and some known isobars.<br />
While the first hafnium isomer, 184m1 Hf, was already<br />
known [2], with T1/2 = 48 s, its confirmation is non-trivial<br />
since, in the ISOL experiment [2], it could have been confused<br />
with 184 Lu β decay. The second isomer, 184m2 Hf, is<br />
observed for the first time, as are both the 187 Ta isomers.<br />
All three new isomers have half-lives of minutes or<br />
longer. An important feature of the ESR method is that<br />
there is no upper-limit on the isomer half-life (in contrast<br />
to measurements that rely on decay radiations). Furthermore,<br />
it is notable that, with bare hafnium (72+) and tantalum<br />
(73+) ions, there is no ambiguity between the isomeric<br />
states and the less-bound isobars (lutetium and hafnium,<br />
respectively) since they cannot exist in the required<br />
charge states.<br />
The excitation energy of the 184m2 Hf isomer matches<br />
well with the prediction of a spin-17 four-quasiparticle<br />
state [3]. This gives improved confidence that 186 Hf and<br />
188 Hf will also have long-lived isomers, as predicted [3].<br />
The m1 and m2 tantalum isomers are interpreted as three-<br />
and five-quasiparticle states respectively, and their excitation<br />
energies agree with model calculations. We also note<br />
that the mass and half-life of the 187 Ta ground state are<br />
obtained for the first time. Furthermore, the general quality<br />
of the data illustrates clearly the well-known feature<br />
that the Schottky analysis method requires only a single<br />
unknown ion in the ESR for positive identification, providing<br />
the mass calibration can be established from<br />
known ions.<br />
With half-lives of minutes or longer, there is a strong<br />
possibility of β decay from the four- and five-<br />
quasiparticle isomers. Taking into account also their low<br />
production rates, these isomers probably could not have<br />
been uniquely identified in any other way than as stored<br />
bare ions.<br />
Schottky signal (arbitrary units)<br />
184 Hf<br />
72+<br />
m2<br />
m1<br />
g Ta<br />
187 Ta<br />
73+<br />
m2<br />
m1<br />
g W Re<br />
70.3 70.5 70.7 44.8 45.0 45.2 45.4<br />
frequency (kHz)<br />
Figure 1: Examples of Schottky spectra for A = 184 and<br />
187 isobars and isomers, for a variety of different injections<br />
in the ESR. All the illustrated isomer data correspond<br />
to single ions. (The A = 184 and 187 vertical scales<br />
differ significantly, to accommodate the multiple-ion<br />
peaks for A = 187 ground states.)<br />
These new data establish that the existence of longlived<br />
hafnium and tantalum isomers extends well into the<br />
neutron-rich domain. The data complement γ-ray measurements<br />
of shorter-lived A ~ 190 isomers [4], and open<br />
up to more detailed study a predicted region [5] of shape<br />
instability between well-deformed prolate and oblate collective<br />
rotation.<br />
References<br />
[1] B. Sun et al., Eur. Phys. J. A31 (2007) 393.<br />
[2] K. Krumbholz et al., Zeit. Phys. A351 (1995) 11.<br />
[3] P.M. Walker, G.D. Dracoulis, Nature 399 (1999) 35.<br />
[4] N. Alkhomashi et al., Phys. Rev. C80, 064308 (2009).<br />
[5] F.R. Xu et al., Phys. Rev. C62, 014301 (2000).<br />
215
NUSTAR-EXPERIMENTS-28 <strong>GSI</strong> SCIENTIFIC REPORT 2009<br />
Ru(p, ) Rh measurement at the <strong>GSI</strong> storage ring<br />
T. Aumann 1 , S. Bishop 3 , K. Blaum 9 , K. Boretzky 1 , F. Bosch 1 , H. Bräuning 1 , C. Brandau 1,3 ,<br />
T. Davinson 4 , I. Dillmann 3 , O. Ershova 1,5 , H. Geissel 1 , G. Gyürky 6 , M. Heil 1 , F. Käppeler 7 ,<br />
A. Kelić 1 , C. Kozhuharov 1 , C. Langer 1,5 , T. Le Bleis 1,5,10 , Y. A. Litvinov 1,9 , G. Lotay 3 ,<br />
J. Marganiec 1 , N. Petridis 5 , R. Plag 1,5 , U. Popp 1 , R. Reifarth 1,5 , B. Riese 1 , C. Rigollet 8 ,<br />
C. Scheidenberger 1 , H. Simon 1 , T. Stöhlker 1 , T. Szücs 6 , G. Weber 1 , H. Weick 1 , D. F. A. Winters 1 ,<br />
N. Winters 1 , P. J. Woods 4 , and Q. Zhong 1,2<br />
1 <strong>GSI</strong> <strong>Helmholtzzentrum</strong> <strong>für</strong> <strong>Schwerionenforschung</strong> GmbH, Darmstadt, 64291, Germany; 2 China Institute of Atomic<br />
Energy (CIAE) 102413 Beijing China; 3 Technische Universität München, 85748 Garching, Germany ; 4 University of<br />
Edinburgh, Edinburgh, UK; 5 J.W. Goethe Universität, Frankfurt a.M, 60438, Germany; 6 Institute of Nuclear Research<br />
of the Hungarian Academy of Sciences, Hungary; 7 KIT Forschungszentrum Karlsruhe, Institut <strong>für</strong> Kernphysik,<br />
Karlsruhe, Germany; 8 Kernfysisch Versneller Instituut, Netherlands; 9 Max-Planck-Institut <strong>für</strong> Kernphysik, 69117<br />
Heidelberg, Germany; 10 Institut Pluridisciplinaire Hubert Curien, Strasbourg, France<br />
Introduction<br />
The nucleosynthesis of elements beyond iron is dominated<br />
by neutron captures in the s and r processes [1].<br />
However, 32 stable, proton-rich nuclides between Se and<br />
Hg cannot be formed during those processes, because<br />
they are shielded from the s-process flow and r-process -<br />
decay chains. These nuclei are thought to be produced in<br />
the p process, where proton-rich nuclei are made by sequences<br />
of photodisintegrations and proton captures reactions<br />
and following decays on existing r- and s-seed nuclei.<br />
Rate predictions for the (p, ) and ( , ) reactions are<br />
very difficult since only a handful of experimental data for<br />
stable isotopes have been determined in the Gamow window<br />
of the p process so far.<br />
Cross-section measurements on (p, ) and ( , ) reactions<br />
in the astrophysically interesting energy range are already<br />
very challenging on stable nuclei. Only a minute part<br />
of the nuclei involved in p-process networks, however, is<br />
stable. The majority of the isotopes crucial for the final pabundance<br />
are unstable. The most promising approach to<br />
determine the desired reaction rates is to produce the isotopes<br />
at Radioactive Ion Beam facilities and to investigate<br />
the reactions in inverse kinematics.<br />
In order to prove the principle of this approach, an<br />
experiment was performed at the Experimental Storage<br />
Ring (ESR) at the <strong>GSI</strong> <strong>Helmholtzzentrum</strong> <strong>für</strong> <strong>Schwerionenforschung</strong><br />
GmbH.<br />
Experiment and preliminary results<br />
The pioneering experiment was performed at the Experimental<br />
Storage Ring (ESR) at <strong>GSI</strong>. Fully stripped ions<br />
of Ru were injected into the storage ring and slowed<br />
down to 9-11 MeV per nucleon. The Rh ions following<br />
the Ru(p, ) reaction at a cryogenically cooled liquid<br />
microjet hydrogen target were detected with Double<br />
Work supported by the HGF Young Investigators Projects VH-NG-<br />
327 and VH-NG-331 and the ERC grant no. 203175.<br />
r.reifarth@gsi.de<br />
216<br />
Sided Silicon Strip Detectors (DSSSD) mounted inside a<br />
pocket. We could prove the feasibility of this approach and<br />
clearly detected events originating from proton captures<br />
on Ru (see Figure 1). The analysis is still in progress,<br />
but the preliminary results show that the cross section at<br />
11 MeV, is only slightly above the prediction from the<br />
NON-SMOKER code. The detailed analysis will eventually<br />
include a simulation of all beam line components and<br />
reaction channels. It will also be extended down to 10 and<br />
9 MeV.<br />
COUNTS<br />
3000<br />
2500<br />
2000<br />
1500<br />
1000<br />
500<br />
Data<br />
p,g<br />
sum<br />
3.89959e+07<br />
p,a<br />
background<br />
total<br />
Entries<br />
Mean 66.22<br />
RMS 31.46<br />
0<br />
0 20 40 60 80 100 120 140 160 180<br />
X-POSITION (mm)<br />
Figure 1: A fit of the experimental data neglecting the (p,n)<br />
component. The position of the primary beam is at -40 mm.<br />
References<br />
[1] E. Burbidge, G. Burbidge, W. Fowler and F. Hoyle, Rev.<br />
Mod. Phys. 29 (1957) 547
<strong>GSI</strong> SCIENTIFIC REPORT 2009 NUSTAR-EXPERIMENTS-29<br />
Direct Observation of Bound-State β − Decay of Fully Ionized 205 Hg<br />
J. Kurcewicz 1 , F. Bosch 1 , H. Geissel 1,2 , Yu. A. Litvinov 1,2 , K. Beckert 1 , P. Beller 1 , D. Boutin 1,2 ,<br />
C. Brandau 1 , L. Chen 1,2 , T. Faestermann 3 , B. Franzke 1 , M. Hausmann 4 , P. Kienle 3,5 , O. Klepper 1 ,<br />
R. Knöbel 1,2 , C. Kozhuharov 1 , S. A. Litvinov 1,2 , L. Maier 3 , M. Mazzocco 1 , F. Montes 1 ,<br />
A. Musumarra 6 , C. Nociforo 1 , F. Nolden 1 , W. R. Plaß 1,2 , C. Scheidenberger 1,2 , M. Steck 1 , B. Sun 1 ,<br />
K. Takahashi 7 , H. Weick 1 , N. Winckler 1,2 , and M. Winkler 1<br />
1 <strong>GSI</strong>, Darmstadt, Germany; 2 JLU, Gießen, Germany; 3 TUM, München, Germany; 4 MSU, East Lansing, U.S.A.;<br />
5 SMIsP, Vienna, Austria; 6 LNS, Catania, Italy; 7 ULB, Brussels, Belgium<br />
The β − decay to an electronic bound state in the daughter<br />
atom, accompanied by the emission of a monoenergetic<br />
neutrino was first observed at <strong>GSI</strong> in 1992 [1], more than 40<br />
years after its theoretical prediction [2]. This phenomenon<br />
of minor importance for neutral atoms, might become a<br />
strong decay channel for highly ionized atoms in stellar<br />
environments. Thus the heavily altered nuclear half-lives<br />
might have a large impact on the path of the nucleosynthesis<br />
process. Here we report on the direct observation of the<br />
bound-state β − decay of fully ionized 205 Hg.<br />
The experiment was performed at the SIS synchrotron of<br />
<strong>GSI</strong> Darmstadt, which delivered a 750 A GeV 208 Pb beam<br />
with an intensity of the order of 10 9 ions/spill. The ions of<br />
interest 205 Hg 80+ were produced in the projectile fragmentation.<br />
The 4 g/cm 2 thick beryllium target was placed at the<br />
entrance of the projectile Fragment Separator (FRS). The<br />
205 Hg were selected by passing the magnetic sections of<br />
the separator and injected into the ESR storage ring, where<br />
they could remain for extended periods of time circulating<br />
with a revolution frequency of the order of 2 MHz. Both,<br />
stochastic and electron cooling were applied in order to decrease<br />
the velocity spread of the circulating ions.<br />
The beamline of the ESR is equipped with a set of Schottky<br />
noise probes which collect the mirror charge of each<br />
passing ion, thus providing the information about its revolution<br />
frequency. The 30th harmonic of the noise signal<br />
generated in the Schottky pick-up electrodes was amplified<br />
and mixed down with a local oscillator providing<br />
a reference frequency. The difference signal in the frequency<br />
range of 0-300 kHz was digitized by using a 16-bit<br />
ADC and a Fast Fourier Transformation was applied to the<br />
data yielding revolution frequency spectra of the coasting<br />
ions. Analyzing the frequency peaks present in the subsequently<br />
accumulated Schottky spectra, a time distribution<br />
of the number of the bare Hg and the βb-decay daughter Tl<br />
ions stored in the ESR was constructed. In general the time<br />
evolution of the number of ions of mother activity can be<br />
described by the following expression<br />
Nm(t) = Nm(0)e −λt , (1)<br />
where Nm(0) is the number of stored mother ions at the<br />
beginning of the measurement and λ = λβb + λβc + λloss is<br />
the decay constant consisting of components corresponding<br />
to continuum-state, bound-state β − -decay and nonradioactive<br />
losses in the ring, respectively. In case of the<br />
daughter activity the number of stored ions is given by<br />
Nd(t) = Nm(0) λβb � −λlosst −λt<br />
e −e<br />
λ − λloss<br />
� +Nd(0)e −λlosst ,<br />
(2)<br />
where Nd(0) is the number of daughter ions at the beginning<br />
of the measurement. Several measurements of the<br />
decay constant have been performed showing overall consistent<br />
results. The results of the analysis of the Schottky<br />
power noise spectra are shown in Fig. 1. The obtained time<br />
evolution of the number of mother and daughter ions was<br />
fitted separately for each of performed measurements using<br />
Eq.(1) and (2), respectively.<br />
Intensity [arb. units]<br />
2<br />
10<br />
10<br />
205 80+<br />
Hg<br />
205 80+<br />
Tl<br />
0 200 400 600 800 1000 1200 1400 1600 1800 2000<br />
t [s]<br />
Figure 1: Time distribution of the peak intensity corresponding<br />
to number of stored 205 Hg 80+ and 205 Tl 80+ ions.<br />
The continuous line shows the fitted theoretical dependence<br />
given by Eqs. (1) and (2).<br />
The average decay rates for bound and continuum state<br />
β − decay are λβb = 3.7(3) · 10−4 s −1 and λβc =<br />
1.69(14) · 10 −3 s −1 , respectively. The experimental val-<br />
ues of the decay constant indicate an overall good agree-<br />
ment with the theoretical prediction λth βb = 3.21·10−4 s−1 ,<br />
λth βc = 2.21 · 10−3 s−1 [3], however, showing a lower λβc<br />
value. The aforementioned result of calculation has been<br />
confirmed by a recent theoretical work which provides<br />
for bare 205Hg80+ the continuous β−-decay rate value of<br />
λβc = 2.34 · 10−3 s [4].<br />
References<br />
[1] M. Jung et al., Phys. Rev. Lett. 69 (1992) 2164<br />
[2] R. Daudel et al., Jour. de Phys. Rad. 8 (1947) 238<br />
[3] K. Takahashi et al., Phys. Rev. C36 (1987) 1522<br />
[4] M. Faber et al., Phys. Rev. C78 (2008) 061603(R)<br />
217
NUSTAR-EXPERIMENTS-30 <strong>GSI</strong> SCIENTIFIC REPORT 2009<br />
Direct Measurement of the 4.6 MeV Isomer in Stored Bare 133 Sb Ions<br />
B. Sun 1,2 , R. Knöbel 3 , H. Geissel 1,3 , Yu. A. Litvinov 3,4 , P. M. Walker 5 , K. Blaum 4 , F. Bosch 3 ,<br />
D. Boutin 3 , C. Brandau 3 , L. Chen 1 , I. J. Cullen 5 , A. Dolinskii 3 , B. Fabian 1 , M. Hausmann 6 ,<br />
C. Kozhuharov 3 , J. Kurcewicz 3 , S. A. Litvinov 3 , Z. Liu 7 , M. Mazzocco 8 , J. Meng 2 , F. Montes 6 ,<br />
G. Münzenberg 3 , A. Musumarra 9 , S. Nakajima 10 , C. Nociforo 3 , F. Nolden 3 , T. Ohtsubo 11 ,<br />
A. Ozawa 12 , Z. Patyk 13 , W. R. Plaß 1,3 , C. Scheidenberger 1,3 , M. Steck 3 , T. Suzuki 10 , H. Weick 3 ,<br />
N. Winckler 3 , M. Winkler 3 , and T. Yamaguchi 10<br />
1 JLU Giessen, Germany; 2 Beihang Univ., Beijing, China; 3 <strong>GSI</strong>, Darmstadt, Germany; 4 MPI-K, Heidelberg, Germany;<br />
5 Surrey Univ., Guildford, U.K.; 6 MSU, East Lansing, U.S.A; 7 Edinburgh Univ., Edinburgh, U.K.; 8 INFN Padova,<br />
Italy; 9 INFN Catania, Italy; 10 Saitama Univ., Japan; 11 Niigata Univ., Japan; 12 Tsukuba Univ., Japan; 13 SINS, Poland<br />
Isomer investigations were performed recently with<br />
stored ions in cooled storage rings and Penning traps,<br />
e.g. with excitation energies of 103(12) keV (T 1/2 > 1<br />
s) in 125 Ce [1], and of 402(5) keV (T 1/2 > 150 ms)<br />
in 65 Fe [2]. The present work applies a novel method,<br />
namely, isochronous mass spectrometry [3], to measure<br />
mass-resolved nuclear isomers with lifetime down to a few<br />
tens of µs. The excitation energy and survival time of the<br />
isomer in 133 Sb are determined based on precise revolution<br />
time measurements of a few individually stored ions.<br />
g.s.<br />
i.s.<br />
4560(100)<br />
Figure 1: Part of the revolution-time spectrum including<br />
the 133 Sb ions in the ground and isomeric states. The identified<br />
ions with well-known masses are indicated in the<br />
spectrum. The final mass distribution for both states in the<br />
off-line analysis are shown as an inset.<br />
In the measurement [4], neutron-rich exotic nuclei were<br />
produced by projectile fission of 411 MeV·A 238 U ions<br />
in a 1 g/cm 2 Be target placed at the entrance of the FRS.<br />
The energy of the primary beam was chosen such that the<br />
energy of 133 Sn 50+ fragments corresponded to the relativistic<br />
Lorentz factor γ=1.41 which matches exactly the<br />
isochronous condition of the ESR. The intensity of the primary<br />
beam was about 2 · 10 9 particles per spill. The fission<br />
fragments emerged from the target mainly as bare ions. Under<br />
this condition the observed half-lives of nuclear isomeric<br />
states can be much longer if the electron conversion<br />
branch is suppressed [5]. In principle, this presents the possibility<br />
to observe bare isomers with lifetimes that would be<br />
even shorter than µs in the corresponding neutral atoms.<br />
218<br />
n<br />
The uranium fission products were then separated in<br />
flight according to their magnetic rigidity and injected into<br />
the ESR. The magnetic-rigidity of the fission fragments has<br />
been determined at the focal plane S2 of the FRS, which<br />
defines precisely the velocity spread (∆v/v) of fragments<br />
to about 10 −4 [6]. Each measurement cycle was 1 ms long<br />
which corresponded to about 2000 revolutions of the ions<br />
in the ESR. On average there was about one stored ion per<br />
injection. More than 13000 independent injections were<br />
made over four days.<br />
Both the ground state and the isomeric state in 133 Sb<br />
have been produced. Due to different rest masses, they<br />
were well resolved in the experiment via the difference in<br />
their revolution times (see Figure 1). The excitation energy<br />
of 4.56(10) MeV is determined experimentally for the first<br />
time as a complement to gamma-ray experiments [7]. The<br />
survival half-live in the centre-of-mass frame of 58 +47<br />
−18 µs<br />
(1σ) enables us to conclude that at the 95% confidence level<br />
the 133 Sb isomer with a neutral-atom half-life of 17 µs is<br />
located above the I π = 17/2 + , 4526 keV state, giving direct<br />
experimental evidence for the shell-model prediction<br />
of an energetically favored I π = 21/2 + state [7].<br />
By employing the newly improved IMS technique it is<br />
possible to gain access to rare nuclear isomers, including<br />
those associated with highly converted decay transitions,<br />
which can be very difficult or impossible to measure by<br />
γ-ray and electron spectroscopy. This achievement has<br />
opened the way to accurate mass measurements of shortlived<br />
exotic isomeric states, which have a great potential for<br />
nuclear structure and nuclear astrophysics investigations at<br />
the future FAIR facility [8].<br />
References<br />
[1] B. Sun et al., Eur. Phys. J. A 31 (2007) 393.<br />
[2] M. Block et al., Phys. Rev. Lett. 100 (2008) 132501.<br />
[3] M. Hausmann et al., Nucl. Instr. Meth. A 446 (2000) 569.<br />
[4] B. Sun et al., Nucl. Phys. A 812 (2008) 1.<br />
[5] Yu.A. Litvinonv et al., Phys. Lett. B 573 (2003) 80 .<br />
[6] H. Geissel et al., Hyperfine Interact. 173 (2006) 49.<br />
[7] J. Genevey et al., Eur. Phys. J. A 7 (2000) 463.<br />
[8] C. Scheidenberger et al., Hyperfine Interact. 173 (2006) 61.
<strong>GSI</strong> SCIENTIFIC REPORT 2009 NUSTAR-EXPERIMENTS-31<br />
Progress of nuclear physics data evaluation projects at <strong>GSI</strong><br />
B. Pfeiffer 1 , U. Czok 2 , Z. Patyk 3 , C. Scheidenberger 1 , and K. Venkataramaniah 4<br />
1 <strong>GSI</strong>, Darmstadt, Germany; 2 II. Phys. Inst., Gießen, Germany; 3 Soltan Institute for Nuclear Studies, Warsaw, Poland;<br />
4 Sri Sathya Sai University, Prasanthinilayam, India<br />
To counteract the general decline of data collection and<br />
evaluation in Europe, the <strong>GSI</strong> took the initiative to participate<br />
in the International Network of Nuclear Structure and<br />
Decay Data Evaluators [1].<br />
Advanced Atomic Mass Evaluation<br />
In 2009, the screening of the literature for all nuclear<br />
data relevant for future evaluations of masses and decay<br />
properties has been continued (see Ref. [2]).<br />
The data are now structured for input into data bases in<br />
the framework of the Advanced Atomic Mass Evaluation –<br />
AAME– project. For the mid-term future it is envisioned to<br />
make all data available via electronic media for broad dissemination<br />
of the original and the evaluated data, respectively.<br />
The creation of a web-site with interactive tools to<br />
serve the community of experimentalists, theorists, and for<br />
users in applied sciences is under development.<br />
Atomic Mass Data Center<br />
In close collaboration with the Atomic Mass Data Center<br />
at Orsay, these data, mainly on α, p- and β-decay as well<br />
as direct mass measurements from FRS/ERS, are added<br />
to the master files of the Future Atomic Mass Evaluation<br />
and NUBASE, which ought to replace the actual version<br />
AME03 [3] in 2013. Up till now about 500 new α-decay<br />
data points have been added. An important part of these<br />
new results have been obtained at <strong>GSI</strong>. At SHIPTRAP, not<br />
only many new α- and p-decay energies were measured,<br />
but additonal information on decay schemes could be obtained<br />
by particle-γ coincidences. The nuclear structure information<br />
allows to calculate the Q-values and by this the<br />
mass difference between mother and daughter nuclide.<br />
The recent measurements with advanced techniques at the<br />
ridge of the valley of stability seem to indicate that the<br />
mass surface lies much higher (higher masses, less binding<br />
energy) than derived from the older data underlying the<br />
actual AME. A first overview will be presented at the International<br />
Conference for Nuclear Data for Science and<br />
Technology – ND2010 at Jeju Island, Korea [4]. Changes<br />
at the driplines will influence astrophysical calculations as,<br />
e.g., for the rp- and r-process of nucleosynthesis.<br />
National Nuclear Data Center<br />
Nuclear structure information is needed for the interpretation<br />
of β- and α-decay measurements to derive correct<br />
Q-values. Lack of information on excited states of<br />
daughter nuclei led to many erronneous results, as too low<br />
Qβ-values (see previous section). Therefore, information<br />
is exchanged with the National Nuclear Data Center at<br />
Brookhaven (specialised in evaluating level schemes). For<br />
the updates of ENSDF, intermediate atomic mass evaluations<br />
are provided by the AMDC [5].<br />
Future installations like SUPER-FRS at FAIR will make<br />
new regions of the nuclidic chart accessible to experiments<br />
and at the same time enable sophisticated studies of known<br />
nuclides. This will lead to a vast number of new nuclear<br />
structure data to be compiled and evaluated by the AMDC<br />
and NNDC. The additional amount of work requires to<br />
globalise the task.<br />
To attract new collaborators from Europe for the updating<br />
of the “Evaluated Nuclear Structure Data File ENSDF”, the<br />
basis for e.g. the Nuclear Data Sheets, a workshop for the<br />
training of evaluators was organized by NNDC with support<br />
from the IAEA in Bucharest: Nuclear Structure & Decay<br />
Data Evaluators ENSDF-2009 [6].<br />
During the workshop, the Nuclear Data Sheets for the mass<br />
A=84 were updated by the participants and have been published<br />
in November 2009 [7].<br />
Following the participation in the Bucharest workshop, one<br />
of the authors (B.P.) was invited to present an overview of<br />
the nuclear data work at <strong>GSI</strong> [8] at the US Nuclear Data<br />
Program –USNDP– Annual Meeting during the US Nuclear<br />
Data Week at BNL [9].<br />
The project is conducted in collaboration with ISNSM in<br />
Orsay (France), and the Institute of Modern Physics of the<br />
Chinese Academy of Sciences in Lanzhou (China). The<br />
authors thank G. Audi, D. Lunney, M. Wang, H. Geissel<br />
for valuable discussions.<br />
References<br />
[1] A.L. Nichols, Nuclear Physics News 19(1), 3 (2009).<br />
[2] B. Pfeiffer et al., <strong>GSI</strong> Scientific Report 2008, NUSTAR-<br />
EXPERIMENTS 16<br />
[3] G. Audi et al., Nucl. Phys. A 729 (2003) 3; A.H. Wapstra<br />
et al., Nucl. Phys. A 729 (2003) 129; G. Audia et al., Nucl.<br />
Phys. A 729 (2003) 337.<br />
[4] http://www.nd2010.org<br />
[5] G. Audi, M. Weng, D. Lunney, B. Pfeiffer, NSR Keynumber<br />
2009AUZZ<br />
[6] http://tandem.nipne.ro/∼workshop ensdf/<br />
[7] D. Abriola, M. Bostan, S. Erturk, M. Fadil, M. Galan, S. Juutinen,<br />
T. Kibedi, F. Kondev, A. Luca, A. Negret, N. Nica, B.<br />
Pfeiffer, B. Singh, A. Sonzogni, J. Timar, J. Tuli, T. Venkova,<br />
K. Zuber, Nuclear Data Sheets 110 (2009) 2815.<br />
[8] http://www.nndc.bnl.gov/proceedings/2009csewgusndp/Thursday/<br />
usndp/Pfeiffer-USNDP.pdf<br />
[9] http://www.nndc.bnl.gov/meetings/usndp2009/<br />
219
NUSTAR-EXPERIMENTS-31 <strong>GSI</strong> SCIENTIFIC REPORT 2009<br />
220
<strong>GSI</strong> SCIENTIFIC REPORT 2009 NUSTAR-THEORY-01<br />
Beryllium isotopes studied in Fermionic Molecular Dynamics<br />
Fermionic Molecular Dynamics (FMD) [1] is a microscopic<br />
many-body approach using Gaussian wave packets<br />
localized in phase-space as single-particle basis states.<br />
Slater determinants projected on parity, angular and total<br />
linear momentum are used as many-body basis states. The<br />
FMD basis is very flexible and contains harmonic oscillator<br />
shell model and Brink-type cluster wave functions as<br />
special cases. The widths of the wave packets are also variational<br />
parameters which is useful for the description of<br />
halo nuclei with extended single-particle wave functions.<br />
An effective interaction derived from the realistic Argonne<br />
V18 interaction by explicitly including short-range central<br />
and tensor correlations in the Unitary Correlation Operator<br />
Method is used. A phenomenological two-body correction<br />
term is added which is fitted to binding energies and radii<br />
of closed-shell nuclei.<br />
In recent years it has become possible to measure the<br />
isotope shifts of short-lived nuclei. With that precise and<br />
model independent measurements of the charge radii are<br />
possible. As shown in Fig. 1 the Beryllium isotopes 7 Be-<br />
11 Be measured by Nörtershäuser et al [2, 3] show an interesting<br />
behavior. Starting from a very large radius for<br />
7 Be the charge radius decreases going to 9 Be and 10 Be and<br />
increases again when going to 11 Be. These pronounced<br />
changes in the charge radii are related to changes in the<br />
structure of these nuclei. Important are here clustering effects<br />
due to low cluster thresholds in 7 Be and 9 Be and the<br />
halo nature of 11 Be.<br />
In a simple Hartree-Fock FMD calculation (HF) the<br />
charge radii come out to small. This is explained by intrin-<br />
Nuclear Charge Radius [fm]<br />
2.7<br />
2.6<br />
2.5<br />
2.4<br />
2.3<br />
2.2<br />
D 1 line<br />
D 2 line<br />
FMD (Multiconfiguration)<br />
FMD (VAP)<br />
FMD (HF)<br />
7 8 9 10 11<br />
Isotope<br />
Figure 1: Experimental charge radii from two different optical<br />
transitions and FMD calculations on the Hartree-Fock<br />
level (HF), using a single optimized configuration (VAP)<br />
and multiconfiguration calculations.<br />
T. Neff and H. Feldmeier<br />
<strong>GSI</strong>, Darmstadt, Germany<br />
E VAP (R pp ) [MeV]<br />
-20<br />
-30<br />
-40<br />
-50<br />
-60<br />
10 Be<br />
-70<br />
1.75 2 2.25 2.5 2.75 3 3.25<br />
R pp [fm]<br />
Figure 2: FMD VAP energies as a function of mean proton<br />
distance Rpp.<br />
sic wave functions that are to compact. For light nuclei like<br />
the Beryllium isotopes it is possible to perform a real variation<br />
after parity and angular momentum projection (VAP).<br />
Here we find a more pronounced clustering and larger<br />
charge radii. The description can be improved further by<br />
including additional configurations with smaller and larger<br />
cluster separation distances. To generate such configurations<br />
we performed VAP calculations with constraints on<br />
the mean proton distance R2 pp = 1<br />
Z2 〈 �protons i
NUSTAR-THEORY-02 <strong>GSI</strong> SCIENTIFIC REPORT 2009<br />
Fission barriers and half-lives of super-heavy elements<br />
J. Erler and P.–G. Reinhard<br />
Institut <strong>für</strong> Theoretische Physik, Universität Erlangen, D-91058 Erlangen, Germany<br />
Self-consistent mean field models have reached a high<br />
descriptive power for nuclear ground state properties and<br />
collective excitations, for reviews see [1, 2]. Their application<br />
to a fully microscopic description of fission is a very<br />
demanding task and it is only in the last years that new investigations<br />
on this topic appear, see e.g. [3, 4, 5]. We<br />
report here briefly on recent development of a fully selfconsistent<br />
description of fission life-times of super-heavy<br />
elements (SHE) [6] on the grounds of Skyrme-Hartree-<br />
Fock (SHF). We start with summarizing the computational<br />
scheme [6]: The fission path is generated by quadrupoleconstrained<br />
SHF whose energy expectation values yield a<br />
“raw” collective energy surface displaying a more or less<br />
large fission barrier. The collective mass and moments of<br />
inertia are computed by self-consistent cranking along the<br />
states of the path. Approximate projection onto zero angular<br />
momentum is performed and quantum corrections for<br />
the spurious vibrational zero-point energy are applied using<br />
the collective masses and widths. The collective ground<br />
state energy is computed fully quantum mechanically [7].<br />
The tunneling rate and the repetition rates are computed<br />
by the standard semi-classical formula (known as WKB)<br />
using the quantum-corrected potential energy and collective<br />
mass; the fission life-time is finally composed from<br />
these two rates. All calculations are done in axial symmetry.<br />
Figure 1 shows results on fission barriers and lifetimes<br />
for a some SHE for which experimental data are available<br />
and for a large variety of Skyrme parameterizations ( SkM ∗<br />
[8], SkP [9], SkI3 [10], SLy6 [11] and SV-min [12]). The<br />
SHE represent two groups, one at the lower side and another<br />
one at the limits of present days data. The span of<br />
predictions from the various Skyrme forces is huge. It is<br />
gratifying to see that the most recent parameterization SVmin<br />
which has been adjusted with a new pool of ground<br />
state data [12] performs very well for barriers and lifetimes<br />
in the lighter group (Rf, Sg, Hs). This suggests that one<br />
may use the fission properties as additional selection criterion<br />
for pinning down more precisely the most realistic<br />
Skyrme force. However, a problem appears when looking<br />
at the trend from the lighter side (Rf, Sg, Hs) to the larger<br />
SHE (Z=112, 114). All parameterizations produce a wrong<br />
trend. Barriers and lifetimes drop significantly in all SHF<br />
predictions while they stay practically constant in experiment.<br />
Possible triaxiality, ignored here, can perhaps lower<br />
the barriers by 0.5–2 MeV which does not suffice to resolve<br />
the mismatch. Altogether, we interpret these results optimistically:<br />
SHF predictions on fission stay in a reasonable<br />
range and fission data, including the unresolved trend, will<br />
help in the further development of nuclear energy functionals<br />
as SHF.<br />
222<br />
fission half lifes [s]<br />
fission barrier [MeV]<br />
10 14<br />
10 10<br />
10 6<br />
10 2<br />
10 -2<br />
10 -6<br />
10 -10<br />
12<br />
11<br />
10<br />
9<br />
8<br />
7<br />
6<br />
5<br />
4<br />
3<br />
2<br />
Rf Sg Hs<br />
exp<br />
SkI3<br />
SLy6<br />
SV-bas<br />
SkP<br />
SV-min<br />
SkM ✱<br />
260 265 270 275 280 285 290<br />
mass number A<br />
Figure 1: Fission barriers (lower) and life-times (upper) for<br />
two chains of super-heavy elements. Compared are results<br />
from a variety of Skyrme parameterizations with experimental<br />
data [13, 14, 15, 16].<br />
References<br />
[1] M. Bender et al, Rev. Mod. Rhys. 75 (2003) 121.<br />
[2] J.R. Stone et al, Prog. Part. Nucl. Phys. 58 (2007) 587.<br />
[3] Berger J.–F. et al, Nucl. Phys. A 685 (2001) 1c.<br />
[4] Bürvenich T. et al, Phys. Rev. C 69 (2004) 014307.<br />
[5] Warda M. et al, Phys. Scr. T 125 (2006) 226.<br />
[6] Schindzielorz N. et al, Int. J. Mod. Phys. E 18 (2009) 773.<br />
[7] Klüpfel P. et al, Eur. Phys. J. 37 (2008) 343.<br />
[8] Bartel J. et al, Nucl Phys. A 386 (1982) 79.<br />
[9] Dobaczewski et al, Nucl. Phys. A 422 (1984) 103.<br />
[10] Reinhard P.-G., Flocard H., Nucl. Phys. A 584 (1995) 467.<br />
[11] Chabanat E. et al, Nucl. Phys. A 627 (1997) 710.<br />
[12] Klüpfel P. et al, Phys.Rev. C 79 (2009) 034310.<br />
[13] Audi G. et al, Nucl. Phys. A 729 (2003) 3.<br />
[14] Hofmann S. et al, Eur. Phys. J. A 10 (2001) 5.<br />
[15] Tandel S.K. et al, Phys. Rev. Lett. 97 (2006) 082502.<br />
[16] Oganessian Yu. Ts. et al, Phys. Rev. C 74 (2006) 044602.
<strong>GSI</strong> SCIENTIFIC REPORT 2009 NUSTAR-THEORY-03<br />
Mode-coupling in a relativistic two-phonon model ∗<br />
E. Litvinova 1,2 , P. Ring 3 , and V. Tselyaev 4<br />
1 <strong>GSI</strong> <strong>Helmholtzzentrum</strong> <strong>für</strong> <strong>Schwerionenforschung</strong>, Germany; 2 Institut <strong>für</strong> Theoretische Physik, Goethe-Universität,<br />
Frankfurt am Main, Germany; 3 Physik-Department, Technische Universität München, Germany; 4 Nuclear Physics<br />
Department, St. Petersburg State University, Russia<br />
The relativistic quasiparticle time <strong>block</strong>ing approximation<br />
(RQTBA), developed recently as a consistent combination<br />
of the covariant energy density functional theory<br />
(CEDFT) and the modern extensions of the Landau–<br />
Migdal theory of finite fermi systems, is reviewed in Ref.<br />
[1]. In the RQTBA, starting from the covariant energy<br />
functional, phonon energies and their vertices are calculated<br />
without any further parameters. They form the basis<br />
of particle-vibrational coupling leading to an energy dependence<br />
of the self-energy and an induced energy-dependent<br />
interaction in the response equation. A proper subtraction<br />
of the static phonon coupling contribution from the induced<br />
interaction avoids double counting of this contribution.<br />
Applications in spherical nuclei show excellent agreement<br />
with experimental data on nuclear spectra below 30<br />
MeV.<br />
The theoretical description of nuclear low-lying dipole<br />
strength remains among the most important problems in<br />
nuclear structure and nuclear astrophysics. Modern measurements<br />
of the dipole strength resolve the fine structure<br />
of the spectra below the neutron threshold. This offers exciting<br />
opportunities for microscopic nuclear structure models<br />
to describe the fine structure of the dipole spectra below<br />
the neutron threshold and to help in analyzing the experimental<br />
data.<br />
In nuclei with pronounced isospin asymmetry the lowlying<br />
dipole strength is characterized by the pygmy resonance<br />
which is a coherent oscillation of the isospin excess<br />
against the isospin saturated core. Since the pygmy dipole<br />
mode has essentially surface nature, it mixes with other surface<br />
modes, especially with low-lying ones. This supposition<br />
has been confirmed by explicit RQTBA calculations.<br />
It has been found that the pygmy mode, arising in RQRPA<br />
as a single state or as very few low lying dipole states with<br />
isoscalar character, is strongly fragmented over many states<br />
in a broad energy region due to the coupling to phonons.<br />
As a result, some fraction of the strength is located well<br />
below the original position of the RQRPA pygmy mode.<br />
Compared to existing data, the RQTBA describes the total<br />
fraction of the dipole strength below the neutron threshold<br />
very reasonably. However, in order to account for the fine<br />
structure of the spectrum, more correlations should be included<br />
in the microscopic model. In particular, it has to reproduce<br />
the lowest dipole state in vibrational nuclei, which<br />
is identified as a member of the quintuplet [2 + 1 ⊗ 3− 1 ].<br />
A two-phonon version of the relativistic quasiparticle<br />
∗ Work supported by the HIC for FAIR Program.<br />
time <strong>block</strong>ing approximation (RQTBA-2) represents a new<br />
class of many-body models for nuclear structure calculations<br />
based on the covariant energy density functional<br />
[2]. As a fully consistent extension of the relativistic<br />
quasiparticle random phase approximation (RQRPA), the<br />
two-phonon RQTBA implies a fragmentation of nuclear<br />
states over two-quasiparticle and two-phonon configurations.<br />
This leads, in particular, to the splitting-off the lowest<br />
1 − state as a member of the two-phonon [2 + ⊗ 3 − ]<br />
quintuplet from the pygmy dipole mode. The inclusion of<br />
the two-phonon configurations in the model space allows to<br />
describe the positions and the reduced transition probabilities<br />
of the lowest 1 − states in the tin isotopic chain as well<br />
as the low-energy fraction of the dipole strength without<br />
any adjustment procedures [2]. The model is also applied<br />
to the low-lying dipole strength in neutron-rich 68,70,72 Ni<br />
isotopes, see Fig. 1. Recent experimental data for 68 Ni [3]<br />
are reproduced fairly well.<br />
��������������<br />
�<br />
�<br />
�<br />
�<br />
�� ��<br />
� �<br />
�<br />
�<br />
�<br />
� �������������<br />
�<br />
�<br />
�<br />
� � �� ��<br />
�<br />
�������<br />
�� ��<br />
� �<br />
�<br />
��<br />
�<br />
�<br />
�<br />
� � ��<br />
�<br />
��<br />
�������<br />
�� ��<br />
� �<br />
�<br />
�<br />
� � �� ��<br />
�������<br />
Figure 1: Low-lying dipole spectra of 68,70,72 Ni calculated<br />
within the RQTBA (dashed curve) and the RQTBA-2 (solid<br />
curve) with a smearing of 200 keV. Left panel contains also<br />
the data (filled circles with error bars, units on the right).<br />
Being applied to the description of the pygmy dipole resonance,<br />
the relativistic two-phonon model provides a new<br />
quality of understanding of mode coupling mechanisms in<br />
nuclei. The method is based on Green’s function techniques<br />
and can be widely applied also in other areas of<br />
quantum many-body physics.<br />
References<br />
[1] P. Ring, E. Litvinova, Phys. Atomic Nuclei 72, 1285 (2009).<br />
[2] E. Litvinova, P. Ring, V. Tselyaev, arXiv:0910.4343 [nucl-th].<br />
[3] O. Wieland et al., Phys. Rev. Lett. 102, 092502 (2009).<br />
223
NUSTAR-THEORY-04 <strong>GSI</strong> SCIENTIFIC REPORT 2009<br />
Microscopic M1 strength functions for nuclear astrophysics<br />
H.P. Loens 1,2 , K. Langanke 1,2 , G. Martínez-Pinedo 1,2 , and K. Sieja 1<br />
1 <strong>GSI</strong>, Darmstadt, Germany; 2 Institut <strong>für</strong> Kernphysik, TU Darmstadt, Darmstadt, Germany<br />
The so-called Hauser-Feshbach model relies on various<br />
nuclear structure input, e.g. nuclear masses, nuclear level<br />
densities, and radiative strength-functions (RSFs). The latter<br />
are a crucial input to the description of the γ-channel<br />
that is usually dominated by E1 and M1 transitions for<br />
which one often applies analytical formulae: the E1 transitions<br />
are usually described with a Lorentzian form adjusted<br />
to the electric giant dipole resonance [1] based on experimental<br />
data. The M1 transitions one usually modeled by<br />
using either the single-particle approach, which gives an<br />
energy independent strength [5], or by a Lorentzian representing<br />
the spin-flip resonance [4].<br />
Unfortunately all these approaches are not capable of taking<br />
into account any low-lying strength such as a Pygmy<br />
dipole resonance (PDR) or a scissors mode. For the PDR<br />
a recent study showed, that it can have a strong influence<br />
on the reaction rate needed for r-process nucleosynthesis<br />
[3]. A similar study has not been performed for M1 transitions<br />
yet. Therefore we have examined the influence of<br />
the scissors mode on theoretical (n,γ) rates with the help of<br />
a shell-model M1 strength description. Although E1 transitions<br />
usually dominate, the M1 transitions can become<br />
more important when reaching the dripline or when one<br />
parity dominates up to excitation energies of several MeV<br />
[2].<br />
f [MeV -3 ]<br />
10 -7<br />
10 -8<br />
10 -9<br />
10 -10<br />
10 -7<br />
10 -8<br />
10 -9<br />
10 -10<br />
10 -7<br />
10 -8<br />
10 -9<br />
10 -10<br />
10 -11<br />
54 Fe<br />
58 Fe<br />
62 Fe<br />
56 Fe<br />
60 Fe<br />
64 Fe<br />
0 2 4 6 8 10 12 14 2 4 6 8 10 12 14<br />
E [MeV]<br />
γ<br />
Figure 1: Different RSFs for iron isotopes from the singleparticle<br />
model (dash-dotted) [5], a Lorentzian parametrisation<br />
[4] (dotted), and the shell-model (solid).<br />
In fig. 1 we can see the RSFs for different iron isotopes.<br />
Clearly we can also see the low-lying M1 strength resulting<br />
from a scissors mode in 56−64 Fe in the shell-model approach<br />
(solid line). The Lorentzian parametrisation (dotted<br />
line) gives a larger integrated strength compared to the<br />
shell-model strength.<br />
224<br />
Lor/SM / sp<br />
0.1 1 10<br />
1 10<br />
2<br />
53 54 55 56<br />
Fe(n,γ) Fe<br />
Fe(n,γ) Fe<br />
1<br />
0.5<br />
1<br />
0.5<br />
1<br />
57 Fe(n,γ) 58 Fe<br />
61 Fe(n,γ) 62 Fe<br />
0.5<br />
0.1 1<br />
0.1 1 10<br />
T 9 [10 9 K]<br />
59 Fe(n,γ) 60 Fe<br />
63 Fe(n,γ) 64 Fe<br />
Figure 2: Ratio of reaction rates (see text for further explanation);<br />
the E1 transitions were treated identically for all<br />
reaction rates.<br />
Fig. 2 shows the ratio of reaction-rates obtained with<br />
either a Lorentzian approach (dotted) or a shell-model approach<br />
(solid) to the single-particle approach. We can see<br />
that by going towards the neutron-dripline the overall effect<br />
from the Lorentzian approach changes: while for the<br />
radiative-neutron captures on 53−59 Fe the spin-flip resonance<br />
dominates (due to the high neutron-separation energy),<br />
the Lorentzian low-energy tail for the the reactions<br />
on 61−63 Fe reduces the reaction rate. The shell-model calculation<br />
generally gives lower reaction-rates compared to<br />
the single-particle approach in the relevant energy regions.<br />
Unfortunately the E1 transitions are too dominant in the reactions<br />
studied here to resolve the nuclear structure effect<br />
of a potential scissors mode. For that we will have to go<br />
to more neutron-rich nuclei closer to the dripline. Here the<br />
low neutron-separation energies may lead to a competition<br />
between E1 and M1 transitions.<br />
References<br />
[1] J.J. Cowan et al., Phys. Rep. 208, 1 (1991)<br />
[2] H.P. Loens et al., Phys. Lett. B 666, 4 (2008)<br />
[3] E. Litvinova, Nucl. Phys. A 863, 26 (2009)<br />
[4] RIPL-2 Handbook, http://www-nds.iaea.org/RIPL-2/<br />
[5] J.A. Holmes et al., ADNDT 18, 305-412 (1976)
<strong>GSI</strong> SCIENTIFIC REPORT 2009 NUSTAR-THEORY-05<br />
The effects of r-process heating on fall-back accretion in<br />
compact object mergers<br />
A. Arcones 1,2 , G. Martínez-Pinedo 1 , B. D. Metzger 3 , and E. Quataert 3<br />
1 <strong>GSI</strong> <strong>Helmholtzzentrum</strong> <strong>für</strong> <strong>Schwerionenforschung</strong>, Planckstr. 1, 64291 Darmstadt, Germany; 2 Institut <strong>für</strong> Kernphysik,<br />
TU Darmstadt, Schlossgartenstr. 9, D-64289 Darmstadt, Germany; 3 Astronomy Department and Theoretical<br />
Astrophysics Center, University of California, Berkeley, 601 Campbell Hall, Berkeley CA, 94720<br />
Gamma-ray bursts (GRBs) are one of the most energetic<br />
explosions observed in the universe. Observations indicate<br />
that there are long-duration GRBs resulting from the deaths<br />
of massive stars and short-duration GRBs whose origin remains<br />
unknown. The most popular and well-studied engine<br />
model for short GRBs is the binary merger of two neutron<br />
stars (NS-NS) or a neutron star and a black hole (NS-BH).<br />
Mergers result in a central compact object (neutron star<br />
or black hole) surrounding by a compact disk (<br />
). The accretion timescales of the disk are similar to<br />
the duration of the burst. This favours the compact object<br />
mergers as explanation for the short GRBs. However, this<br />
scenario has become more complex with the discovery that<br />
short GRBs are often followed by a “tail” of emission (usually<br />
soft X-rays). In our work [1] we find that the heating<br />
produced by r-process (rapid neutron capture process) can<br />
produce a complete cut-off in the fall-back and for some<br />
combination of parameters this fall-back can reappear producing<br />
the observed tail in the X-ray emission. In our study<br />
Figure 1: Density and temperature evolutions of trajectories with<br />
different orbital periods ( ) that are given in the figures. The<br />
bottom panel shows the total r-process heating rate for the same<br />
trajectories.<br />
we have used a merger trajectory from [2] to describe the<br />
early exponential expansion. For the later evolution, material<br />
with negative binding energy ( ) and orbital period<br />
decouples from the unbound material and<br />
supported by the Deutsche Forschungsgemeinschaft through contract<br />
SFB634<br />
follows . The evolution of density and temperature<br />
is shown in the upper and middle panels of Fig. 1<br />
for trajectories with different orbital periods as indicated in<br />
the figure. Total r-process heating rate for these trajectories<br />
appears in the bottom panel. We have used a dynamical rprocess<br />
network that includes neutron captures, photodissociations,<br />
beta decays, and fission. The contribution of<br />
the r-process heating is consistently added to the entropy to<br />
determine the temperature change.<br />
Figure 2: Fall-back rate in NS-NS/NS-BH mergers including<br />
the effects of r-process heating. Different line styles correspond<br />
to different heating timescales: s (dotted line),<br />
0.86 s (dashed line), and 3 s (solid line).<br />
In the paper [1] an analytic model has been developed to<br />
study the evolution of the fall-back material. We found that<br />
when the heating time scale (i.e., timescale for the r-process<br />
heating) gets similar to a critical orbital period, there is a<br />
cut-off in the accretion (solid curve in Fig. 2). However,<br />
material with binding energy above some critical value may<br />
remain marginally bound, thus leading to a temporal gap in<br />
the fall-back rate. This is shown in Fig. 2 by the dashed<br />
curve corresponding to a model with s.<br />
The heating from the r-process can change the dynamics<br />
of the fall-back accretion in compact object mergers.<br />
Including a full r-process network into merger simulations<br />
is not yet computational doable, however one has to think<br />
how to account for the contribution of r-process heating in<br />
the simulations.<br />
References<br />
[1] B. D. Metzger, A. Arcones, E. Quataert and G. Martinez-<br />
Pinedo “The effects of r-process heating on fall-back accretion<br />
in compact object mergers” Accepted in MNRAS.<br />
[2] C. Freiburghaus, S. Rosswog, and F.-K. Thielemann 1999,<br />
ApJL, 525, L121<br />
225
NUSTAR-THEORY-06 <strong>GSI</strong> SCIENTIFIC REPORT 2009<br />
Thermodynamics of nuclear matter with clusters ∗<br />
S. Typel 1,2,3 , G. Röpke 4 , D. Blaschke 5,6 , T. Klähn 5,7 , M. Voskresenskaya 1 , and H.H. Wolter 2,8<br />
1 <strong>GSI</strong>, Darmstadt; 2 Excellence Cluster Universe, Garching; 3 Technische Universität München; 4 Universität Rostock;<br />
5 Uniwersytet Wrocławski; 6 JINR, Dubna; 7 Argonne National Laboratory; 8 Ludwig-Maximilians Universität München<br />
The composition and the equation of state (EoS) of nuclear<br />
matter from very-low to super-saturation densities are<br />
widely discussed in several areas of nuclear physics and astrophysics.<br />
In particular, the dependence of the thermodynamical<br />
properties on the neutron-proton asymmetry, represented<br />
e.g. by the symmetry energy, is of crucial importance<br />
in heavy-ion collisions, exotic nuclei, neutron stars,<br />
and core collapse supernovae.<br />
We investigate properties of nuclear matter at finite<br />
temperature and density, including the formation of light<br />
clusters (deuteron, triton, helion, and α-particle). The<br />
novel feature of this work [1] is to include the formation<br />
of clusters as well as their dissolution due to medium<br />
effects in a systematic way using two many-body theories:<br />
a microscopic quantum statistical (QS) approach<br />
and a generalized relativistic mean-field (RMF) model<br />
with density-dependent nucleon-meson couplings. Nucleon<br />
quasi-particle properties are determined within the<br />
RMF model from the scalar and vector self-energies. Cluster<br />
binding energies are reduced in the medium due to Pauli<br />
<strong>block</strong>ing shifts calculated in the QS approach. Both models<br />
reproduce the limiting cases of nuclear statistical equilibrium<br />
(NSE) at low densities and nuclear matter free of clusters<br />
at high densities. The treatment of the cluster dissociation<br />
is based on the Mott effect, implemented in slightly<br />
different ways in the QS and generalized RMF approaches.<br />
This leads to somewhat different results in the intermediate<br />
density range of about 10 −3 to 10 −1 fm −3 which gives an<br />
estimate of the present accuracy of the theoretical predictions.<br />
The cluster abundances and thermodynamical properties<br />
of theses models are compared in the region of temperatures<br />
T ≤ 20 MeV and baryon number densities from zero<br />
to a few times nuclear saturation density. The effect of cluster<br />
formation on the liquid-gas phase transition and on the<br />
density dependence of the symmetry energy is studied. We<br />
demonstrate that the parabolic approximation for the asymmetry<br />
dependence of the nuclear EoS breaks down at low<br />
temperatures and at subsaturation densities due to cluster<br />
formation. Comparison is made with other theoretical approaches,<br />
in particular those that are commonly used in astrophysical<br />
calculations. Substantial differences are found.<br />
Conventional theoretical calculations based on meanfield<br />
approaches fail to describe the correct densitydependence<br />
of the symmetry energy in the low-density,<br />
low-temperature limit. New data from heavy-ion collisions<br />
∗ This research was supported by the DFG cluster of excellence “Origin<br />
and Structure of the Universe” and CompStar, a Research Networking<br />
Programme of the European Science Foundation.<br />
226<br />
can be used to extract the free and internal symmetry energies<br />
at subsaturation densities and temperatures below<br />
10 MeV, see [2] for details. Figure 1 depicts the dependence<br />
of the free and internal symmetry energy on the surface<br />
velocity vsurf, that is a parameter measuring the time<br />
when particles leave the source in the heavy-ion collision.<br />
The QS approach with clusters predicts symmetry energies<br />
that are in very good agreement with experimental data. It<br />
uses the nucleon self-energies from the RMF model with<br />
density-dependent couplings in a parametrized form.<br />
free symmetry energy F sym [MeV]<br />
20<br />
15<br />
10<br />
5<br />
(a)<br />
experiment<br />
RMF without clusters<br />
QS with clusters<br />
0<br />
0 1 2 3 4 5<br />
V [cm/ns]<br />
surf<br />
internal symmetry energy E sym [MeV]<br />
20<br />
15<br />
10<br />
5<br />
(b)<br />
experiment<br />
RMF without clusters<br />
QS with clusters<br />
0<br />
0 1 2 3 4 5<br />
V [cm/ns]<br />
surf<br />
Figure 1: Free and internal symmetry energy as a function<br />
of the surface velocity. Experimental results are compared<br />
with results of theoretical calculations neglecting cluster<br />
formation (RMF) and including cluster formation (QS).<br />
The density dependence of the nucleon-meson couplings<br />
in the RMF model is found by fitting properties of finite<br />
nuclei assuming a particular functional form [3]. It is well<br />
determined only at densities near saturation. The couplings<br />
in the limit of zero density are presently obtained from an<br />
extrapolation. Investigating the low-density limit of the<br />
generalized RMF model with clusters we find relations between<br />
the zero-density couplings and the nucleon-nucleon<br />
scattering lengths that will help to better constrain the parameters<br />
of the RMF model.<br />
References<br />
[1] S. Typel, G. Röpke, T. Klähn, D. Blaschke and H. H. Wolter,<br />
Phys. Rev. C 81, 015803 (2010).<br />
[2] J. B. Natowitz, G. Röpke, S. Typel, D. Blaschke, A. Bonasera,<br />
K. Hagel, T. Klähn, S. Kowalski, L. Qin, S. Shlomo, R. Wada<br />
and H. H. Wolter, arXiv:1001.1102 [nucl-th].<br />
[3] S. Typel, Phys. Rev. C 71, 064301 (2005).
<strong>GSI</strong> SCIENTIFIC REPORT 2009 NUSTAR-THEORY-07<br />
Giant monopole resonances in an improved transport model<br />
T. Gaitanos, A.B. Larionov, H. Lenske, and U. Mosel<br />
The nuclear giant monopole resonance (GMR or breathing<br />
mode), i.e. the collective isoscalar excitation of<br />
a nucleus, is investigated within an improved relativistic<br />
Boltzmann-Uehling-Uhlenbeck (BUU) transport approach.<br />
The theoretical investigation and physical interpretation of<br />
the properties (centroid energies, decay modes) of this resonance<br />
is still an object of current debates [1, 2, 3]. It represents<br />
also an important tool to better understand the nuclear<br />
many-body problem. Many microscopic models have<br />
been developed for the theoretical description of the GMR.<br />
They can be divided into two groups: purely quantum mechanical<br />
approaches and semi-classical dynamical models,<br />
see the review [1, 2] for details. Here we apply a semiclassical<br />
transport approach, i.e., the relativistic Giessen-<br />
Boltzmann-Uehling-Uhlenbeck (GiBUU) model, to collective<br />
isoscalar monopol vibrations. The GiBUU transport<br />
equation is solved with the test particle Ansatz, where the<br />
collision integral is treated in an parallel ensemble algorithm.<br />
The numerical treatment of the GiBUU equation for the<br />
case of small-amplitude collective vibrations excited in a<br />
finite nuclear system is not trivial. It requires a very good<br />
stability of the ground state configurations, which is difficult<br />
to reach in the spirit of the test-particle method. So<br />
far empirical density distributions have been used to initialize<br />
ground state nuclei in transport simulations, which<br />
might be not always consistent with the energy density<br />
functional used for the propagation of the system. Another<br />
well known problem is related to the calculation of<br />
Pauli <strong>block</strong>ing factors in the Uehling-Uhlenbeck collision<br />
integral for the small-amplitude Fermi surface distortions.<br />
We thus have improved the relativistic GiBUU transport<br />
model by performing Thomas-Fermi calculations with the<br />
same energy-density functional as that used in the dynamical<br />
evolution. Furthermore, the numerical treatment of the<br />
Pauli <strong>block</strong>ing factors has been carefully studied, as in detail<br />
explained in Ref. [4]. The inclusion of collisions decline<br />
the numerical propagation of nuclear ground states,<br />
however, the spurious particle emission is of the order of<br />
max. for fm/c. The simulation of collective<br />
vibrations is modeled by scaling all test particle coordinates<br />
such that the corresponding excitation is close to the experimental<br />
data, before the propagation starts.<br />
The results are shown in Fig. 1. The excitation energy is<br />
close to the experimental data, and agrees also with calculations<br />
according the liquid-drop model. The situation for the<br />
width is more involved. Pure Vlasov calculations, in which<br />
only one-body friction is included and is in agreement with<br />
wall formula calculations, strongly underpredict the data.<br />
Work supported by DFG and BMBF.<br />
Inst. <strong>für</strong> Theor. Physik, Giessen, Germany<br />
E * (MeV)<br />
(MeV)<br />
30<br />
25<br />
20<br />
15<br />
Vlasov<br />
exp. data<br />
Liquid drop<br />
10<br />
0 20 40 60 80 100 120 140 160 180 200 220<br />
7<br />
6<br />
5<br />
4<br />
3<br />
Vlasov<br />
exp. data<br />
wall<br />
wall+NN coll.<br />
GiBUU<br />
2<br />
1<br />
0<br />
0 20 40 60 80 100 120 140<br />
mass number A<br />
160 180 200 220<br />
Figure 1: Excitation energy (upper panel) and width (lower<br />
panel) of the GMR as function of the mass number. Vlasov<br />
and full BUU results (filled circles and gray band, respectively)<br />
are compared with experimental data (open diamonds).<br />
The solid line in the upper panel shows liquiddrop<br />
model results. In the lower panel, the dashed line depicts<br />
the wall formula results, while the solid line shows<br />
the full width including both the wall and collisional contributions.<br />
The inclusion of collisions improves the situation to some<br />
extend. It is worthwhile to note that similar results are obtained<br />
in recent quantal (Q)RPA calculations [3], in which<br />
only configurations are accounted for. Only extended<br />
RPA models by including a coupling to more complex configurations<br />
or a coupling of to phonons can explain<br />
the experimental data better.<br />
We conclude that the present improved relativistic<br />
GiBUU transport approach is appropriate to describe the<br />
basic features of collective small-amplitude vibrations and<br />
is in satisfactory agreement with standard RPA calculations.<br />
It would be helpful to extend this study to other vibration<br />
modes such dipole and quadrupole excitations.<br />
References<br />
[1] J.P. Blaizot, Phys. Rep. 64 (1980) 171.<br />
[2] S. Kamerdzhiev, J. Speth, G. Terychny, Phys. Rep. 393<br />
(2004) 1.<br />
[3] V. Tselyaev et al., arXiv:0912.5328 [nucl-th].<br />
[4] T. Gaitanos, A.B. Larionov, H. Lenske, U. Mosel, in preparation.<br />
227
NUSTAR-THEORY-07 <strong>GSI</strong> SCIENTIFIC REPORT 2009<br />
228
<strong>GSI</strong> SCIENTIFIC REPORT 2009 NQMA-EXPERIMENTS-01<br />
Isospin Observables in Multifragmentation of Relativistic Projectiles ∗<br />
S. Bianchin1 , A.S. Botvina2 , N. Buyukcizmeci3 , J. Łukasik4 , I.N. Mishustin2 , R. Ogul3 , C. Sfienti5 ,<br />
W. Trautmann1 † 1<br />
, and the ALADIN Collaboration<br />
1 <strong>GSI</strong>, Darmstadt, Germany; 2 FIAS, J.W. Goethe University, Frankfurt, Germany; 3 Selçuk University, Konya, Turkey;<br />
4 IFJ-PAN, Kraków, Poland; 5 Catania University and INFN, Catania, Italy<br />
Multifragmentation is a universal phenomenon occurring<br />
when a large amount of energy is deposited in a nucleus.<br />
It was observed in high energy nuclear reactions<br />
induced by hadrons and heavy ions. It is believed to be<br />
a manifestation of the nuclear liquid-gas phase transition<br />
which is also expected to occur in crusts of neutron stars<br />
and in supernova explosions. This reaction offers a unique<br />
possibility to experimentally study properties of fragments<br />
imbedded in the hot environment of other nuclear species.<br />
The ALADIN experiment S254, conducted in 2003 at SIS,<br />
was designed to study isotopic effect in projectile fragmentation<br />
at relativistic energies [2, 3]. Stable beams of<br />
neutron-rich 124 Sn and radioactive beams of neutron-poor<br />
107 Sn and 124 La, delivered by the fragment separator FRS,<br />
were used. The ALADIN set up permits the nearly complete<br />
detection and identification of all particles with Z ≥ 2<br />
originating from the disintegration of excited projectile<br />
spectators [4]. For the analysis of the experimental data,<br />
the Statistical Multifragmentation Model (SMM, Ref. [1])<br />
has been used. Previously, the SMM was successfully applied<br />
for the interpretation of experimental data by many<br />
groups.<br />
By selecting a realistic ensemble of excited residual nuclei<br />
emerging after the fast dynamical stage of the reaction,<br />
it has been possible to describe important characteristics<br />
of the fragment charge distributions and correlations:<br />
cross-section and multiplicity distributions and fragmentfragment<br />
correlations within events. The analysis of isotope<br />
distributions and of the neutron contents of produced<br />
fragments as well as the isoscaling analysis [2] have shown<br />
that the properties of fragments at the breakup stage of<br />
these multifragmentation reactions are different from those<br />
of cold isolated nuclei as assumed in the standard version<br />
of the SMM [5]. In particular, the symmetry energy of fragments<br />
has to be considerably lowered in order to describe<br />
the observed neutron richness of the produced fragments.<br />
This is illustrated in Fig. 1 where the experimental yields<br />
of fragments with 7 ≤ Z ≤ 10 are shown in comparison to<br />
the results of standard and modified calculations. The observed<br />
effect is attributed to the influence of the surrounding<br />
matter and possible expansion or deformation of the<br />
fragments as they form in the hot environment. This effect<br />
has far reaching consequences for astrophysical processes<br />
like supernova explosions when similar temperatures and<br />
densities can be reached [6].<br />
∗ Work supported by EU under contract No. HPRI-CT-1999-00001.<br />
† w.trautmann@gsi.de<br />
Figure 1: Isotope distributions of fragments with atomic<br />
number Z = 7 − 10 for 107 Sn (left panels) and 124 Sn (right<br />
panels), integrated over 0.2 ≤ Zbound/Z0 ≤ 0.8. The dots<br />
represent the experimental data. Normalized results from<br />
calculations with the standard (γ = 25 MeV) and modified<br />
(γ = 14 MeV) symmetry-term coefficients are shown by<br />
the dashed and solid lines, respectively.<br />
References<br />
[1] J.P. Bondorf et al., Phys. Rep. 257 (1995) 133.<br />
[2] S. Bianchin et al., <strong>GSI</strong> Scientific Report 2007, p. 165.<br />
[3] C. Sfienti et al., Phys. Rev. Lett. 102 (2009) 152701.<br />
[4] A. Schüttauf et al., Nucl. Phys. A607 (1996) 457.<br />
[5] N. Buyukcizmeci et al. Invited talk at NUFRA2009, Kemer,<br />
Turkey, http://fias.uni-frankfurt.de/nufra2009.<br />
[6] A.S. Botvina and I.N. Mishustin, preprint arXiv:0811.2593<br />
(2008).<br />
229
NQMA-EXPERIMENTS-02 <strong>GSI</strong> SCIENTIFIC REPORT 2009<br />
Protons and deuterons from Al+Al collisions at 1.93A GeV measured by FOPI ∗<br />
K. Piasecki † 1,2 , N. Herrmann 1 , and FOPI collaboration 1<br />
1 Physikalisches Institut, Universität Heidelberg; 2 Institute of Experimental Physics, University of Warsaw, Poland<br />
Full mapping of phase space of particles emitted from<br />
the final state of heavy-ion collisions at beam energies<br />
around 2A GeV has not yet been accomplished. This paper<br />
reports the investigation of protons and deuterons emitted<br />
from central collisions of light symmetric system of Al+Al<br />
at 1.93A GeV, done by FOPI. These particles, being the<br />
most abundant subsample of Light Charged Particles (LCP,<br />
Z≤2), amount to a bulk of nuclear matter participating in<br />
the collision. Analysis of proton and deuteron phase space<br />
helps sheding light on a degree of nuclear stopping [1], and<br />
possible deviations from the ideal state of thermal equilibrium.<br />
The only published thermal model prediction for this<br />
colliding system [2] is based on an array of four yield ratios,<br />
limiting the predictive power to a coarse suggestion.<br />
Establishing the ratio of deuteron to proton yields enhances<br />
this array, which could be further on compared to the predictions<br />
of thermal models as well as the non-equilibrium<br />
transport model UrQMD [3].<br />
The S279 experiment was carried out in August 2005<br />
at the SIS-18. The 27 Al ions were hitting the 27 Al target,<br />
shifted 40 cm upstream from its nominal position. The<br />
CDC chamber was surrounded by the Plastic Barrel (PLB)<br />
in a version covering the polar angles between 27 ◦ and 57 ◦<br />
with respect to the target position. Out of 290·10 6 recorded<br />
events in total, samples of 9.8·10 6 (29.5·10 6 ) events were<br />
selected for the analysis of protons (deuterons). For each<br />
sample, events corresponding to 20% of most central collisions<br />
were selected.<br />
Particles were identified using standard FOPI PID techniques<br />
[4] and analysed on the pt − y (rapidity) plane. For<br />
CDC tracks matching the PLB hits, the information from<br />
both detectors was used, and for the particles emitted at<br />
polar angles larger that 57 ◦ , only the CDC information was<br />
available. The compensation of losses due to deficiency<br />
was done in two steps:<br />
(i) losses due to cuts on mass parameter from CDC and<br />
PLB were compensated by extrapolating the gaussianlike<br />
mass distributions outside the cut bounds;<br />
(ii) losses due to detectors, tracker algorythm, CDC-PLB<br />
matching and cuts intended to purify the sample were<br />
estimated by simulating 3·10 6 IQMD events in the<br />
GEANT environment and analysing the output with<br />
the help of the standard FOPI software.<br />
The reconstructed pt − y phase space was first analysed in<br />
rapidity slices. The Boltzmann function<br />
230<br />
dN<br />
dpT<br />
= N · pT · E · exp(−mT /T ) (1)<br />
∗ Work supported by BMBF 06HD154<br />
† kpiaseck@physi.uni-heidelberg.de<br />
where mT = (p 2 T + m2 prot,deut )1/2 , was fitted to the<br />
data and the inverse slopes T were extracted. For protons<br />
(deuterons), T = 109±5 (112±8) MeV was found at the<br />
midrapidity of the nucleon-nucleon centre of mass. The<br />
rapidity distribution (see Fig. 1) was reconstructed by integrating<br />
out the fitted Eq. 1 for each rapidity bin. The<br />
integrated yield of protons (deuterons) was found to be<br />
21.0±0.25 (4.0±0.25), and the deuteron to proton yield ratio<br />
0.19±0.015. The above mentioned errors include the<br />
limitation of experimental and simulated statistics and inaccuracy<br />
due to extrapolation of pT spectra, but not due to<br />
variation of cut parameters. Large abundance of deuterons<br />
relative to protons might require introducing cluster formation<br />
in the modelling of heavy-ion collisions. A careful<br />
investigation of all the systematic errors is ongoing.<br />
yield (arb. units)<br />
0.15<br />
0.1<br />
0.05<br />
0<br />
protons exp.<br />
deuterons exp.<br />
prot. therm.<br />
deut. therm.<br />
preliminary<br />
0 0.25 0.5 0.75<br />
y<br />
y CM<br />
NN<br />
Figure 1: Rapidity distribution (normalized to unity) of<br />
protons and deuterons (solid) emitted from central collisions<br />
of Al+Al at 1.93A GeV compared to Boltzmann predictions<br />
assuming as temperatures the inverse slopes extracted<br />
from fits to pt spectra (dashed).<br />
References<br />
[1] W. Reisdorf et al. (FOPI Collaboration), Phys. Rev. Lett. 92<br />
(2004) 232301.<br />
[2] X. Lopez et al. (FOPI Collaboration), Phys. Rev. C 76 (2007)<br />
055203(R).<br />
[3] S.A. Bass et al., Prog. Part. Nucl. Phys. 41 (1998) 225.<br />
[4] B. Sikora (FOPI Collaboration), Acta Phys. Pol. B 31 (2000)<br />
135.
<strong>GSI</strong> SCIENTIFIC REPORT 2009 NQMA-EXPERIMENTS-03<br />
Centrality dependence of K + flow in 58 Ni + 58 Ni collisions at 1.91A GeV<br />
measured with the FOPI detector ∗<br />
T.I. Kang † 1,2 , N. Herrmann 3 , R. Averbeck 2 , K. D. Hildenbrand 2 , B. Hong 1 , M. Kiˇs 2 , Y. Leifels 2 , K.<br />
Piasecki 3 , W. Reisdorf 2 , A. Schüttauf 2 , and for the FOPI Collaboration 2<br />
1 Korea University, Seoul, Korea; 2 <strong>GSI</strong>, Darmstadt, Germany; 3 Physikalisches Institut, Universität Heidelberg, Germany<br />
Kaon production in 58 Ni + 58 Ni heavy-ion collisions at<br />
1.91A GeV was measured by the FOPI collaboration at<br />
the heavy-ion synchrotron (SIS) at <strong>GSI</strong> making use of the<br />
newly installed MMRPC barrel [1]. Sub-threshold kaon<br />
production is expected to provide valuable insight into the<br />
properties of hadrons at high density [2]. The kaon-nucleon<br />
potential is expected to enhance the in-medium effective<br />
mass for K + and to reduce the effective mass for K − if the<br />
system becomes more dense. Thus, the production of a K +<br />
will require more energy while the production of a K − will<br />
require less energy in a dense system.<br />
Furthermore, the repulsive kaon-nucleon potential tends<br />
to make kaons flow away from nucleons and the attractive<br />
antikaon-nucleon potential is expected to let anti-kaons<br />
flow similar to nucleons. Since the magnitude of these<br />
medium effects on charged kaons depends on the strength<br />
of the kaon-nucleon potential [2], in principle it is possible<br />
to deduce this strength from the measurement of charged<br />
kaon flow in heavy-ion collisions.<br />
10 7<br />
10 6<br />
10 5<br />
10 4<br />
10 3<br />
10 2<br />
10<br />
1<br />
π +/− K +<br />
K -<br />
p<br />
0 0.5 1 1.5 2 2.5 3<br />
mRPC (GeV/c 2 )<br />
Figure 1: Reconstucted mass distribution of produced particles<br />
with plab ≤ 0.8 GeV/c in 58 Ni + 58 Ni collisions. Positively<br />
(negatively) charged particles are shown by the red<br />
(blue) histogram.<br />
In April 2008, the FOPI experiment has recorded 55 ×<br />
10 6 58 Ni + 58 Ni collisions, corresponding to the most central<br />
50 % of total geometric reaction cross section. 190,000<br />
K + and 4,000 K − are identified with a ratio of signal to<br />
∗ Work supported by DFG 446 KOR 113/216/0-1, BMBF 06HD190I<br />
and EU/FP6 I3 HPcontract no. R113-CT-2004-506078.<br />
† t.i.kang@gsi.de<br />
d<br />
t<br />
background better than 9. We are able to identify K + up to<br />
a momentum of plab = 1.1 GeV/c and K − could be separated<br />
from the background up to 0.8 GeV/c. Figure 1 shows<br />
the mass distributions of charged particles in 58 Ni + 58 Ni<br />
collisions at 1.91A GeV, demonstrating a clear separation<br />
of π ± , K ± , protons, deuterons, and tritons.<br />
Peripheral<br />
Central<br />
Peripheral<br />
Central<br />
Figure 2: Directed flow parameter v1 for K + (left panel)<br />
and for protons (right panel) for central (b ≤ 3 fm) and<br />
peripheral collision (b ∼ 6 ± 1 fm) as a function of the<br />
normalized rapidity y0 = ylab / ycm - 1.<br />
Figure 2 shows the fourier expansion coefficient v1 for<br />
K + and protons for two different centrality selections, extending<br />
our previous FOPI result [4]. The values reported<br />
in Figure 2 are obtained by analyzing transverse momentum<br />
in the FOPI acceptance, upper momentum limit for<br />
kaons plab ≤ 1.0 GeV/c for 30 o < θ < 52 o (MMRPC Barrel)<br />
and 0.5 GeV/c for 52 o < θ < 110 o (Plastic Barrel).<br />
While the K + directed flow shows a distinct dependence<br />
on the collision centrality, the proton flow is the same for<br />
central and peripheral collisions.<br />
A detailed comparison of our data with state of the art<br />
transport models will help to disentangle the density and<br />
the momentum dependence of the kaon nucleon potential.<br />
References<br />
[1] A. Schüttauf et al., Nucl. Phys. B Proc. Supp. 158 (2006) 52.<br />
[2] W. Cassing and U. Mosel, Prog. Part. Nucl. Phys. 25 (1990)<br />
235.<br />
[3] G. Q. Li, C. M. Ko, and Bao-An Li Phys. Rev. Lett. 74 (1995)<br />
235.<br />
[4] P. Crochet et al., Phys. Lett. B 486 (2000) 6.<br />
231
NQMA-EXPERIMENTS-04 <strong>GSI</strong> SCIENTIFIC REPORT 2009<br />
The ppK − Experiment at <strong>GSI</strong> ∗<br />
M. Berger 1 , L. Fabbietti 1 , R. Münzer 1 , and the FOPI Collaboration<br />
1 TU München - Excellence Cluster Universe, 85748 Garching<br />
Recently, the search for deeply bound nuclear states with<br />
antikaons has attracted large interest. As it is suggested by<br />
recent results by the DISTO collaboration from a reanalysis<br />
of older data p+p reaction might be a promising tool<br />
to produce (K − pp) nuclear bound states. Recent results of<br />
analysis gave an indication for the existence of this lightest<br />
kaonic bound state (Ref. [1]). New experiments have<br />
been proposed to study this kind of physics and a measurement<br />
was performed in October 2009 using the FOPI detector<br />
[2] to detect the final state particles in the reaction<br />
p+p→(K − pp) + K + → Λp K + → p + π − + p + K + . By<br />
the measurement of all charges particles the binding energy<br />
of the (K − pp) could be determined by the missing mass of<br />
the K + and the invariant mass of Λp.<br />
In the experiment in October 2009 a proton beam with a<br />
beam energy of 3.1 GeV and liquid hydrogen target with 2<br />
cm thickness was used. To improve the tracking capability<br />
in the forward direction and reduce background events the<br />
additional detector SiΛViO (Silvion for Λ Vertexing and<br />
Identification Online) was put inside FOPI directly after the<br />
target. This detector consists of two layers of segmented<br />
silicon detectors that cover the polar region from 10 ◦ to<br />
35 ◦ , that are used to create a trigger signal and one additional<br />
track point. The trigger signal is created by measuring<br />
the hit-multiplicity in the two layer, which should be<br />
higher in the second layer in the case of a Λ that has decayed<br />
between the two layers.<br />
The trigger signal of SiΛViO combined with the first level<br />
Figure 1: Momentum times charge measurement versus<br />
time-of-flight. The signal for K + could be separated up<br />
to 0,7 GeV<br />
c<br />
Trigger condition, which requires at least 2 charged particles<br />
in the time of flight detectors, was used to generate<br />
232<br />
∗ Work supported by HGF and DFG-Excellence Cluster Universe<br />
the second level trigger (LVL2). During this measurement<br />
about 80 million second level trigger events were recorded.<br />
A crucial point for the reconstruction of the interesting decay<br />
channel is the identification of K + , which is been done<br />
by time-of-flight and momentum measurement. The best<br />
time-of-flight resolution could be achieved by the Resistive<br />
Plate Chambers (RPC). Figure 1 shows the particle momentum<br />
against the particle velocity. From this picture one<br />
can see, that the separation of K + is possible up to momentum<br />
of 0.7 GeV<br />
c .<br />
The second crucial point is the identification of Λ-particles<br />
Figure 2: Invariant-mass of pπ − emitted under small polar<br />
angles, which were detected by SiΛViO, Helitron and<br />
PLAWA<br />
which are emitted under small polar angles. To improve<br />
the secondary vertex resolution the trackpoint in SiΛViO is<br />
used to improve the track resolution. By using geometrical<br />
and momentum cuts a first Λ signal in the invariant mass<br />
spectrum of pπ− could be be seen. In the upper picture<br />
of Fig. 2 can see the signal together with the combinatorial<br />
background in red, calculated exploiting the mixed<br />
event technique. The difference of the both shows a peak<br />
at 1,119 GeV<br />
c2 with a sigma of 8,2 MeV<br />
c2 and 0.7· 104 Λ-<br />
Hyperon per event.<br />
References<br />
[1] M.Maggiora, Proceedings of the ’Hypernuclear and Strange<br />
Particle Physics’ conference, Tokai, 2009<br />
[2] http://www.gsi.de/documents/DOC-2007-Mar-168-1.pdf
<strong>GSI</strong> SCIENTIFIC REPORT 2009 NQMA-EXPERIMENTS-05<br />
Start counter and target system for the FOPI S349 experiment ∗<br />
P. Bühler 1 , O. Hartmann 1 , M. Schafhauser 1 , K. Suzuki 1 , J. Zmeskal 1 , and FOPI collaboration .<br />
In summer 2009 the FOPI collaboration carried out experiment<br />
S349. This experiment aims at investigating<br />
the potential existence of the most fundamental antikaonnucleon<br />
bound state, the K − pp [1]. The antikaon is predicted<br />
to form nuclear bound states, because of the strongly<br />
attractive interaction between the antikaon and nucleon [2].<br />
The verification of the existence of this bound state with<br />
a reliable experiment is of vital importance and will shed<br />
light on the nature of the KN interaction.<br />
To investigate the properties of the system K − pp we exploited<br />
the reaction<br />
p + p → K + + K − pp → K + + Λ + p (1)<br />
at 3.1 GeV incident proton energy. In 42 shifts approximately<br />
80 · 10 6 level 2 trigger events were acquired. The<br />
data analysis is in progress.<br />
The experiment with a proton beam poses specific requirements<br />
to the detectors and the original FOPI setup<br />
therefore needed some modifications. The new hardware<br />
developments for this experiment include a start counter,<br />
a Beam Profile Monitor (BPM), a veto detector, a liquidhydrogen<br />
target, and a Λ-trigger. A schematic layout of the<br />
beam line with the various elements is presented in Figure<br />
1. The whole setup was mounted upstream of the FOPI<br />
CDC such that the target center was placed at −40 cm upstream<br />
from the CDC center.<br />
The Λ-trigger is a detector system which allows to select<br />
events with Λ hyperon production on the hardware level<br />
and thus enhances the number of potentially interesting<br />
events in the acquired data. It was build at the TU Munich<br />
and has been presented in a previous report [3].<br />
The start counter needed to be sensitive to MIPs and<br />
was required to provide a time resolution of around 100 ps<br />
at counting rates of up to a few times 10 6 counts per second.<br />
We used a 1 cm thick scintillating detector consisting<br />
of 5 vertically arranged, 2 mm wide segments. Each segment<br />
was readout on both ends with PMTs. Power supply<br />
boosters were used for the last three dynodes of the PMTs<br />
which helps to keep the gain high at high rates. The magnetic<br />
field strength at the location of the start counter is<br />
still around 60 mT. In order to work safely the PMTs were<br />
magnetically shielded with iron tubes and were mounted in<br />
an iron box. With this setup an intrinsic time resolution of<br />
≈ 130 ps was achieved at a rate of up to 2 · 10 6 1/s.<br />
The liquid hydrogen target system consisted of a cryogenic<br />
cooler and a cylindrical target volume with a radius<br />
and width of 1.5 cm. For space reasons and to keep the<br />
cryogenic part outside the main magnetic field the cryogenic<br />
setup was mounted upstream, just outside of the mag-<br />
∗ Work supported by FWF project P21457-N16<br />
1 SMI, Vienna, Austria<br />
net yoke of the CDC. The target volume was connected to<br />
the cold head via a thin tube, through which the liquefied<br />
hydrogen was, driven by gravity, flowing into the target volume.<br />
It took roughly 8 hours to cool down and completely<br />
fill the target volume. One filling was sufficient for the entire<br />
beam time.<br />
The veto detector was located close (upstream) to the<br />
target and vetoed data acquisition when charged particles<br />
penetrated off beam-axis. It confined the cross-section of<br />
the fiducial target volume to a circle with a diameter of<br />
1 cm. The counter consisted of two 5 mm thick layers<br />
of scintillating material which both were split into 2 segments.<br />
For readout fine-mesh PMTs were used because of<br />
the magnetic field of 0.6 T. The veto PMTs were also operated<br />
with boosters and additionally shielded with three<br />
layers of mu-metal. The veto efficiency was above 98%.<br />
For this experiment we required the protons to be delivered<br />
with high precision onto the target. For beam tuning<br />
we needed a device which allowed to monitor the position<br />
and profile of the beam. The equipment for beam diagnostics<br />
in Cave-B is not suited for protons of 3.1 GeV. For this<br />
reason we developed a Beam Profile Monitor (BPM). The<br />
BPM consist of a mesh of 16+16 scintillating fibers which<br />
are read out by Silicon Photo-multipliers (SiPM) [4]. The<br />
active area is 3.2 × 3.2 cm 2 . After setup of the beam the<br />
BPM was lifted out of the beam for data taking.<br />
p<br />
start<br />
counter<br />
BPM<br />
cryogenics<br />
Veto & target<br />
FOPI CDC<br />
Lambda<br />
trigger<br />
Figure 1: Layout of the beam line for the p + p experiment<br />
showing the position of the start counter, BPM, veto<br />
detector, target, and Λ-trigger<br />
References<br />
[1] K. Suzuki et al., Nucl. Phys. A 827 (2009) 312.<br />
[2] T. Yamazaki and Y. Akaishi, Physical Review C 76 (2007)<br />
045201.<br />
[3] M. Berger et al., <strong>GSI</strong> Jahresbericht 2008, INSTRUMENTS-<br />
METHODS-24.<br />
[4] K. Suzuki et al., Nucl. Instr. and Methods A 610 (2009) 75.<br />
233
NQMA-EXPERIMENTS-06 <strong>GSI</strong> SCIENTIFIC REPORT 2009<br />
Wavelets decomposition properties in the vicinity of Gibbs instabilities<br />
Abstract: Applicability of the wavelet decomposition<br />
method for detection of a mass lines on some complicated<br />
background just above the reaction phase space<br />
limit has been investigated. A possibility of circumventing<br />
so-called Gibbs instability by means of artificial<br />
background prolongation is reported.<br />
Introduction<br />
Wavelet analysis (WA) can be used for disentangling<br />
useful signals from statistical fluctuations [1]. The decomposition<br />
can be performed in a chosen basis of wavelets<br />
(similar to Legendre polynomials analysis). For this report<br />
a set of second derivatives of Gaussian function (mexican<br />
hat shaped functions) has been used as a basis. Significant<br />
and the most interesting structures resulting from WA are<br />
usually being deformed near the edge of the analysed distribution<br />
[2]. A method of removing this Gibbs instability<br />
is reported.<br />
Figure 1: Invariant mass distribution to be analysed is<br />
shown in (a). The result of the wavelet analysis is presented<br />
(b). The red line marks scale limit above which searched<br />
structures (0,1,2,3) can be observed.<br />
Invariant mass spectrum analysis<br />
A partially resolved invariant mass distribution measured<br />
by FOPI group in one of numerous beam times<br />
has been kindly provided by Norbert Herrmann (Fig.1a).<br />
Wavelets decomposition graph is presented in Fig.1b. The<br />
largest scale parameter values (around 1) correspond to<br />
a bulk structure of the analysed distribution and are attributed<br />
to the background. The scale parameter values<br />
below 10 −2 are interpreted as noise. The middle part<br />
(scale between 10 −1 and 10 −2 ) shows several remarkable<br />
structures. These are usually signatures for significant, althought<br />
invisible peaks in the measured spectrum. Well<br />
visible objects 1 and 2 are attributed to hidden mass peaks,<br />
while interpretation of number 0 and 3 (towards both ends<br />
of the distribution) is not yet established, because of the<br />
234<br />
P. Koczoń 1 , S. Lebedev 1,2 , and G. Ososkov 2<br />
1 <strong>GSI</strong>, Darmstadt, Germany; 2 JINR, Dubna, Russland<br />
deteriorating influence of Gibbs instabilities, an artefact of<br />
WA. Gibbs instabilities can be at least partially removed<br />
by an artificial extension of measured spectrum by means<br />
of, for example, symmetrization or just prolongation with<br />
flat, white-noise-like continuation avoiding an abrupt end<br />
of the distribution. The last method has been investigated<br />
by simulation using a broad Gaussian distribution with a<br />
small gaussian peak (”signal”) placed on its tail and shifted<br />
in several steps. For each position of the simulated ”signal”<br />
the WA has been performed and the corresponding<br />
structure in the resulting graph has been characterised by<br />
its maximum value, width, position and integral. The<br />
same procedure has been repeated for ”signal” on Gaussian<br />
distribution ”improved” by a white-noise pedestal. Fig.2<br />
presents a comparison of the simulations’ results.<br />
Figure 2: Wavelets Analysis results obtained with simulated<br />
input data: signal on a gaussian-shaped background<br />
distribution (blue) compared to signal on the same<br />
background, improved by introduction of the randomised<br />
pedestal (pink), where no Gibbs effect is expected. Maximum<br />
value of the resulting WA structure, corresponding to<br />
the signal strength, stays constant towards the left edge of<br />
the distribution in case of the extended distribution.<br />
Summary<br />
In the simulation it has been shown, that Gibbs instability<br />
occuring in the WA at edges of analysed distribution<br />
can be circumvented by introduction of a simple flat,<br />
white-noise-like pedestal underneath of the distribution to<br />
be analysed.<br />
References<br />
[1] http://www.amara.com/current/wavelet.html<br />
[2] http://cnx.org/content/m10092/latest/
<strong>GSI</strong> SCIENTIFIC REPORT 2009 NQMA-EXPERIMENTS-07<br />
e + e − production in NN collisions at 1.25 GeV<br />
I. Fröhlich 1 , T. Galatyuk ∗1 , and J. Stroth 1 for the HADES Collaboration<br />
Di-electron production in N+N collisions at Ekin <<br />
5 GeV/u was studied previously by the DLS collaboration<br />
[1] and have been available for about 10 years, although<br />
with limited statistics and mass resolution. Microscopic<br />
transport calculation, hovewer, never succeeded<br />
to explain the experimental data satisfactory until a strong<br />
bremsstrahlung contribution in n+p interactions has been<br />
recently predicted within the framework of a covariant One<br />
Boson Exchange (OBE) model [2]. The authors choose<br />
the free parameters of their theory similar to the ones used<br />
in [3], but the restoration of the gauge invariance (for n+p)<br />
has been realized in a different way. This leads to different<br />
types of the form factors and quite different results. Indeed,<br />
it is found to differ by a factor of 4 for n+p interactions, but<br />
also by a factor of about 2 for p+p reactions at 1 GeV kinetic<br />
beam energy compared to the ones of Ref. [3]. As the<br />
NN bremsstrahlung process as included in the new OBE<br />
calculations from Kaptari et al. [2] is widely discussed in<br />
context with the interpretation of the 12 C+ 12 C data, we<br />
should have a closer look on the comparison of these calculations<br />
to the HADES data for p+p and n+p interactions.<br />
]<br />
2<br />
[ μb/GeV/c<br />
ee<br />
dσ/dM<br />
10<br />
10<br />
10<br />
10<br />
2<br />
1<br />
-1<br />
-2<br />
-3<br />
10<br />
-4<br />
0 10<br />
0<br />
200<br />
0.2<br />
400<br />
0.4<br />
600<br />
0.6<br />
M<br />
800 1000<br />
0.8 1<br />
2<br />
[GeV/c ]<br />
1 Goethe - Universität Frankfurt am Main, Germany;<br />
p + p 1.25 GeV<br />
o<br />
θ + - > 9<br />
e e<br />
π0<br />
Δ<br />
OBE K&K<br />
OBE S&M<br />
Figure 1: Invariant mass distribution of electron pairs measured<br />
in p+p reactions at a beam energy of 1.25 GeV [4].<br />
The dashed and long-dashed lines show the contributions<br />
of π 0 and ∆ Dalitz decays, respectively, in simulations using<br />
the resonance model. The enhancement due to the N-<br />
∆ transition form factor is shown as the grey area. The<br />
dashed and full lines are the results of OBE models [3] and<br />
[2], respectively.<br />
The di-electron yield measured in p+p and n+p reactions<br />
is presented in Figs. 1 and 2, respectively. The theoretical<br />
curves show results of model calculations with the<br />
Pluto event generator [5]. At low masses a prominent<br />
π 0 → e + e − γ peak dominates the spectra. In the case of<br />
the p+p reaction, the region of invariant masses larger than<br />
∗ Work supported by Helmholtz Alliance HA216/EMMI<br />
ee<br />
]<br />
2<br />
[ μb/GeV/c<br />
dσ/dM<br />
ee<br />
10<br />
10<br />
1<br />
-1<br />
-2<br />
10<br />
-3<br />
10<br />
-4<br />
quasi-free n + p 1.25 GeV<br />
+ e e<br />
o<br />
- > 9<br />
0<br />
10<br />
0<br />
200<br />
0.2<br />
400<br />
0.4<br />
600<br />
0.6<br />
800<br />
0.8<br />
1000<br />
1<br />
M<br />
2<br />
[GeV/c ]<br />
θ<br />
π0<br />
Δ + η<br />
η<br />
OBE K&K + η<br />
OBE S&M + η<br />
Figure 2: Invariant mass distribution of electron pairs measured<br />
in quasi-free n+p reactions at a beam energy of<br />
1.25 GeV/u [4], same notations as in Fig. 1. Note, that<br />
the η contribution has been added to the OBE model calculations.<br />
0.15 GeV/c 2 is well described by the simulation of the ∆<br />
Dalitz decay. A more accurate description is expected from<br />
the OBE models, since all amplitudes (graphs) involving<br />
intermediate ∆ or nucleons are treated coherently. The predictions<br />
of [3] (dashed line) are in good agreement with the<br />
data, but the OBE model [2] (full line) overestimates the<br />
data. In case of n+p reaction, the resonance model simulation<br />
underestimates the measured dilepton yield. However,<br />
no satisfactory agreement is achieved either by the OBE<br />
exchange models. The yield in the high-mass region is too<br />
low and in the π 0 region the di-electron yield is unfortunately<br />
not calculated.<br />
Our data for the invariant-mass spectrum in the reaction<br />
np → npe + e − , extracted from the tagged subreaction<br />
in dp → pspnpe + e − , point to a shoulder at intermediate<br />
values of the di-electron invariant mass. Such a structure<br />
is hardly described within the hitherto models. As it<br />
has been shown, understanding the elementary channels remains<br />
challenging.<br />
Acknowledgments: The authors are grateful to<br />
F. Iachello, R. Shyam, J. Van de Wiele and B. Martemyanov<br />
for the fruitful discussions.<br />
References<br />
[1] W.K. Wilson et al., Phys. Rev. C 57 (1998) 1865.<br />
[2] B. Kämpfer and L.P. Kaptari, Nucl. Phys. A 764 (2006) 338.<br />
[3] R. Shyam and U. Mosel, Phys. Rev. C 67 (2003) 065202.<br />
[4] G. Agakishiev et al., arXiv:0910.5875 [nucl-ex].<br />
[5] I. Froehlich et al., arXiv:0909.5373 [nucl-ex].<br />
ee<br />
235
NQMA-EXPERIMENTS-08 <strong>GSI</strong> SCIENTIFIC REPORT 2009<br />
First ω-meson Production Cross Sections in the Leptonic and Hadronic Decay<br />
Channels in pp Collisions at 3.5 GeV ∗<br />
K. Teilab 1 , A. Tarantola 1,2 , I. Fröhlich 1 , T. Galatyuk 1,2 , R. Holzmann 2 , M. Lorenz 1,2 , J. Markert 1,2 ,<br />
C. Müntz 1,2 , A. Rustamov 2 , H. Ströbele 1 , J. Stroth 1,2 , and C. Sturm 1,2<br />
1 2 Institut <strong>für</strong> Kernphysik, Goethe-Universität, Frankfurt, Germany; <strong>GSI</strong> <strong>Helmholtzzentrum</strong> <strong>für</strong> <strong>Schwerionenforschung</strong><br />
GmbH, Darmstadt, Germany<br />
The inclusive and exclusive ω-meson production cross<br />
sections are presented. These are analysis results of the<br />
proton-proton run performed by HADES in 2007, with a<br />
3.5 GeV proton beam on a liquid hydrogen target. The resulting<br />
e + e − invariant-mass spectrum is an important reference<br />
for the study of vector meson production off the<br />
nucleus, recently performed by the HADES in p+Nb reactions<br />
at the same beam energy. We observe a prominent<br />
signal at the ω mass in the invariant-mass spectrum,<br />
in Fig. 1. More than 65 × 10 3 pairs have been obtained<br />
in the total mass range and 250 pairs in the ω region. The<br />
ω meson peak shows a mass resolution of 15.3 MeV/c 2<br />
and its pole mass has been fitted to be 0.761 GeV/c 2 . It<br />
is shifted by 20 MeV/c 2 on the lower side. If we take<br />
energy loss of electrons into account, the position of the<br />
ω peak agrees with the expected value. The spectrum has<br />
been corrected by detector inefficiencies on a pair-by-pair<br />
basis, defined as the product of single-electron inefficiencies<br />
deduced from dedicated Monte-Carlo events embedded<br />
into real events [1, 2] and normalized to pp elastic scattering<br />
events, which were simultaneously measured. The<br />
preliminary ω inclusive production cross section has been<br />
extracted to be σω = 0.285 mb±0.070 mb. Using the same<br />
Figure 1: Invariant mass distribution of electron pairs measured<br />
in the acceptance of HADES in pp collisions at<br />
3.5 GeV beam kinetic energy. The lines show various contributions<br />
from a HSD simulation which takes all known<br />
sources into account.<br />
data, we studied the hadronic ω-decay into three pions in<br />
the exclusive channel (pp → ppπ + π − π 0 ). The charged<br />
∗ For the HADES Collaboration. This work has been supported by the<br />
BMBF (Contract Nr. 06FY171) and the Helmholtz Research School.<br />
236<br />
particles were identified through their characteristic energy<br />
deposition in the multi-wire drift chambers, whereas the<br />
neutral pion was identified by means of the missing mass<br />
method. Fig. 2 shows the invariant mass distribution of the<br />
identified 3 pions. In order to determine the true number of<br />
reconstructed ω-mesons, a PLUTO [3] simulation of the reaction<br />
pp → ppω → ppπ + π − π 0 was done. The effects of<br />
detector efficiency and acceptance were taken into account<br />
by a full of GEANT digitization. By running through the<br />
same analysis chain as for real data, effects e.g. due to track<br />
reconstruction efficiency were also included. The shape of<br />
the ω peak as determined from the simulation is then scaled<br />
to fit the data peak, whereas the non resonant background is<br />
fitted by a polynomial function. The position and width of<br />
the simulated peak are not modified. One can see that the<br />
simulated peak fits well, which shows that detector performance<br />
is well understood. The total number of ω mesons in<br />
25000<br />
20000<br />
15000<br />
10000<br />
5000<br />
400<br />
0<br />
500 600 700 800 900 1000 1100 1200<br />
2<br />
M + - 0 π π π [MeV/c ]<br />
Figure 2: The invariant mass distribution of the identified 3<br />
pions (data points). The red dashed line represents the simulated<br />
signal shape, the blue line is a fit to both the signal<br />
and background. The background function is indicated in<br />
green. The peak is positioned at 781 MeV/c 2 with a width<br />
of 15.4 MeV/c 2 . (colors online)<br />
the peak is about 62×10 3 . The resulting exclusive production<br />
cross section is 0.130 mb ± 0.030 mb to be compared<br />
to 0.285 mb ± 0.070 mb for the inclusive cross section obtained<br />
from electron pairs.<br />
References<br />
[1] G. Agakishiev et al, (HADES Collab.), Phys. Rev. Lett. 98,<br />
052302 (2009).<br />
[2] G. Agakishiev et al, (HADES Collab.), Phys. Rev. Lett. B663,<br />
43 (2009).<br />
[3] I. Fröhlich et al., arXiv:0909.5373 [nucl-ex.] (2009).
<strong>GSI</strong> SCIENTIFIC REPORT 2009 NQMA-EXPERIMENTS-09<br />
<strong>GSI</strong>Temp late2007<br />
Exclusive ppe + e – channel from p+p reaction at 1.25 GeV<br />
W. Przygoda 1 for the HADES Collaboration<br />
1 Smoluchowski Institute of Physics, Jagiellonian University, 30-059 Kraków, Poland<br />
The experimental run of p+p at 1.25 GeV took place in<br />
April 2006. The beam energy was selected below η<br />
meson production threshold in order to favour<br />
production and investigate the Dalitz decay:<br />
. The identification of three particles ( ,<br />
, ) allows for the exclusive reconstruction of<br />
Dalitz decay channel under two conditions: a) invariant<br />
mass for rejection of the<br />
decay followed by the Dalitz decay; b) selection of<br />
the missing mass of , , close to the proton<br />
mass (Fig. 1) as a signature of the exclusive<br />
channel identification. All spectra are normalized<br />
to the number of produced mesons (see [1]).<br />
Fig. 1. ( , , ) missing mass (for )<br />
compared to simulated Dalitz decay channel (blue line).<br />
In the simulation (PLUTO event generator [2], followed<br />
by the full GEANT HADES spectrometer simulation,<br />
the reconstruction and analysis) we use a resonance<br />
model [3]. Two channels ( Dalitz decay and Dalitz<br />
decay – with implementation of the OBE model of Delta<br />
production [4] and Delta decay model [5]) are sufficient<br />
to describe the invariant mass spectrum of (p-p<br />
bremsstrahlung is negligible). The simulation is used to<br />
apply acceptance corrections to the measured events and<br />
finally deduce the Dalitz decay branching ratio. The<br />
integrated yield for is not sensitive to<br />
the transition form factor model [5], so the main<br />
model-dependent uncertainty will come from the description<br />
of the angular distributions.<br />
The signal to background ratio for<br />
ranges from 5 to 10 (CB is very low) and the number of<br />
the reconstructed signal pairs , after the<br />
( ) selection. It is<br />
important to prove that the data reveal the resonance<br />
properties despite the unavoidable smearing due to the<br />
proton not coming from the decay. Firstly, the measured<br />
( , , ) system invariant mass and angular production<br />
distribution (Fig. 2) are in good agreement with simulation<br />
which indicates the resonant origin of the observed events.<br />
Fig. 2. ( , , ) system invariant mass (left) and angular<br />
distribution (acceptance and efficiency corrected) in<br />
the CM rest frame (right), compared to the simulation<br />
(blue line) based on the OBE model [4].<br />
Another useful quantity is the helicity angle - between<br />
leptons in the rest frame and the itself, when both<br />
leptons and are boosted to the rest frame at first.<br />
Fig. 3. Helicity angle (acceptance and eff. corrected).<br />
The blue line is a fit , .<br />
Fig. 3 shows the (acceptance and efficiency corrected)<br />
helicity spectrum, which is anisotropic and in agreement<br />
with the distribution expected from the QED,<br />
when neglecting the Coulomb transition amplitude [6].<br />
This is, again, the hint that the Dalitz decay channel has<br />
been reconstructed. Also the branching ratio is in agreement<br />
with the value predicted by the QED calculations<br />
( ) within 9% (stat.) and less than 20% syst. (to<br />
be verified) error. The comparison of the exclusive 3prong<br />
analysis in p+p and quasi-free n+p @ 1.25 GeV<br />
will shed more light on the nature of the pair excess<br />
(measured in np) and the role of the N-N bremsstrahlung.<br />
References<br />
[1] G. Agakishiev et al., arXiv:0910.5875 [nucl-ex]<br />
[2] I. Fröhlich et al., arXiv:0909.5373 [nucl-ex].<br />
[3] Z. Teis et al., Z. Phys. A356, 421 (1997).<br />
[4] V. Dmitriev et al., Nucl. Phys. A459, 503 (1986)<br />
[5] M. I. Krivoruchenko et al., Phys. Rev. D65, 017502<br />
(2002); M. Zetenyi et al., arXiv:0202047 [nucl-th].<br />
[6] E.L.Bratkovskaya et al., Phys. Lett. B348, 283 (1995).<br />
237
NQMA-EXPERIMENTS-10 <strong>GSI</strong> SCIENTIFIC REPORT 2009<br />
Lepton identification using a multivariate classification method<br />
M. Lorenz1,2 , R. Holzmann1 ,K.Göbel2 , J. Markert2 , T. Galatyuk2 , J. Stroth1,2 , A. Rustamov1 , and<br />
the HADES collaboration.<br />
1 2 <strong>GSI</strong>, Darmstadt, Germany; University Frankfurt, Germany<br />
In September 2005 the HADES collaboration measured<br />
the collision system Ar+KCl at 1.76 AGeV. Compared to<br />
the previous lower multiplicity runs pp and CC, the larger<br />
data set and the search for ever smaller signals, namely the<br />
vector mesons ρ, ω and φ, it has become essential to extract<br />
a maximum of information from the data.<br />
Therefore a multivariate classification method (MVA)<br />
[1] based on machine learning techniques has been applied<br />
to lepton identification [2] and finalized for the ArKCl data<br />
set during the year 2009.<br />
Figure 1: Schematic flow chart of the MVA method<br />
The concept of such a multivariate classification is that<br />
instead of applying a set of boolean cuts serially to the data<br />
one feeds all cut criteria into an algorithm which provides<br />
one scalar response value, used to decide whether it is a<br />
true lepton track or not, as illustrated in picture 1. Therefore<br />
a track with a fluctuation in one of the selection criteria<br />
but with acceptable values in all other criteria will not be<br />
discarded. The processing is done in the following steps:<br />
Before analyzing the data, the algorithm has to be trained<br />
with pure signal and background samples of the data being<br />
classified. These pure samples are obtained by asking for<br />
a very precise matching of a ring in the RICH detector to<br />
a reconstructed trajectory in the spectrometer. Afterwards,<br />
different sets of variates in diverse ranges were tested as<br />
well as all provided algorithms from the toolkit for multivariate<br />
analysis (TMVA) [3], a root package from CERN<br />
and a neural network performed best.<br />
After the training of the network, the algorithm is applied<br />
to the data selecting lepton candidates, followed by<br />
a wide cut on the RICH-MDC matching and a selection of<br />
reconstructed tracks, cleaning up those who share one or<br />
238<br />
MVA<br />
hardcut<br />
electrons positrons<br />
Figure 2: Momentum times polarity distributions of single<br />
leptons measured in pNb. Black line - result of the analysis<br />
of hard cuts, blue line - MVA.<br />
more of the same detector hit. Finally, on the pair analysis<br />
level, a condition on the opening angle of a lepton pair<br />
> 9 o and on an other reconstructed track within an angle<br />
of also > 9 o is asked to suppress leptons originating from<br />
conversion in the detector material.<br />
Using MVA the dilepton reconstruction efficiency increased<br />
throughout the whole phase space, compared to the<br />
method of hard cuts, resulting in a factor two more reconstructed<br />
ω mesons compared to the pervious setting of the<br />
MVA network having the same signal to background ratio.<br />
The same multivariate classification method was applied<br />
for the new p+Nb data measured in September 2008. First<br />
preliminary results show a higher purity of the single lepton<br />
sample compared to the hard cut online analysis, as one can<br />
see from the momentum distribution of leptons in figure 2.<br />
References<br />
[1] A. Hocker et al., PoS A CAT (2007) 040<br />
[arXiv:physics/0703039].<br />
[2] S. Lang, doctoral thesis, Frankfurt (2008).<br />
[3] http://tmva.sourceforge.net
<strong>GSI</strong> SCIENTIFIC REPORT 2009 NQMA-EXPERIMENTS-11<br />
Study of rare resonances in p+p with HADES ∗<br />
E. Epple, L. Fabbietti, A. Schmah, and J. Siebenson for the HADES Collaboration<br />
The analysis results of a high statistics proton-proton run<br />
at 3.5 GeV beam energy, measured by HADES in April<br />
2007, will be presented. We have reconstructed the strange<br />
resonances Σ(1385) + , Λ(1405) and the Λ(1520).<br />
Reconstructing the Σ(1385) +<br />
The Σ(1385) + is produced via the following reaction<br />
TU München - Excellence Cluster Universe, 85748 Garching<br />
p+p ⇒ Σ(1385) + +K + +n → (Λ+π + )+K + +n (1)<br />
Events with the four detected particles K + , π + , p, π − ,<br />
were selected for the analysis. The particles were identified<br />
by dE/dx and mass cuts. The missing mass of all<br />
charged particles had to be within a range of 914 MeV<br />
< MM K + ,π + ,p,π − < 962 MeV, to fulfill the event condition.<br />
If this was the case, a kinematic refit [1] has been<br />
applied to the data, using as a constraint that the total missing<br />
mass had to be the neutron mass. On the refitted sample<br />
a further cut was applied. Data were accepted, if the invariant<br />
mass of p and π − was in the Λ mass region (1009.7<br />
MeV < M p,π − < 1119.7 MeV). Additional track cuts on<br />
the p and π − geometry were applied to increase the Λ signal<br />
to background ratio. By combining the selected Λ and<br />
a π + , one obtains a clear signal of the Σ(1385) + . Figure<br />
1 shows this signal after the subtraction of the combinatorial<br />
background. The triangles show a measurement of the<br />
Σ(1385) + by [2], which is in well agreement with our data.<br />
Reconstructing the Λ(1405)<br />
The Λ(1405) is produced via the following reaction:<br />
p+p ⇒ Λ(1405)+K + + p → (Σ ± + π ∓ )+K + + p (2)<br />
The analysis however is not exclusive as a nearby resonance,<br />
the Σ(1385) 0 also decays into the same particles.<br />
Both resonances are close in their mass and very<br />
broad, so that they completely overlap in the p, K + missing<br />
mass spectrum. The branching ratio for the decay of<br />
Σ(1385) 0 → Σ ± + π ∓ is however small compared to the<br />
Λ(1405) decay. Thus the contribution of the Σ(1385) 0 to<br />
the p, K + missing mass spectrum is only a few percent and<br />
can be subtracted. Events with a p, K + , π + , π − , were<br />
selected, as described above. Again a missing neutron was<br />
required from the decay Σ ± → nπ ± . After applying the<br />
neutron mass cuts, the remaining events were kinematically<br />
refitted, like in the Σ(1385) + analysis. The refitted sample<br />
was used to plot the missing mass of p, K + , π ∓ which<br />
shows a signal of Σ ± with a signal to background ratio of<br />
about 1. For the final spectra events with a MM p,K + ,π ∓<br />
∗ Work supported by HGF and DFG-Excellence Cluster Universe<br />
Figure 1: Invariant mass of Λπ + , showing a clear signal of<br />
the Σ(1385) + . The triangles correspond to a measurement<br />
of Baubillier [2], which is in well agreement with our data.<br />
in the Σ ± mass region were used to plot the missing mass<br />
of p, K + . Figure 2 shows the result of this analysis after<br />
subtracting the background. A clear signal of Λ(1405) and<br />
Λ(1520) can be seen.<br />
Figure 2: The missing mass of p, K + after the event selection<br />
and background subtraction. A clear peak of Λ(1405)<br />
and Λ(1520) can be seen. Not included are systematic errors.<br />
References<br />
[1] P. Avery, http://www.phys.ufl.edu/simavery/fitting.html<br />
[2] M. Baubillier et al. Z.Phys. C23 (1984)213<br />
239
NQMA-EXPERIMENTS-12 <strong>GSI</strong> SCIENTIFIC REPORT 2009<br />
Dilepton production in 1.756 GeV/u 40 Ar+KCl reactions ∗<br />
R. Holzmann 1 , M. Jurkovic 2 , F. Krizek 3 , and M. Lorenz 1,4 for the HADES collaboration<br />
1 <strong>GSI</strong>, Darmstadt, Germany; 2 TUM, Garching, Germany; 3 UJF, Rez, Czech Republic; 4 Uni Frankfurt, Germany<br />
During the year 2009 the dielectron analysis of our 2005<br />
40 Ar+KCl run at 1.756 GeV/u has been finalized. This<br />
experiment provided data for a moderately large collision<br />
system, allowing to continue our studies of dilepton production<br />
started with the light 12 C+ 12 C system [1], as well<br />
as in the elementary p + p and d + p reactions [2]. We can<br />
now address the evolution with beam energy and system<br />
size of the so-called pair excess, first observed by the DLS<br />
in the mass range of 0.15 - 0.50 GeV/c 2 [3].<br />
Spectroscopy of the vector-meson region was started<br />
with this data set as well. The reconstructed dielectron<br />
invariant-mass distribution shows for the first time at SIS<br />
energies a clear ω peak, providing thus new and valuable<br />
constraints for transport models.<br />
]<br />
-1<br />
)<br />
2<br />
[(GeV/c<br />
ee<br />
dN/dM<br />
0<br />
π<br />
1/N<br />
10<br />
10<br />
10<br />
10<br />
10<br />
-3<br />
-4<br />
-5<br />
-6<br />
-7<br />
0 π<br />
Ar + KCl 1.76 GeV/u<br />
θ<br />
e<br />
o<br />
- e > 9 , 0.1< p 0.15<br />
GeV/c 2 and the measured excess above the calculated η<br />
Dalitz is thought to quantify the radiation from the early<br />
phase of the collision. Fig. 2 shows the excess multiplicity<br />
of 0.15 < Mee < 0.50 GeV/c 2 dileptons for all collision<br />
systems studied so far by HADES and DLS, together<br />
with the corresponding neutral meson multiplicities measured<br />
by the former TAPS experiment at <strong>GSI</strong>. This systematics<br />
allows to study the beam-energy as well as the (nontrivial)<br />
system-size dependence of the electromagnetic radiation<br />
from the nuclear medium. Further progress will be<br />
made by extending next our measurements to heavy reaction<br />
systems like Ag+Ag and Au+Au.<br />
π<br />
Multiplicity in 4<br />
10 C+C, Ca+Ca<br />
-1<br />
10<br />
-3<br />
10<br />
-5<br />
10<br />
-7<br />
0 π<br />
η<br />
excess<br />
η<br />
Dalitz<br />
Ca+Ca<br />
C+C<br />
10<br />
0 1 2<br />
E [GeV/u]<br />
beam<br />
Ar+KCl<br />
} × 2.7<br />
} × 2.4<br />
} × 5<br />
Figure 2: Multiplicity of the pair excess as function of<br />
beam energy and system size (full triangles), together with<br />
π 0 and η multiplicities from TAPS 2-photon measurements.<br />
DLS data points [3] are shown as open triangles.<br />
References<br />
[1] G. Agakichiev et al., HADES collaboration, Phys. Lett. B<br />
663, 43 (2008) and Phys. Rev. Lett. 98, 052302 (2007).<br />
[2] G. Agakichiev et al., HADES collaboration,<br />
arXiv:0910.5875.<br />
[3] R. J. Porter et al., DLS collaboration, Phys. Rev. Lett. 79,<br />
1229 (1997).<br />
[4] G. Agakichiev et al., HADES collaboration, Phys. Rev. C 80,<br />
025209 (2009).
<strong>GSI</strong> SCIENTIFIC REPORT 2009 NQMA-EXPERIMENTS-13<br />
Upgrade of the HADES Experiment ∗<br />
S. Yurevich 1 for the HADES Collaboration<br />
1 <strong>GSI</strong> <strong>Helmholtzzentrum</strong> <strong>für</strong> <strong>Schwerionenforschung</strong> GmbH, 64291 Darmstadt, Germany;<br />
The HADES upgrade project aims at improving the<br />
granularity of the time-of-flight (TOF) system and the data<br />
rate capability to allow for the experiments with heavy<br />
ions at SIS18 and later at FAIR. In this report, we outline<br />
the current upgrade progress of the HADES experimental<br />
setup, in particular for the installation of the RPC chambers,<br />
the new MDC, the new RICH electronics, and its data<br />
acquisition system.<br />
The production and installation of all six Resistive Plate<br />
Chamber (RPC) [1] sextants into the HADES main frame,<br />
including the front-end electronics (FEE) and low voltage<br />
power supplies, has been finished (see Fig. 1). The installation<br />
of the DAQ-electronics has been completed for two<br />
sectors. The analysis of cosmic ray data shows an average<br />
time resolution of 80 ps (σ) and an acceptable low<br />
crosstalk. The average longitudinal position resolution is<br />
better than 10 mm (σ).<br />
Figure 1: Installed RPC chambers.<br />
The tracking system, consisting of 24 drift chambers is<br />
beeing upgraded with respect to (i) re-build of all 6 chambers<br />
of the first plane and (ii) replacing the copper-based<br />
digital part of the FEE by optical readout. The mounting<br />
of the newly built chambers has been finished after a comprehensive<br />
commissioning phase at the Forschungzentrum<br />
Dresden-Rossendorf.<br />
In order to meet the requirements for heavy collision systems<br />
at FAIR, the front-end readout has been completely<br />
replaced, using optical fibres thus keeping the induced<br />
noise occupancy below 0.1 %, equivalent to one noise hit<br />
per chamber per event and an increased data taking bandwidth<br />
of the system by a factor about 50. The new readout<br />
architecture relies on new optical driver cards interfacing<br />
the existing TDC boards mounted at the detector with plastic<br />
optical fibres (POF). This work is presently being accomplished,<br />
first tests confirmed the expected noise level<br />
∗ Work supported by EU grant 515876, 227431 and the BMBF<br />
reduction.<br />
The 28500 pads of the MWPC photon detector of the<br />
RICH will be equipped with new front-end electronic<br />
cards based on APV25 chips [2] with operation parameters<br />
adopted for gaseous detectors. Digitization is performed in<br />
new FPGA controlled ADC modules (ADCM) with optical<br />
fiber link to the DAQ system. The hardware production is<br />
finished and the modules are presently under test in Munich.<br />
A general overview of the architecture of the upgraded<br />
DAQ system can be found in [3]. Its basic component<br />
is the “Trigger and Readout Board” and detector-specific<br />
AddOn-boards.<br />
The trigger and data transport is organized by a new protocol<br />
named TRB-Net [4] which has been implemented on<br />
all the subsystems of the HADES detector. The new protocol<br />
has been successfully tested for the RICH and MDC<br />
subsystems. The coherent access over the network to the<br />
FEE cards (in particular for the MDC) allows for new monitoring<br />
methods [5].<br />
The components of the event building system (Gigabit<br />
Ethernet, parallel event building and run control) have been<br />
implemented and tested [6]. The ethernet interface to the<br />
TRB-Net is still under test.<br />
For the TOF detector, all AddOn boards have been produced.<br />
Currently the installation and integration of the new<br />
electronics is ongoing. The performance of the board is<br />
satisfactory. The achieved time resolution is on the level of<br />
80 ps, which is almost by a factor of 2 better than the old<br />
electronics.<br />
The AddOn board for the shower detector combines digital<br />
and analog electronics. A first prototype of the AddOn<br />
has been manufactured and tested in terms of electronic resolution<br />
and readout performance. The final production of<br />
all boards has been started.<br />
In summary, we reported on the status of the HADES<br />
upgrade. We expect that the final installation and commissioning<br />
will be finished in summer 2010.<br />
[1] A. Blanco et al, this volume<br />
References<br />
[2] M. Raymond et al, CERN/LHCC/2000-041, 130-134<br />
[3] I. Fröhlich et al, IEEE Trans.Nucl.Sci. 55 (2008) 59-66<br />
[4] J. Michel et al, this volume<br />
[5] B. Milanovic et al, this volume<br />
[6] S. Yurevich et al, this volume<br />
241
NQMA-EXPERIMENTS-14 <strong>GSI</strong> SCIENTIFIC REPORT 2009<br />
Centrality dependence of particle ratio fluctuations in Pb + Pb at 158 GeV<br />
H. Beck 1 , C. Blume 1 , J. Book 1 , V. Friese 2 , M. Ga´zdzicki 1 , C. Höhne 2 , D. Kresan 2 , M. Mitrovski 1 ,<br />
M. Pohl 1 , R. Renfordt 1 , T. Schuster 1 , R. Stock 1 , and H. Ströbele 1<br />
1 IKF, Goethe Universtität, Frankfurt am Main, Germany; 2 <strong>GSI</strong>, Darmstadt, Germany – for the NA49 collaboration<br />
Recent lattice QCD calculations expect a first order<br />
phase transition from hadronic to partonic degrees of freedom<br />
at finite temperature and baryon chemical potential<br />
[1]. This first order transition line ends with a critical<br />
endpoint. The search for either the first order phase transition<br />
or the critical endpoint is a challenging task in modern<br />
high energy heavy-ion physics.<br />
Dynamical fluctuations of the K/ ratio were proposed as a<br />
signature for the first order phase transition from hadronic<br />
to partonic degrees of freedom and the critical endpoint [2].<br />
The NA49 experiment [3] has measured the energy dependence<br />
of the K/ ratio fluctuations in central Pb+Pb collisions<br />
[4]. An increase of the fluctuations towards lower<br />
beam energies was observed. A possible explanation of<br />
this dependence was proposed in [2], namely scaling of the<br />
K/ ratio fluctuations with 1/ . In order to test this<br />
hypothesis one would like to measure the centrality dependence<br />
of this observable at fixed beam energy.<br />
The measured centrality dependence of the dynamical fluctuations<br />
of the K/ ratio in Pb + Pb collisions at 158 GeV<br />
beam energy is presented in figure 1 as a function of the<br />
average number of kaons in the acceptance .<br />
(%)<br />
K/<br />
dyn<br />
30<br />
25<br />
20<br />
15<br />
10<br />
5<br />
energy dependence (central collisions)<br />
centrality dependence at 158A GeV<br />
0<br />
0 10 20 30 40 50<br />
NK<br />
Figure 1: Dynamical<br />
fluctuations of the K/<br />
ratio as a function of<br />
in Pb + Pb collisions<br />
at 158 GeV<br />
beam energy (squares)<br />
and in central Pb + Pb<br />
collisions at all NA49<br />
energies (circles).<br />
From figure 1 one can conclude that the results of the<br />
energy and centrality dependences disagree at low number<br />
of kaons, which correspond to low centrality or low beam<br />
energy. Thus, the dynamical fluctuations are enhanced at<br />
small systems as compared to the large systems at smaller<br />
energy densities.<br />
The situation is different in case of the p/ ratio. From the<br />
definition of the dynamical fluctuations [5] one can derive<br />
an analytical expression, which is dominated by the correlation<br />
term [5]:<br />
242<br />
Supported by BMBF and HQM.<br />
(1)<br />
Here, the covariance is parametrized by .<br />
With the assumption of dominating feeddown from resonances<br />
the parameter is expected to become .<br />
(%)<br />
p/<br />
dyn<br />
0<br />
-5<br />
-10<br />
-15<br />
-20<br />
-25<br />
energy dependence (central collisions)<br />
centrality dependence at 158A GeV<br />
-30<br />
0 5000 10000 15000 20000 25000 30000<br />
NpN<br />
Figure 2: Dynamical<br />
fluctuations of the<br />
p/ ratio as a function<br />
of for the<br />
energy (circles) and<br />
the centrality (squares)<br />
dependence. Solid<br />
curves show fits according<br />
to the above<br />
equation.<br />
Figure 2 shows the dynamical fluctuations of the p/<br />
ratio as a function of . After fitting the dependences<br />
of the p/ ratio fluctuations with equation 1, the<br />
following parameters were obtained:<br />
for the energy dependence and for the<br />
centrality dependence. This observation strongly supports<br />
the assumption that resonance decays are the dominant<br />
source of dynamical fluctuations of the p/ ratio and give a<br />
natural explanation for both, the energy and centrality dependence.<br />
References<br />
[1] Z. Fodor and S. D. Katz, JHEP 0404 (2004) 050 [arXiv:heplat/0402006].<br />
[2] V. Koch, arXiv:0810.2520 [nucl-th].<br />
[3] S. Afanasev et al. [NA49 Collaboration], “The NA49 large<br />
acceptance hadron detector,” Nucl. Instrum. Meth. A 430<br />
(1999) 210.<br />
[4] C. Alt et al. [NA49 Collaboration], arXiv:0808.1237 [nuclex].<br />
[5] D. Kresan and V. Friese, PoS C FRNC2006 (2006) 017.<br />
[6] D. Kresan, arXiv:0908.2875 [nucl-ex].
<strong>GSI</strong> SCIENTIFIC REPORT 2009 NQMA-EXPERIMENTS-15<br />
Centrality dependence of K 0 s production in Pb+Pb collisions at the CERN SPS<br />
J. Book 1 , H. Beck 1 , C. Blume 1 , V. Friese 2 , M. Ga´zdzicki 1 , C. Höhne 2 , D. Kresan 2 , M. Mitrovski 1 ,<br />
M. Pohl 1 , R. Renfordt 1 , T. Schuster 1 , R. Stock 1 , H. Ströbele 1 , and the NA49 Collaboration<br />
1 Institut <strong>für</strong> Kernphysik Frankfurt, Germany; 2 <strong>GSI</strong>, Darmstadt, Germany<br />
Motivation<br />
At high energy densities a new phase of matter, the<br />
quark-gluon-plasma (QGP), is expected to be formed. The<br />
system size dependence of strangeness production per<br />
wounded nucleon shows an increase towards larger reaction<br />
systems [1]. Also the energy dependence of K + /π +<br />
has been studied and shows an anomaly at low SPS energies<br />
[2]. To cross check these results obtained for charged<br />
kaons, the K 0 s can be studied. A comparison is possible<br />
because of the approximate isospin symmetry and<br />
strangeness conservation:<br />
(K + + K − )/2 ≈ K 0 s<br />
Data Analysis<br />
The data were measured by the fixed target experiment<br />
NA49 [3] at the CERN SPS in 2001 and 2002. A zerodegree-calorimeter<br />
(ZDC) determines the centrality of the<br />
collisions via the energy deposition of the spectators.<br />
For the K0 s reconstruction by their decay topology (K0 s →<br />
π + + π− ) a V 0 finding algorithm is implemented. It combines<br />
all pairs of opposite charged tracks and extrapolates<br />
them step-by-step towards the main vertex. The minimum<br />
distance of their closest approach (dca) indicates a<br />
K0 s candidate for which the invariant mass can be calculated:<br />
�<br />
(E1 + E2) 2 − | �p1 + �p2| 2<br />
(2)<br />
m K 0 s =<br />
The invariant mass spectra in a given y-pt-bin are now analysed<br />
by a fit procedure, where the background is described<br />
by a polynomial and the signal by a MC simulated line<br />
shape.<br />
There are three types of losses, the geometrical acceptance,<br />
the reconstruction inefficiency due to the V 0 algorithm and<br />
due to the track density. To determine these losses a simulation<br />
chain has been implemented. In the first step MC<br />
K 0 s<br />
(1)<br />
are generated and their daughter particles are propa-<br />
gated through the virtual NA49 detector by GEANT. After<br />
this the data is embedded in real events to take care of track<br />
density effects. In the last step these data are reconstructed<br />
by the standard reconstruction chain and compared to real<br />
data to calculate the detection probability Pdetect.<br />
Results<br />
The corrected mt-spectra for all centrality classes are<br />
shown in Figure 1. A Boltzmann-function is used to extrapolate<br />
into unmeasured mt-regions.<br />
dy<br />
t<br />
N/dm<br />
2<br />
d<br />
t<br />
1/m<br />
2 10 x1.5 2 10<br />
10<br />
1<br />
x2.0<br />
-0.8 ≤ y ≤ -0.4<br />
CM<br />
40A GeV<br />
0 0.5 1 1.5<br />
2 10 x1.5 2 10<br />
10<br />
1<br />
x2.0<br />
158A GeV<br />
0 0.5 1 1.5<br />
0<br />
2<br />
m -m [GeV/c ]<br />
t<br />
0.0-5.0%<br />
5.0-12.5%<br />
12.5-23.5%<br />
23.5-33.5%<br />
33.5-43.5%<br />
Figure 1: The corrected mt-spectra for all centrality classes<br />
for Pb+Pb collisions.<br />
〉<br />
W<br />
/ 〈 N<br />
y=0<br />
dN/dy|<br />
0.08<br />
0.06<br />
0.04<br />
0.02<br />
0<br />
S<br />
+<br />
K<br />
(K +K<br />
-<br />
)/2<br />
〉<br />
W<br />
/ 〈 N<br />
y=0<br />
dN/dy|<br />
40A GeV<br />
0.08<br />
0.06<br />
0.04<br />
0.02<br />
0 100 200 300 400<br />
158A GeV<br />
0 100 200 300 400<br />
〈 N 〉<br />
W<br />
Figure 2: The yields around midrapidity (|y| ≤ 0.4) per<br />
wounded nucleon as a function of the number of wounded<br />
nucleons for Pb+Pb reactions at 40A and 158A GeV. The<br />
systematic error is represented by gray fields.<br />
In Figure 2 you can see a good agreement of the yields<br />
of charged kaons [4] and K0 s at midrapidity within the systematic<br />
errors.<br />
References<br />
[1] J.Rafelski & B.Müller, Phys.Rev.Lett. 48, 1066–1069 (1982)<br />
[2] C.Alt et al. [NA49 Collaboration], Phys.Rev.C 77, 024903<br />
(2008)<br />
[3] Afanasiev et al. [NA49 Collaboration], Nucl. Instrum.<br />
Meth.A430, 210–244 (1999)<br />
[4] P. Dinkelaker, PhD thesis, “Kaon and Pion Production in<br />
Centrality Selected Minimum Bias Pb+Pb Collisions at 40<br />
and 158 A GeV”, Goethe University Frankfurt, (2009)<br />
243
NQMA-EXPERIMENTS-16 <strong>GSI</strong> SCIENTIFIC REPORT 2009<br />
Proton - Lambda Correlations in Central Pb+Pb Collisions at 158A GeV<br />
H. Beck 1 , C. Blume 1 , J. Book 1 , V. Friese 2 ,M.Ga´zdzicki 1 ,C.Höhne 2 , D. Kresan 2 , M. Mitrovski 1 ,<br />
M. Pohl 1 , R. Renfordt 1 , T. Schuster 1 , R. Stock 1 , H. Ströbele 1 , and the NA49 Collaboration<br />
1 Fachbereich Physik der Universität, Frankfurt; 2 <strong>Helmholtzzentrum</strong> <strong>für</strong> <strong>Schwerionenforschung</strong> (<strong>GSI</strong>), Darmstadt<br />
Motivation<br />
The fireball created in ultra-relativistic heavy ion collisions<br />
is thought to form a state of deconfinement: the<br />
quark-gluon plasma (QGP). The QGP is believed to have<br />
existed fractions of seconds after the big bang and proof of<br />
it’s creation and properties are of general interest. Two particle<br />
correlations are widely used to investigate the dynamic<br />
evolution of the fireball. Especially pion-pion correlations<br />
allow for a multi-dimensional analysis of the parameters<br />
of the particle emitting source. Although proton-lambda<br />
correlation measurements suffer from lower statistics (thus<br />
only one-dimensionial analyses have yet been published),<br />
they provide a clean signal: only strong interaction leads to<br />
an excess of proton-lambda pairs for small momentum differences<br />
of the two particles [1]. Known parameters of the<br />
final state interaction allow us to extract source sizes from<br />
correlation measurements.<br />
Data Analysis<br />
The data presented in this contribution was registered<br />
with the NA49 detector at the CERN SPS. The analyzed<br />
set consists of 2.8 · 10 6 central (23.5%) Pb+Pb collisions at<br />
158A GeV. The lambda sample was obtained by combining<br />
all oppositely charged tracks to so called V 0 vertices and<br />
then applying selection criteria to both the daughter tracks<br />
and the V 0 vertex. Identification of primary protons was<br />
performed via a measurement of the specific energy loss in<br />
the four large volume TPCs of the detector. Selection criteria<br />
were varied to estimate the systematic error. Two-track<br />
cuts were applied to avoid influences of two-particle effects<br />
like two-track resolution. Without a cut, the finite detector<br />
resolution would cause merging of close tracks, which<br />
would lower the correlation function. The raw correlation<br />
function was obtained by dividing the measured distribution<br />
of momentum differences between pairs of protons and<br />
lambdas within the same event by an equivalent distribution<br />
constructed by pairing protons and lambdas from different<br />
events. Analysis chain was exactly the same for both distributions.<br />
Corrections to the correlation function were done,<br />
which were necessary due to the imperfect particle identification<br />
and contributions of particles from decays.<br />
Results<br />
Figure 1 shows the corrected correlation function as a<br />
function of the momentum difference of the proton and the<br />
lambda, measured in the rest frame of the pair. The fitted<br />
244<br />
)<br />
inv<br />
(q<br />
2<br />
C<br />
1.8<br />
1.6<br />
1.4<br />
1.2<br />
1<br />
RG<br />
data<br />
model<br />
= (3.5 ± 0.2) fm<br />
0 0.1 0.2<br />
[GeV/c]<br />
q<br />
inv<br />
Figure 1: Corrected correlation function with fit.<br />
model [2] uses the effective range approximation for the<br />
S-wave interaction and assumes a spherically symmetric,<br />
Gaussian shaped source with the radius parameter R G being<br />
the σ of the spatial distribution. In the effective range<br />
approximation, the proton-lambda interaction is described<br />
and the ef-<br />
by two parameters: the scattering length f S 0<br />
fective range dS 0 . Here, according to [1], values of dS 0 =<br />
2.92 fm (singlet), 3.78 fm (triplet) and f S 0 = −2.88 fm<br />
(singlet), −1.66 fm (triplet) are used.<br />
All fits are consistent and result in a value for the radius<br />
parameter of:<br />
RG =(3.5 ± 0.2(stat.) ± 0.45(syst.)) fm.<br />
The STAR collaboration obtained a value for the protonlambda<br />
system in Au+Au collisions at √ sNN = 200 GeV<br />
of RG =(2.97 ± 0.34 +0.19<br />
−0.25 ± 0.2) fm. Both measurements<br />
agree well with each other.<br />
References<br />
[1] F. Wang and S. Pratt, Phys. Rev. Lett. 83, 3138 (1999).<br />
[2] R. Lednicky and V.L. Lyoboshitz, Sov. J. Nucl. Phys.<br />
35 (1982).
<strong>GSI</strong> SCIENTIFIC REPORT 2009 NQMA-EXPERIMENTS-17<br />
<strong>GSI</strong>Template2007<br />
First pp collisions seen with the ALICE Time Projection Chamber<br />
The ALICE Time Projection Chamber (TPC) is the<br />
central tracking detector of the CERN-LHC ALICE experiment<br />
[1]. First proton-proton collisions at √s=900<br />
GeV/c were successfully recorded during the initial data<br />
taking campaign in December 2009. A typical example of<br />
tracks from a pp-event is shown in Fig. 1.<br />
Figure 1: Clusters (blue dots) and reconstructed tracks<br />
(red lines) recorded by the TPC.<br />
The commissioning and calibration of the TPC has<br />
been done with cosmic data, laser runs and radioactive<br />
krypton in 2008 and 2009 and is reported in detail elsewhere<br />
[2].<br />
Collision Data<br />
During the initial data-taking period the TPC trigger<br />
rate from the collisions of 4 on 4 counter-rotating proton<br />
bunches was up to 10 Hz. Each of the bunches containing<br />
initially up to 10 11 protons. The trigger included both<br />
empty events and beam-gas interaction. The events size<br />
was in average of the order of 170kB owing to the excellent<br />
low noise behaviour of the TPC readout chain. The<br />
magnetic field was set to ±0.5 T and, for alignment purposes,<br />
to B=0 T.<br />
To ensure immediate feedback on the data quality the<br />
raw data were immediately transferred to <strong>GSI</strong>, where they<br />
were reconstructed and analyzed using the entire <strong>GSI</strong> Tier<br />
2 batch farm and the high-performance cluster with 2000<br />
cores and 1 PB of storage on Lustre. Feedback on the<br />
detector performance was available within a few hours<br />
after the data had been recorded. All results were constantly<br />
communicated to the CERN detector control<br />
room. Thanks to the outstanding performance of the <strong>GSI</strong><br />
computing infrastructure, the analysis chain was running<br />
uninterrupted during the complete data-taking period.<br />
Result from Data Analyses<br />
Fig.2 shows a dE/dx vs. momentum spectrum from pp<br />
collision at 900 GeV/c employing the calibration data<br />
from the cosmic and krypton runs. As can be seen the<br />
excellent particle separation anticipated from the cosmic<br />
The ALICE TPC collaboration 1<br />
runs is also manifest in the collision data, e.g., by the π/µseparation<br />
visible at low momentum.<br />
Figure 2: Particle identification the TPC.<br />
This, together with precise tracking, readily allows reconstructing<br />
invariant mass spectra. As a further example<br />
of the TPC performance with data we show in Fig. 3 the<br />
K0 S -invariant mass plot from the π + π - V0 decays vertices.<br />
The narrow width and the perfect agreement with the<br />
PDG mass should be taken as certification of the readiness<br />
of the TPC for the upcoming pp and PbPb runs in<br />
2010.<br />
Figure 3: Reconstructed K0 S from π + π - V0 decays vertices.<br />
References<br />
[1] “The ALICE experiment at the CERN LHC”, ALICE<br />
Collaboration, 2008, JINST 3 S08002<br />
[2] “The ALICE TPC, a large 3-dimensional tracking<br />
device with fast readout for ultra-high multiplicity<br />
events”, J. Alme et al., 2010, e-Print:<br />
arXiv:1001.1950<br />
1 The list of members and institutions is available at<br />
http://www-alice.gsi.de/tpc<br />
245
NQMA-EXPERIMENTS-18 <strong>GSI</strong> SCIENTIFIC REPORT 2009<br />
Photon reconstruction with conversions in ALICE<br />
K. Aamodt 1 , F. Bock 2 , P. Braun-Munzinger 3,4 , T. Dietel 5 , P. Gonzalez 6 , M. Heide 5 , M. Ivanov 3,4 ,<br />
K. Koch 2 , P. Ladrón de Guevara 6 , A. Marín 3,4 , M. Rammler 5 , K. Reygers 2 , D. Röhrich 7 ,<br />
E. Serradilla 6 , J. Stachel 2 , J.P. Wessels 5 , and for the ALICE Collaboration<br />
1 Department of Physics, University of Oslo, Oslo, Norway; 2 Physikalisches Institut, Ruprecht-Karls-Universität<br />
Heidelberg, Heidelberg, Germany; 3 ExtreMe Matter Institute EMMI, Darmstadt, Germany; 4 <strong>GSI</strong> Helmholtzzemtrum<br />
<strong>für</strong> <strong>Schwerionenforschung</strong>, Darmstadt, Germany; 5 Institut <strong>für</strong> Kernphysik, Westfälische-Wilhems-Universität Münster,<br />
Münster, Germany; 6 Centro de Investigaciones Energéticas, Medioambientales y Tecnológicas (CIEMAT), Madrid,<br />
Spain; 7 Department of Physics and Technology, University of Bergen, Bergen, Norway<br />
ALICE (A Large Ion Collider Experiment) is a generalpurpose,<br />
heavy-ion detector designed to study the physics<br />
of strongly interacting matter and the quark gluon plasma<br />
in nucleus-nucleus collisions at the CERN LHC. The LHC<br />
started delivering collisions at the injection energy of<br />
√ s = 900 GeV/c in November 2009. During the 2009 period<br />
about 400 k pp collisions were recorded in ALICE<br />
with all detectors included. ALICE can measure photons<br />
that convert in the detector material (mainly the six ITS layers<br />
and the TPC container vessels [1]) via the measurement<br />
of the e ± pair in the Central Barrel detectors. Converted<br />
Y [cm]<br />
100<br />
50<br />
0<br />
-50<br />
-100<br />
-100 -50 0 50 100<br />
X [cm]<br />
Figure 1: X vs Y distribution of reconstructed photon conversion<br />
vertices within |η|
<strong>GSI</strong> SCIENTIFIC REPORT 2009 NQMA-EXPERIMENTS-19<br />
Correlation between mean transverse momentum and multiplicity in p-p<br />
collisions at √ s = 900 GeV in ALICE ∗<br />
P. Luettig † 1 , H. Appelshaeuser 1 , H. Buesching 1 , S. Schuchmann 1 , and J. Otwinowski 2<br />
1 Goethe University Frankfurt, Germany; 2 <strong>GSI</strong>, Darmstadt, Germany<br />
The mean transverse momentum 〈pT 〉 of particles produced<br />
in heavy ion collisions and its event-by-event fluctuations<br />
are considered to be sensitive to critical fluctuations<br />
of the temperature of the hot and dense system created in<br />
such collisions. Fluctuations of 〈pT 〉 in proton-proton collisions<br />
are an essential reference measurement for these<br />
studies. Furthermore the mean transverse momentum in<br />
itself, and in particular its dependence on the charged particle<br />
multiplicity is an important constraint for phenomenological<br />
models to describe these collisions at high energies.<br />
Here we report how 〈pT 〉 is extracted from the transverse<br />
momentum spectra measured by the ALICE Time Projection<br />
Chamber in the first run period of the LHC in 2009 in<br />
proton-proton collisions at √ s = 900 GeV.<br />
〈pT 〉 vs. Charged Multiplicity<br />
This analysis is based on the measurement of the transverse<br />
momentum (pT ) spectra of charged particles in the<br />
ALICE Time Projection Chamber (TPC) [1]. The pT spectra<br />
of particles with 0.15 GeV/c ≤ pT ≤ 10 GeV/c in<br />
|η| < 0.8 are used, after they are fully corrected for efficiency<br />
and contamination from secondaries.<br />
One way to extract the mean transverse momentum 〈pT 〉<br />
from the measured pT -spectra is to calculate the arithmetic<br />
mean of the transverse momenta of the measured particles,<br />
〈pT 〉meas:<br />
〈pT 〉meas =<br />
1<br />
(1)<br />
ΣpT i<br />
Nmeas<br />
The measured mutliplicity Nmeas is the number of particles<br />
which are used to calculate 〈pT 〉meas.<br />
Figure 1 shows the results for 〈pT 〉meas as a function<br />
of Nmeas in the ALICE TPC. Only particles with<br />
pT = [0.3 GeV/c, 4.0 GeV/c] in |η| < 0.8 are taken<br />
into account. As observed by UA1 at the CERN protonantiproton<br />
collider, the pT spectrum flattens for increasing<br />
multiplicity [2]. This flattening corresponds to an increase<br />
in the mean transverse momentum as demonstrated in<br />
Figure 1.<br />
An alternative way to extract 〈pT 〉 from the measured<br />
pT -spectra is to find an adequate parametrization of the<br />
spectrum. By using this parametrization 〈pT 〉 can be calculated<br />
by extrapolation of the spectrum to pT = 0 GeV/c.<br />
∗ work supported by BMBF and <strong>GSI</strong><br />
† luettig@ikf.uni-frankfurt.de<br />
Furthermore Nmeas can be related to the true multiplicity<br />
Ntrue using a detailed simulation of the detector<br />
response and unfolding of the Nmeas distribution.<br />
Various approaches to fit the pT spectra and to extract<br />
Nreal by unfolding the measured distribution are recently<br />
being tested.<br />
(GeV/c)<br />
meas<br />
〉<br />
T<br />
p<br />
〈<br />
1<br />
0.9<br />
0.8<br />
0.7<br />
0.6<br />
0.5<br />
ALICE, p+p<br />
s = 900 GeV<br />
p = 0.3 - 4.0 GeV/c<br />
T<br />
| η|<br />
< 0.8<br />
Preliminary<br />
0 5 10 15 20 25 30 35 40<br />
N meas<br />
Figure 1: Measured mean transverse momentum 〈pT 〉meas<br />
in the ALICE TPC as a function of the measured<br />
multiplicity Nmeas for particles with pT =<br />
[0.3 GeV/c, 4.0 GeV/c] in |η| < 0.8.<br />
Outlook<br />
As a next step, we prepare the extraction of 〈pT 〉 on an<br />
event-by-event basis and investigate its flucuation as function<br />
of the charged particle multiplicity. Such data will provide<br />
an important baseline for similar studies in heavy-ion<br />
collisions at LHC.<br />
References<br />
[1] ALICE-TPC Technical Design Report, CERN / LHCC 2000-<br />
001, ALICE TDR 7, 07. Jan. 2000<br />
[2] A study of the general characteristics of proton-antiproton<br />
collisions at √ s = 0.2 to 0.9 TeV, UA1 Collaboration,<br />
CERN-EP / 89-85, July 12th, 1989<br />
247
NQMA-EXPERIMENTS-20 <strong>GSI</strong> SCIENTIFIC REPORT 2009<br />
Trigger Particle Correlations in pp Collisions with the ALICE Detector ∗<br />
J. Ulery 1 and H. Appelshäuser 1<br />
1 Institut <strong>für</strong> Kernphysik, Goethe Universtität, Frankfurt am Main, Germany<br />
Introduction<br />
The Large Hadron Collidor, LHC, will produce collisions<br />
of protons at energies up to √ s = 14 TeV and lead<br />
ions at energies up to √ sNN = 5.5 TeV. These collisions<br />
can be probed with jet-like correlations. These correlations<br />
can be used to improve our knowledge of jets in relativistic<br />
collisions. In elementary collisions, jet-like correlations<br />
can tell us about how partons fragment into jets of particles.<br />
In heavy-ion collisions these correlations can provide<br />
information about how energy is lost in the medium created<br />
in these collisions.<br />
Analysis<br />
The analysis is performed in the ALICE Time Projection<br />
Chamber (TPC). Charged particles with intermediate<br />
or high transverse momentum (pT ) are chosen as trigger<br />
particles. This selection provides us with particles that are<br />
likely from jets. The trajectory of these particles is most<br />
likely along the jet axis. The other particles in the event are<br />
studied in their relative angles in azimuth, ∆φ = φT rig −φ,<br />
and pseudo-rapidity, ∆η = ηT rig − η. These jet-like angular<br />
correlations can then be studied as a function of the<br />
transverse momentum of the particles.<br />
The efficiency and acceptance of the detector is corrected<br />
using simulated events. This is done by simulated particles<br />
with an event generator, then running them through a simulation<br />
of the detector. The tracks are reconstructed from<br />
the simulated particles as if they were from real data. The<br />
trigger particle correlation from the reconstructed particles<br />
and from the originally simulated particles are compared<br />
to find the efficiency of the particle detection as a function<br />
of the relative angles between the particles. This corrects<br />
for detector effects on particle detection up to the level the<br />
detector is simulated.<br />
The unsubtracted jet-like correlations also have an underlying<br />
event that does not have an angular correlation.<br />
Backgrounds are created through event mixing, trigger particles<br />
are mixed with associated particles from other events.<br />
The triggered events have a bias, from requiring the intermediate<br />
or high pT trigger particle, that the events used<br />
in mixing, minimum bias, do not have. This gives a large<br />
multiplicity in triggered events. The extra particles might<br />
be from the jets we are looking at (in which case we do<br />
not want to subtract those particles) or from other sources.<br />
If the triggered events would be used instead for mixing<br />
then the multiplicity would be higher than our underlying<br />
event and be contaminated with particles from jets. The<br />
true level of the underlying event is unknown. The mixed<br />
248<br />
∗ Work supported by EMMI, <strong>GSI</strong>, and BMBF<br />
event is normalized such that there is no yield after background<br />
subtraction between the peak, Zero Yield At Minimum<br />
assumption. This assumption can be applied to both<br />
elementary collisions and heavy-ion collisions and therefore<br />
makes it good to use for comparisons between the different<br />
collision types. A fixed location is used from the<br />
minimum to reduce additional statistical uncertainty when<br />
using a floating minimum. The minimum is determined at<br />
the lowest trigger and associated pT s where the peaks are<br />
the widest.<br />
Figure 1: Preliminary Two-particle jet-like azimuthal correlation<br />
from � (s) = 900 GeV events in ALICE.<br />
Results and Conclusions<br />
Currently the LHC has taken data at in pp collisions at<br />
� (s) = 900 GeV. This data been studied with this analysis.<br />
Work is ongoing with this data set to finalize the<br />
results. The analysis has also been performed on simulated<br />
data from different event simulators of pp collisions at<br />
√ s = 900 GeV and also at other energies. The simulated<br />
data can be used for comparisons and for corrections.<br />
An example azimuthal correlation from the √ s = 900<br />
GeV data is shown in the figure. The peak at ∆φ = 0 is<br />
from particles near the trigger particle in angle. These particles<br />
and the trigger particle are likely from the same jetcone.<br />
The fragmentation in this peak is biased due to our<br />
requirement of a trigger particle. The peak at ∆φ = π is<br />
likely from particles in the other jet of a di-jet. The particles<br />
in this peak have an unbiased fragmentation. From studying<br />
both peaks we can observe both biased and unbiased<br />
fragmentation. Once heavy-ion data has been obtained by<br />
studying both peaks we can look at peaks with different<br />
medium modification as triggering likely biases the trigger<br />
jet to be near the outside of the medium.
<strong>GSI</strong> SCIENTIFIC REPORT 2009 NQMA-EXPERIMENTS-21<br />
Perspectives of J/ψ →e + e − measurement in pp collisions at the LHC in ALICE<br />
A. Andronic1 , I.C. Arsene1 , A. Bernhard2 , C. Blume2 , J. Book2 , P. Braun-Munzinger1,3,4 , F. Kramer2 ,<br />
D. Krumbhorn5 , M. Mager3 , W.J. Park1 , and J. Wiechula5 1 2 3 <strong>GSI</strong> Darmstadt, Germany; J.W Goethe University of Frankfurt, Germany; Technical University, Darmstadt,<br />
Germany; 4ExtreMe Matter Institute, <strong>GSI</strong> Darmstadt, Germany; 5University of Heidelberg, Germany<br />
Besides being a crucial observable for the dignosis of<br />
the deconfined matter produced in high-energy nucleusnucleus<br />
(AA) collisions (see e.g. [1] for a review), the<br />
charmonium family is also a powerful observable to test<br />
QCD models for production in pp collisions [2]. The measurement<br />
in pp is essential also as a reference for the AA<br />
data. The measurements in the new energy domain opened<br />
by the LHC are eagerly awaited for both AA and pp.<br />
The ALICE detector, although having as primary goal<br />
the study of AA collisions, can make an important contribution<br />
in the charmonium sector also for pp collisions. We<br />
discuss here, based on simulated events, the expected performance<br />
for the J/ψ → e + e − measurement in the ALICE<br />
central barrel, covering |η| p<br />
t t<br />
Yield per event for p<br />
1<br />
-1<br />
10<br />
-2<br />
10<br />
-3<br />
10<br />
-4<br />
10<br />
MC prim., nTRDlayers>0<br />
MC prim., nTRDlayers>3<br />
DCA0<br />
DCA3<br />
2 4 6 8 10<br />
(GeV/c)<br />
max<br />
p<br />
t<br />
Figure 1: Abundance per event of tracks with transverse<br />
.<br />
momentum larger than p max<br />
t<br />
In Fig. 1 we show the abundance per event of tracks with<br />
momentum larger than a given value. A trigger at 2 GeV/c,<br />
combined with a hadron rejection factor of 10-20 achievable<br />
online can provide the required selectivity at Level-1<br />
trigger. The effect of the reduced p t resolution in the online<br />
algorithm is under study and efforts are ongoing for the implementation<br />
of such a trigger, a concept which was part of<br />
the TRD design [3]. The trigger impurity is another issue<br />
which needs careful investigations.<br />
Efficiency<br />
0.4<br />
1<br />
0.9<br />
0.8<br />
0.7<br />
0.6<br />
0.5<br />
0.3<br />
0.2<br />
0.1<br />
0<br />
1 1.5 2 2.5 3 3.5 4<br />
e<br />
p (GeV/c)<br />
t, min<br />
Figure 2: Efficiency of J/ψ as a function of the transverse<br />
momentum cut applied on either the electron or positron.<br />
Such a single-leg electron trigger with a threshold in the<br />
range 2-3 GeV/c leads to a corresponding J/ψ efficiency<br />
in the range 54-26%, as shown in Fig. 2, where we show<br />
the J/ψ efficiency as a function of the single-leg cut p e t,min .<br />
Assuming a conservative J/ψ efficiency of 10%, for 10 7<br />
s running time at √ s=7 TeV, we can reconstruct with the<br />
present setup for the first LHC run about 10 5 J/ψ, 1500<br />
ψ ′ , 700 χc1,2 [4] and 1000 Υ events. To achieve the partial<br />
bandwidth available to this trigger in the experiment a<br />
further selection in the High-Level Trigger system may be<br />
required.<br />
When the TRD will be completed during the LHC shutdown<br />
period following the first physics run, the detection<br />
efficiency will increase by a factor of almost 10.<br />
References<br />
[1] R. Rapp, D. Blaschke, P. Crochet, arXiv:0807.2470.<br />
[2] J.P. Lansberg, Eur. Phys. J. C 60 (2009) 693.<br />
[3] ALICE Transition Radiation Detector Technical Design Report,<br />
ALICE TDR 9, CERN/LHCC 2001-021.<br />
[4] P. Gonzalez et al., Eur. Phys. J. C 61 (2009) 899; Erratum<br />
ibid., C 61 (2009) 915.<br />
249
NQMA-EXPERIMENTS-22 <strong>GSI</strong> SCIENTIFIC REPORT 2009<br />
Development of Analysis Methods for J/ψ → e + e − at ALICE<br />
F. Kramer1 , C. Blume1 , A. Andronic2 , I.C. Arsene2 , A. Bernhard1 , J. Book1 , D. Krumbhorn3 ,<br />
W.J. Park2 , and J. Wiechula3 1 2 3 IKF, Goethe-Universität, Frankfurt, Germany; <strong>GSI</strong> Darmstadt, Germany; University of Heidelberg, Germany<br />
ALICE is the dedicated heavy-ion physics experiment<br />
at the LHC. It is designed to provide excellent means to<br />
study the quark-gluon plasma, a deconfined state of matter<br />
assumed to be created under extreme conditions. One<br />
very promising observable therefore is the measurement of<br />
quarkonia, including the J/ψ, ψ ′ and the Υ states. The AL-<br />
ICE central barrel detectors (ITS, TPC, TRD) will reconstruct<br />
quarkonia via their decay into an electron-positron<br />
pair [1]. For this purpose the Transition Radiation Detector<br />
(TRD) [2] will provide excellent electron identification.<br />
Entries<br />
Residuals<br />
Entries<br />
10000<br />
8000<br />
6000<br />
4000<br />
2000<br />
0<br />
2<br />
1<br />
0<br />
-1<br />
-2<br />
-3<br />
0<br />
500<br />
400<br />
300<br />
200<br />
100<br />
-100<br />
1.0 GeV/c ≤ p ≤ 2.0 GeV/c<br />
t<br />
-0.6 ≤ y ≤ -0.3<br />
0 2 4 6 8 10<br />
2<br />
minv<br />
(GeV/c )<br />
0<br />
Entries<br />
Residuals<br />
Entries<br />
4.0 GeV/c ≤ pt<br />
≤ 5.0 GeV/c<br />
250 -0.3 ≤ y ≤ 0.0<br />
2<br />
1<br />
0<br />
-1<br />
-2<br />
-3<br />
0<br />
200<br />
0 2 4 6 8 10<br />
2<br />
minv<br />
(GeV/c )<br />
-200<br />
0 2 4 6 8 10<br />
2<br />
inv. mass (GeV/c )<br />
0 2 4 6 8 10<br />
2<br />
inv. mass (GeV/c )<br />
200<br />
150<br />
100<br />
50<br />
0<br />
150<br />
100<br />
50<br />
0<br />
120 k min bias<br />
+ 1 J/ψ -> e+e- events<br />
Mass Spectrum<br />
Signal Fit<br />
BG Fit<br />
Residuals<br />
BG Subtr. Signal<br />
Signal Integral<br />
Figure 1: Fit procedure of the invariant mass distributions<br />
Dedicated simulated and fully reconstructed data samples<br />
had been used in order to prepare for the analysis of<br />
real measurement data. At first all electron-positron pair<br />
candidates in a given event that passed a specific set of cuts<br />
are used to record an invariant mass spectrum. Different<br />
methods to extract the signal and the background contribution<br />
from that spectrum can be applied. Fig. 1 shows the result<br />
of such a fit procedure for two arbitrarily selected bins<br />
of the pair’s phasespace (pt,y). Due to energy loss of the<br />
electrons by bremsstrahlung the shape of the peak is asymmetric.<br />
The signal part had been matched by the distribution<br />
of a simulated pure signal (blue), the background (red)<br />
has been fitted with a polynomial. The difference between<br />
fit and distribution in numbers of standard deviations of the<br />
distribution are drawn in the middle boxes of the two panels.<br />
These residuals indicate that the fit procedure achieves<br />
a good representation of the simulated data. Note that the<br />
sample used for this technical study containes a minimum<br />
bias Pythia p+p simulation plus one J/ψ per event and does<br />
thus differ strongly from a real measurement sample. Stud-<br />
250<br />
ies of realistic data samples with corresponding signal to<br />
background ratios are ongoing. The lower boxes of Fig. 1<br />
show the remaining signal after background subtraction.<br />
The integral of the peak gives the measured J/ψ yield.<br />
Efficiencies<br />
-1<br />
10<br />
-2<br />
10<br />
1<br />
Efficiencies of the Selection Steps<br />
| η|
<strong>GSI</strong> SCIENTIFIC REPORT 2009 NQMA-EXPERIMENTS-23<br />
A Peformance Study of Electron-Hadron Correlations with ALICE<br />
Since in nucleus-nucleus collisions at ultrarelativistic energies,<br />
heavy quark pairs are produced only in hard processes<br />
at the early phase of the collision, they are especially<br />
suited to investigate the properties of the Quark-<br />
Gluon Plasma. Particularly in order to understand the energy<br />
loss of heavy quarks, traversing this medium, it is<br />
important to distinguish the contributions from charm and<br />
bottom quarks. This can be done by Angular Electron-<br />
Hadron Correlations with ALICE, an experiment at the<br />
LHC. pp collisions have to be measured as reference for<br />
nucleus-nucleus collisions. Some studies of azimuthal angle<br />
corellations of heavy quark pairs in ALICE, were done<br />
already in [1].<br />
In this method, electrons from semileptonic decays of<br />
mesons with charm or beauty content, are correlated in azimuthal<br />
angle with hadrons originating from the same hard<br />
process. For example for a back to back process like pair<br />
creation, the electron is preferentially on the opposite side<br />
of the D 0 for charm quarks and on the same side for beauty<br />
quarks. As it is visible in the sketch in Figure 1, only for the<br />
charm case a correlation of electrons with D 0 ’s is possible,<br />
whereas the presence of a ¯ D 0 with an electron indicates as<br />
origin bottom quarks. It should be noted that certainly the<br />
charge symmetric case is considered as well.<br />
Figure 1: Example decay stems for c¯c and b ¯ b pairs<br />
For this analysis, a simulation of roughly 50 million pp<br />
events at 10 TeV, produced with the Monte Carlo event generator<br />
PYTHIA, is used. On the electron side a transverse<br />
momentum selection is applied in order to minimize the<br />
non heavy quark electron impurity. In Figure 2 the correlation<br />
in azimuth between such electrons having a transverse<br />
momentum higher than 1 GeV/c and D 0 mesons is shown.<br />
Moreover the three leading order processes which are contributing<br />
to the overall correlation are indicated. It is possible<br />
to deduce from such a correlation function the relative<br />
charm and bottom contribution, by comparing the electron-<br />
D 0 correlation yield in the near- and away-side. The invariant<br />
mass distributions and reconstruction performance, categorized<br />
in transverse momentum bins are shown in Figure<br />
3 and Table 1.<br />
S. Altınpınar 1<br />
1 <strong>GSI</strong>, Darmstadt, Germany<br />
Figure 2: Azimuthal Angle Correlation of electrons and D 0<br />
mesons<br />
Figure 3: Invariant mass distributions of Kaon Pion pairs<br />
with D 0 / ¯ D 0 peaks<br />
D 0 Pt Range S B S/B Signif. (10 9 )<br />
All (GeV/c) 154 509 0.3 6 26.8<br />
0→1 GeV/c 78 478 0.16 3.3 14.7<br />
1→3 GeV/c 45 39 1.14 4.9 21.9<br />
3→5 GeV/c 38 5 8.19 5.8 25.9<br />
Table 1: D 0 Reconstruction Performance<br />
The correlation with reconstructed D 0 mesons (see Table<br />
1) and electrons, yields a correlation plot with only a<br />
few entries. To obtain a correlation function, the full statistics<br />
of one year data taking at ALICE (10 9 ev.), which is<br />
corresponding to roughly 350 entries, is needed.<br />
References<br />
[1] ALICE Collaboration, J. Phys. G: Nucl. Part. Phys. 32 (2006)<br />
1295<br />
251
NQMA-EXPERIMENTS-24 <strong>GSI</strong> SCIENTIFIC REPORT 2009<br />
Parton and flavor discrimination using jets with ALICE at the LHC<br />
H. León-Vargas 1 , C. Blume 1 , and C. Klein-Bösing 2<br />
1 IKF, University of Frankfurt, Germany; 2 Institut <strong>für</strong> Kernphysik Münster, Germany<br />
Introduction<br />
The study of the jet cross section and that of its different<br />
components (quarks and gluons) is an important test of<br />
perturbative QCD. Using the excellent tracking and PID capabilities<br />
of ALICE, it is possible to use a combination of<br />
different tagging variables to disentangle the jets produced<br />
by quarks or gluons, and even the jets produced by heavy<br />
or light quarks. We are interested in using the tagged jets as<br />
probes of the hot and dense matter produced during heavy<br />
ion collisions. The proton-proton collisions will be used as<br />
a benchmark for the Pb-Pb collisions.<br />
The data set used to generate the figures on this report contains<br />
1.25 million simulated proton-proton collisions at 7<br />
TeV from PYTHIA. We used the UA1 jet finder running<br />
over charged particles, with a cone radius of 0.4.<br />
Quark and gluon jet tagging<br />
The differences in the fragmentation properties of quarks<br />
and gluon jets is the basis that allows to distinguish jets<br />
produced by these two sources. For instance, the jets produced<br />
by the fragmentation of gluons are expected to contain<br />
more particles and be broader in η − φ space than jets<br />
produced from quarks.<br />
Two approaches for the jet tagging are under study. The<br />
first is based on the method proposed in [1] that basically<br />
calculates the number of cells in a η−φ grid, which are necessary<br />
to recover a certain fraction of the jet energy. The<br />
second method uses the second moment of the jet profile in<br />
transverse momentum, as proposed in [2]:<br />
� � 2 Σi∆R<br />
δRjet = 2 (i, jet) × pi T<br />
Σipi T<br />
Where the index i runs over all stable charged particles<br />
and ∆R = � (∆η) 2 + (∆φ) 2 . Figure 1 shows the distribution<br />
of the second moment of the jet profile for all jets in<br />
black circles, quark jets in blue crosses and for gluon jets<br />
in green triangles. The mean value of the second moment<br />
of the jet profile is higher for gluons jets than for quark jets<br />
over the whole jet pT range studied.<br />
B-jet tagging<br />
Following the ideas in [3], we are also studying the possibility<br />
of tagging b-jets using the semileptonic decay channel<br />
of B mesons. B jets are selected based on the kinematic<br />
properties of the electrons relative to the jet. An example<br />
of a discriminating variable is shown in figure 2, where the<br />
red line shows the distribution obtained for b-jets, the solid<br />
black line for gluons, the dotted blue line for c-jets and the<br />
252<br />
(1)<br />
Figure 1: Discrimination of quark and gluon jets using the<br />
second moment of the jet profile.<br />
dashed black for light quarks. As one can see, the fraction<br />
of the jet energy carried by electrons is larger when the jet<br />
is originated from a heavy quark.<br />
Figure 2: Ratio of the electron momentum to the jet energy<br />
for jets with energy greater than 50 GeV.<br />
References<br />
[1] J. Pumplin, “How to tell quark jets from gluon jets”, Phys.<br />
Rev. D 44 (1991) 2025<br />
[2] The CMS Collaboration, “Study of jet transverse structure<br />
using the second moment of the jet profile in transverse momentum<br />
in pp collisions at √ s = 10 TeV”, CMS PAS QCD-<br />
08-002, 2009.<br />
[3] P. Demin, S. de Visscher, A. Bocci, R. Ranieri, “Tagging<br />
b jets with electrons and muons at CMS”, CMS NOTE<br />
2006/043.
<strong>GSI</strong> SCIENTIFIC REPORT 2009 NQMA-EXPERIMENTS-25<br />
Study on Impact Parameter of Charged Particles in ALICE<br />
preparing for studying electrons from semi-leptonic heavy-flavor decay at LHC energies ∗<br />
C. Bombonati1 , S. Masciocchi2 , K. Schweda3 , J. Stachel3 † 3<br />
, and H. Yang<br />
1 INFN, Padova, Italy; 2 <strong>GSI</strong>, <strong>Helmholtzzentrum</strong> <strong>für</strong> <strong>Schwerionenforschung</strong> GmbH, Darmstadt, Germany;<br />
3 Physikalisches Institut, Universität Heidelberg, Heidelberg, Germany<br />
Beauty is produced much more abundantly at LHC energies<br />
compared to RHIC energies. The increase in production,<br />
coupled with the beauty large mass, makes it<br />
an interesting observable for the physic of the ALICE<br />
experiment [1] . Semi-electronic decay of beauty mesons offers<br />
a powerful tool to study beauty production in ALICE,<br />
attributed to its high tracking resolution (ITS, TPC, TRD)<br />
and vertexing (ITS) [2] . With the high single track pointing<br />
resolution of about 50 µm at pT ≈ 1GeV/c, ALICE is<br />
well suited for studying the displaced electrons from beauty<br />
mesons decay because the relatively large difference in typical<br />
decay length of beauty (≈ 500 µm) and charm (up to<br />
≈ 300 µm).<br />
Results<br />
The impact parameter projection of reconstructed tracks<br />
in the transverse plane (xy) and the z direction are defined<br />
as:<br />
dxy = q·[R− � (xv − xc) 2 + (yv − yc) 2 ], dz = ztrack−zv<br />
(1)<br />
where q is the sign of particle charge, R and (xc, yc) are<br />
the radius and center coordinates of the track projection (a<br />
circle) in the transverse plane, and (xv, yv, zv) the position<br />
of the collision vertex.<br />
Counts<br />
Counts<br />
100<br />
50<br />
-<br />
e<br />
0<br />
-1000 -500 0 500 1000<br />
∆(d<br />
) [ µ m]<br />
100<br />
50<br />
π-<br />
0<br />
-1000 -500 0 500 1000<br />
∆(d<br />
) [ µ m]<br />
xy<br />
xy<br />
Counts<br />
Counts<br />
100<br />
50<br />
+ e<br />
0<br />
-1000 -500 0 500 1000<br />
∆(d<br />
) [ µ m]<br />
100<br />
50<br />
+<br />
π<br />
0<br />
-1000 -500 0 500 1000<br />
∆(d<br />
) [ µ m]<br />
Figure 1: An example of single Gaussian fit on residuals<br />
between measured and expected impact parameter within<br />
0.5 < pT ≤ 0.6 GeV/c.<br />
This analysis is based on Monte Carlo data samples produced<br />
at the <strong>GSI</strong> [3] computing center, with 5 different particle<br />
species (e ± , µ ± , π ± , K ± , p(¯p)) of flat pT distribution<br />
within a pT range (0, 20] GeV/c with GEANT. Tracks<br />
∗ This work has been supported by the Helmholtz Association under<br />
contract numbers VH-NG-147, HA-216/EMMI and the Federal Ministry<br />
of Education and Research under promotional reference 06HD9129D.<br />
† hongyan@physi.uni-heidelberg.de<br />
xy<br />
xy<br />
are reconstructed with realistic detector geometries and detector<br />
response functions. The impact parameter of reconstructed<br />
tracks in the transverse plane and the z direction<br />
are considered separately.<br />
m]<br />
µ<br />
dca) [<br />
∆<br />
(<br />
σ<br />
600<br />
400<br />
200<br />
dz<br />
dxy<br />
0<br />
-1<br />
10 1 10<br />
p<br />
T<br />
-<br />
e -<br />
µπ<br />
-<br />
K p<br />
[GeV/c]<br />
Figure 2: Momentum dependence of the impact parameter<br />
resolution for charged particles.<br />
The residuals ∆(dca), namely the difference between<br />
the measured and expected impact parameters, are fitted<br />
with a single Gaussian function within various pT bins,<br />
from which the resolution is obtained as the width of each<br />
Gaussian fit. As an example, figure 1 shows a typical Gaussian<br />
fit over the residuals of dxy within optimal-σ range<br />
within 0.5 < pT ≤ 0.6 GeV/c. Residuals of e ± are affected<br />
by the Bremsstrahlung processes, which appear as a<br />
shoulder-like structure on left or right (for e − or e + ) side<br />
of the distribution, but disappear when the Bremsstrahlung<br />
is switched off. On the other hand, for the other charged<br />
particles, Bremsstrahlung effects are negligible. Figure 2<br />
shows the transverse momentum dependence of the impact<br />
parameter resolution.<br />
The resolutions in the transverse plane (xy) and the z direction<br />
are about 60 µm and 160 µm at pT ≈ 1GeV/c and<br />
better at higher transverse momentum respectively. The<br />
resolution of electrons and positrons in the transverse plane<br />
at low pT is strongly affected by the Bremsstrahlung effect.<br />
These results are consistent with the earlier study [2] . High<br />
resolution in measuring the impact parameter for electrons,<br />
enables the ALICE detector to disentangle electrons produced<br />
by semi-electronic decay of beauty from charm.<br />
References<br />
[1] ALICE Collaboration, J. Phys. G: Nucl. Part. Phys. 30<br />
(2004)1517-1763, 32 (2006) 1295-2040.<br />
[2] A. Dainese and R. Turrisi, ALICE-INT-2003-28 (2003) 1-15.<br />
[3] http://www-alice-new.gsi.de/catalog/SimProd/index.php.<br />
253
NQMA-EXPERIMENTS-25 <strong>GSI</strong> SCIENTIFIC REPORT 2009<br />
254
<strong>GSI</strong> SCIENTIFIC REPORT 2009 NQMA-THEORY-01<br />
A Linear Sigma Model with Vector Mesons and Global Chiral Invariance ∗<br />
D. Parganlija † 1 , F. Giacosa 1 , and D. Rischke 1,2<br />
1 Goethe University, Frankfurt/Main, Germany; 2 FIAS, Frankfurt/Main, Germany<br />
The primary focus of our work has been the research of<br />
vacuum properties of the low-lying scalar, pseudoscalar,<br />
vector and axial-vector mesons (with the energies up to<br />
approximately 1.5 GeV) within a linear sigma model with<br />
global chiral invariance. As a first approximation of a larger<br />
study, we have taken into account only the mesons containing<br />
u and d quarks. All mesons in our model are quarkantiquark<br />
states due to their behaviour in the limit of large<br />
number of colours (e.g., no qq¯q¯q states for now). Their assignment<br />
to the physical fields is straightforward in the case<br />
of pseudsosclars: pion and ηN (the latter is the non-strange<br />
contribution to the physical η meson); vectors: ω(782) and<br />
ρ(770); axial-vectors: f1(1285) and a1(1260). The scalar<br />
mesons can be assigned in at least two ways: to f0(600)<br />
and a0(980) or to f0(1370) and a0(1450).<br />
In Refs. [1, 2] we have presented the case where the<br />
scalar mesons are assigned to f0(600) and a0(980). The<br />
Lagrangian of the model is discussed and we derive the<br />
formulas for the s-wave ππ scattering lengths with isospin<br />
zero (scattering length a 0 0<br />
) and isospin two (scattering<br />
length a 2 0) in the ππ coupled channel. We also derive<br />
the decay widths for the following processes: ρ → ππ,<br />
f1 → a0(980)π, a1 → πγ, f0(600) → ππ, a1 →<br />
f0(600)π and a1 → ρπ as well as the decay amplitude<br />
in the a0(980) → ηN π channel. We have used the scattering<br />
lengths and the decay widths ρ → ππ, f1 → a0(980)π<br />
and a1 → πγ to calculate the parameters of the model;<br />
the decay amplitude a0(980) → ηN π and the decay widths<br />
a1 → f0(600)π, a1 → ρπ and f0(600) → ππ are then<br />
the results of the model and can be compared to the experimental<br />
data.<br />
Our calculations have resulted in a perfect agreement with<br />
the Crystal Barrel data [3] on the a0(980) → ηπ decay<br />
amplitude. Our results correspond very well to the experimental<br />
data on the a1 phenomenology [the best results<br />
are obtained for ma1 ≃ 1180 MeV - that is about 50<br />
MeV smaller than the usually cited value from the Particle<br />
Data Group (PDG) [4], but this is not worrying as the<br />
data on ma1 is model-dependent because the a1(1260) resonance<br />
is broad]. However, we also obtain the value of<br />
decay width f0(600) → ππ that increases very slowly<br />
with m f0(600) so that even at m f0(600) ≃ 600 MeV one<br />
obtains only Γ f0(600)→ππ ≃ 50 MeV [unlike the result<br />
Γ f0(600)→ππ = (600 − 1000) MeV quoted by the PDG<br />
[4]].<br />
Therefore, assigning the scalar states of the model to the<br />
physical mesons f0(600) and a0(980) has yielded a too<br />
small value of the f0(600) → ππ decay width. Thus, we<br />
∗ Work supported by the <strong>GSI</strong> F&E Project.<br />
† parganlija@th.physik.uni-frankfurt.de<br />
have concluded that the low-lying scalar states f0(600) and<br />
a0(980) cannot be (predominantly) q¯q states.<br />
For this reason, we have also considered an alternative<br />
assignment for the scalars present in the model. In this<br />
case, the q¯q states are assumed to correspond to the physical<br />
states f0(1370) and a0(1450). Then we can calculate<br />
our parameters in a similar way to the previous case<br />
where the f0(600) and a0(980) mesons were assumed<br />
to be q¯q states, with the difference that the decay width<br />
f1 → a0(980)π cannot be used anymore for kinematic reasons<br />
and that the full decay width of the a0(1450) meson<br />
is used instead of the decay amplitude a0(980) → ηN π.<br />
The calculation of the f0(1370) → ππ decay width yields<br />
Γ f0(1370)→ππ = 410 MeV for m f0(1370) = 1300 MeV and<br />
Γ f0(1370)→ππ = 470 MeV for m f0(1370) = 1350 MeV.<br />
This result is in accordance with the experimental data<br />
from the PDG [4] stating the full width of the f0(1370) between<br />
200 and 500 MeV [and 1200 ≤ m f0(1370) ≤ 1500].<br />
Therefore, we conclude that the scalar mesons f0(1370)<br />
and a0(1450) are (predominantly) q¯q states.<br />
The role of the (axial-)vector mesons is very important in<br />
reaching the mentioned conclusions about the structure of<br />
the scalar mesons. As shown in Ref. [2], the ππ scattering<br />
lengths and the f0(600) → ππ decay width both correspond<br />
to the respective experimental data in the linear<br />
sigma model without (axial-)vector mesons, but the inclusion<br />
of (axial-)vectors, while still allowing for the scattering<br />
lengths to be described correctly, leads to a significant<br />
lowering of the f0(600) → ππ decay width (by approximately<br />
a factor of nine). Thus, when the (axial-)vectors are<br />
included into the model, one has to look for the q¯q scalar<br />
states in the energy region above 1 GeV. Then the identification<br />
of the f0(1370) and a0(1450) mesons as q¯q states<br />
leads to the correct value of the isoscalar decay width.<br />
Our future work will concentrate on further investigation<br />
of the nature of the f0(600) and a0(980) mesons (possibly<br />
as qq¯q¯q states or ππ molecules) and on calculations of meson<br />
properties at T �= 0 in order to investigate the QCD<br />
phase diagram, the restoration of chiral invariance and deconfinement.<br />
References<br />
[1] D. Parganlija, F. Giacosa and D. H. Rischke, PoS CONFINE-<br />
MENT8, 070 (2008) [arXiv:0812.2183 [hep-ph]].<br />
[2] D. Parganlija, F. Giacosa and D. H. Rischke, arXiv:0911.3996<br />
[nucl-th].<br />
[3] D. V. Bugg, V. V. Anisovich, A. Sarantsev and B. S. Zou,<br />
Phys. Rev. D 50, 4412 (1994).<br />
[4] C. Amsler et al. (Particle Data Group), Phys. Lett. B667, 1<br />
(2008).<br />
255
NQMA-THEORY-02 <strong>GSI</strong> SCIENTIFIC REPORT 2009<br />
About the origin of the mass of the nucleon in a linear sigma model ∗<br />
S. Gallas 1 , F. Giacosa 1 , and D.-H. Rischke 1,2<br />
1 Institut <strong>für</strong> Theoretische Physik, Johann Wolfgang Goethe University, Frankfurt, Germany; 2 Frankfurt Institute for<br />
Advanced Studies, Johann Wolfgang Goethe University, Frankfurt, Germany<br />
Understanding the mass of the nucleon is one of the most<br />
important issues in modern physics. Neglecting the small<br />
contribution of the explicit symmetry breaking, in the classical<br />
linear sigma model the mass of the nucleon is generated<br />
exclusively through spontaneous breaking of the chiral<br />
symmetry, leading to the appearance of a chiral condensate<br />
φ ∼ fπ, where fπ = 92.4 MeV is the pion decay constant<br />
[1]. The chiral condensate φ can be directly related to<br />
the fundamental quark condensate 〈qq〉 as φ ≃ Λ −2<br />
QCD 〈qq〉,<br />
where ΛQCD is the QCD Yang-Mills scale.<br />
However, not only the quark condensate, but also other<br />
condensates, such as the gluon and the tetraquark ones, can<br />
contribute to the mass of the nucleon mN and it is not<br />
yet settled which is their quantitative role [2]. A possibility<br />
to study this problem in the context of a linear sigma<br />
model goes via the so called mirror assignment, which was<br />
first discussed in Ref. [3] and extensively analyzed in Refs.<br />
[4, 5]. In this assignment, the nucleon N and its chiral partner<br />
N ∗ form a doublet of the chiral group. Then it is possible<br />
to introduce a chirally invariant mass term parametrized<br />
by m0. This leads to non-vanishing masses of the nucleon<br />
and its chiral partner in the chirally restored phase where<br />
φ → 0, instead they acquire the same mass m0 = 0. We<br />
show this in Fig. 1.<br />
A study of the parameters using the decays N ∗ → Nπ and<br />
a1 → πγ results in a value of 460 MeV for m0 which denotes<br />
the contribution to the mass of the nucleon not stemming<br />
from the quark condensate [6].<br />
The viability of our model is tested by studying the decay<br />
N ∗ → Nη and pion-nucleon scattering at tree level.<br />
This can provide useful information to clarify the origin of<br />
the nucleon mass and its behavior in the chirally restored<br />
phase.<br />
References<br />
[1] R. D. Pisarski, arXiv:hep-ph/9503330.<br />
[2] T. D. Cohen, R. J. Furnstahl, D. K. Griegel and X. m. Jin,<br />
Prog. Part. Nucl. Phys. 35 (1995) 221.<br />
[3] B.W. Lee, “Chiral Dynamics”, Gordon and Breach, New<br />
York, 1972<br />
[4] C. DeTar and T. Kunihiro, Phys. Rev. D 39 (1989) 2805.<br />
[5] D. Jido, M. Oka, and A. Hosaka, Prog. Theor. Phys. 106<br />
(2001) 873. D. Jido, Y. Nemoto, M. Oka and A. Hosaka,<br />
Nucl. Phys. A 671 (2000) 471.<br />
[6] S. Gallas, F. Giacosa and D. H. Rischke, arXiv:0907.5084<br />
[hep-ph]. submitted to Phys. Rev. D.<br />
256<br />
∗ Work supported by EU, EURONS contract No. 506065.<br />
Figure 1: Upper panel: The masses of the nucleon (blue<br />
line) and its chiral partner (purple line) as a function of the<br />
quark condensate at fixed m0 = 460 MeV. a) When varying<br />
φ from 0 to the physical value the nucleon mass goes<br />
from m0 = 460 MeV to 939 MeV, thus showing that in<br />
limit φ → 0 the mass does not vanish. b) If we turn off m0,<br />
the masses are exclusively generated by chiral symmetry<br />
breaking, thus vanishing for φ → 0. Lower panel: The chiral<br />
condensate φ is kept fixed to its physical value but the<br />
parameter m0 is left free. The baryon masses are plotted as<br />
function of m0.
<strong>GSI</strong> SCIENTIFIC REPORT 2009 NQMA-THEORY-03<br />
Correlations in Exotic Nuclear Matter<br />
P. Konrad ∗1 and H. Lenske 1,2<br />
1 Institut <strong>für</strong> Theoretische Physik, Universität Gießen, Germany; 2 <strong>GSI</strong>, Darmstadt, Germany<br />
In recent years, the interest in correlations inside nuclei<br />
became an important issue in nuclear physics. On the theoretical,<br />
side several calculations using different models including<br />
short-range correlation have been done for nuclear<br />
matter. However, there is still not much known about the<br />
role of correlations in neutron star matter containing hyperons.<br />
In our work we examined dynamical correlations<br />
in infinite nuclear and hypernuclear matter. We used a selfconsistent<br />
approach to calculate the dynamical self-energy<br />
and the spectral function. The self-energy is approximated<br />
by the one-particle-two-hole (1p2h) and two-particle-onehole<br />
(2p1h) polarization self-energy by neglecting higher<br />
order terms. For a realistic treatment of the nuclear meanfield<br />
incorporating an accurate description of finite nuclei,<br />
we used modern Skyrme parameterizations for the energy<br />
density functional. As shown by [1], dynamical correlations<br />
are more influenced by the strength of the interaction<br />
and the available phase space rather by the details of<br />
the interaction. Therefore, we assumed an energy- and<br />
momentum-independent interaction matrix element to approximate<br />
the polarization self-energies. Information on<br />
the average interaction matrix element was obtained by a<br />
weighted sum of the Landau-Migdal parameters extracted<br />
from the Skyrme energy-density functional [2].<br />
The spectral function shows a behavior known from<br />
other many-body calculations, a sharp quasi-particle peak<br />
with a wide spectral distribution. The location of the quasiparticle<br />
peak is mainly given by the mean-field contribution<br />
of the self-energy, while the collisional part is responsible<br />
for the spectral distribution. The comparison of different<br />
Skyrme parameterizations shows that the results for the different<br />
parameterization agree very well in symmetric and<br />
asymmetric nuclear matter.<br />
We kept the total baryon number fixed by varying the<br />
strangeness fraction to examine the influence of dynamical<br />
correlations in hypernuclear matter. Qualitatively, the<br />
results for the width, the spectral function and the momentum<br />
distribution of the nucleons and Λ-hyperons are similar<br />
to those found in nuclear matter. Quantitatively, the Λhyperons<br />
are less correlated since the interaction strength<br />
is reduced, while the correlations of the nucleons are of the<br />
same order as in nuclear matter. Thus Λ-hyperons show<br />
a smaller width, a sharper structure of the spectral function<br />
and a less pronounced high energy tail of the momentum<br />
distribution than the nucleons. This observation agrees<br />
perfectly well with the sharp spectral structure seen in hypernuclear<br />
spectra e.g. [3].<br />
The situation in β-equilibrated nuclear matter is different.<br />
As seen in Fig.1, the particle width and the spectral<br />
∗ Patrick.Konrad@theo.physik.uni-giessen.de<br />
function resemble qualitative the same properties as in nuclear<br />
matter. However, it is surprising that the width of the<br />
neutrons is about the same size as the hyperons rather the<br />
protons [2], as it can be seen in the lower panel of Fig.1.<br />
This fact can be explained by the high excess of neutrons<br />
in β-equilibrated nuclear matter, as already seen in neutron<br />
rich matter, Pauli-<strong>block</strong>ing leads to a decrease of the neutrons.<br />
This observation is confirmed when we examine the<br />
quasiparticle strength at the Fermi-edge as a function of the<br />
density. This shows that the correlations in our approach<br />
are connected directly to the abundance of the particles and<br />
the available phase space rather than the details of the interaction.<br />
A(E) [GeV -1 ]<br />
Γ(E) [GeV]<br />
10 -4<br />
10 -3<br />
10 -2<br />
10 -1<br />
10 0<br />
10 1<br />
10 2<br />
10 3<br />
10 4<br />
10 -1<br />
10 -2<br />
10 -3<br />
10 -4<br />
10 -5<br />
10 -6<br />
10 -7<br />
-0.4 -0.2 0 0.2 0.4<br />
E [GeV]<br />
p<br />
n<br />
Λ<br />
p n<br />
Λ<br />
-0.4 -0.2 0 0.2 0.4<br />
E-εF [GeV]<br />
Figure 1: The spectral function A (upper panel) and the<br />
width Γ (lower panel) as function of the energy E for<br />
protons, neutrons and Λ-hyperons in β-equilibriated nuclear<br />
matter at the density ρ = 0.48 fm −3 and momentum<br />
p ′ = 0.3 GeV.<br />
References<br />
[1] J. Lehr, H. Lenske, S. Leupold, U. Mosel, Nucl. Phys. A703,<br />
393-408, 2002<br />
[2] P. Konrad, Correlations in Exotic Nuclear Matter, Dissertation,<br />
Universität Gießen, 2009<br />
[3] H. Hotchi, Phys. Rev. C64, 044302, 2001<br />
257
NQMA-THEORY-04 <strong>GSI</strong> SCIENTIFIC REPORT 2009<br />
Description of Heavy Ion Reactions at <strong>GSI</strong> Energies ∗<br />
Amand Fäßler 1 and Herbert Müther 1<br />
1 Institut <strong>für</strong> Theoretische Physik der Universität Tübingen, D-72067 Tübingen, Germany<br />
We have investigated the connection between different<br />
forms of the nucleon-nucleon interaction, nuclear matter<br />
and heavy-ion reactions. In particular, the dilepton and σmeson<br />
production in the experiments FOPI and HADES at<br />
the <strong>GSI</strong> have been studied.<br />
In [1, 2] two microscopic models, UrQMD and QGSM,<br />
have been employed to study the formation of locally equilibrated<br />
hot and dense nuclear matter in heavy-ion collisions<br />
at energies from 11.6 A GeV to 160 A GeV. Both<br />
dynamical models indicate that the state of kinetic, thermal<br />
and chemical equilibrium is nearly approached at any bombarding<br />
energy after a certain relaxation period. Equation<br />
of state has a linear dependence P = c 2 s (√ s)e, where cs is<br />
the sound velocity. Change of the slope in c 2 s( √ s) behavior<br />
occurs at Elab = 40 A GeV and can be assigned to the transition<br />
from baryon-rich to meson-dominated matter. The<br />
phase diagrams in the T − µB plane show the presence of<br />
kinks along the lines of constant entropy per baryon which<br />
can be linked to the inelastic freeze-out in the system.<br />
The light vector mesons ρ and ω are of particular interest<br />
since their decay to dileptons allows to probe the electromagnetic<br />
response of the nuclear medium. In heavy ion<br />
reactions dilepton pairs provide a clear view on effective<br />
degrees of freedom at high baryon density and temperature.<br />
We have determined the modification of the ρ and ω meson<br />
properties in nuclear matter within a resonance model. For<br />
both mesons a substantial broadening of the width and a<br />
significant shift of spectral strength down to smaller invariant<br />
masses are found. In a first approximation the spectral<br />
functions have been determined from vacuum resonance<br />
properties. Going beyond this approximation, the inmedium<br />
modification of the nucleon resonance widths has<br />
been included. In [3] the in-medium spectral functions of<br />
ρ and ω mesons and the broadening of nucleon resonances<br />
at finite baryon density are calculated self-consistently by<br />
combining a resonance dominance model with an extended<br />
vector meson dominance model. The dilepton spectrum is<br />
generated for the C+C reaction at 2.0A GeV and compared<br />
with recent HADES Collaboration data. The collision dynamics<br />
is described by the Tübingen relativistic quantum<br />
molecular dynamics transport model. An iterative calculation<br />
of the vector meson spectral functions that takes into<br />
account the broadening of the nucleon resonances due to<br />
their increased in-medium decay branchings converges and<br />
provides a reasonable description of the experimental data<br />
in the mass region 0.45 ≤ M ≤ 0.75 GeV.<br />
In [4, 5] production of the σ meson is investigated in the<br />
quantum molecular dynamics model for the p+A reactions<br />
with the nuclei 12 C, 40 Ca and 208 Pb at the incident proton<br />
258<br />
∗ Work supported by the <strong>GSI</strong> Theory Project TUEMUE.<br />
energies Ep = 1.50 GeV. The simulation results indicate a<br />
distinctive A dependence of the σ production. The σ meson<br />
production is strongly medium-dependent, and the produced<br />
σ mesons decaying in a denser medium experience a<br />
stronger mass shift towards lower masses. This mass shift<br />
is experimentally observable.<br />
In [6] previous studies of the nuclear many-body problem<br />
have been extended, in particular with respect to the<br />
isospin dependence of the forces within the relativistic<br />
Dirac Brueckner Hartree Fock (DBHF) approach. It is<br />
found that the proton properties are sensitive to the choice<br />
of the Bonn potential for isospin asymmetric nuclear matter.<br />
Furthermore, the neutron effective mass remains practically<br />
unaffected, whereas the proton mass experiences a<br />
sizable reduction, since in neutron rich matter proton properties<br />
depend much stronger on contributions from the np<br />
channel than neutron properties. In [7] a parameterization<br />
of the density dependent meson-nucleon coupling constants<br />
has been developed (DDRMF), which is based on<br />
the DBHF calculations [6]. This model has been used<br />
to study the properties of low density matter relevant in<br />
the crust of neutron stars, in particular for the so-called<br />
“pasta-phase”. At densities below 0.08 nucleons/fm 3 the<br />
DDRMF approach predicts non-homogeneous structures,<br />
which are similar (though less pronounced) to those predicted<br />
by Thomas-Fermi or Skyrme Hartree-Fock calculations<br />
for the “pasta-phase” in the crust of neutron stars.<br />
In order to effectively perform calculations within the<br />
nuclear shell model, a quick and reliable access to the basic<br />
nuclear matrix elements is need. By using the MAPLE<br />
software in [8] analytical representations of the basic Talmi<br />
integrals are obtained for a general class of two-body operators.<br />
This allows faster calculation of matrix elements for<br />
a wide class of two-body operators, icluding those which<br />
appear in description of neutrinoless double beta decay [9].<br />
References<br />
[1] L. Bravina et al., Phys. Rev. C 78, 014907 (2008).<br />
[2] E. Zabrodin et al., arXiv:0902.4601 [hep-ph].<br />
[3] E. Santini et al., Phys. Rev. C 78, 034910 (2008).<br />
[4] P. Srisawd et al., Int. J. Mod. Phys. A 22, 6219 (2008).<br />
[5] Y. M. Zheng et al., Commun. Theor. Phys. 50, 725 (2008).<br />
[6] E.N.E. van Dalen, C. Fuchs, and A. Faessler, Eur. Phys. J. A<br />
31, 29 (2007).<br />
[7] P. Gogelein, E. N. E. van Dalen, C. Fuchs and H. Müther,<br />
Phys. Rev. C 77, 025802 (2008).<br />
[8] L. Rodina, Amand Faessler, to be published.<br />
[9] F. Simkovic, A. Faessler, H. Müther, V. Rodin and M. Stauf,<br />
Phys. Rev. C 79, 055501 (2009).
<strong>GSI</strong> SCIENTIFIC REPORT 2009 NQMA-THEORY-05<br />
Dilepton production in neutron-proton collisions at HADES energies ∗<br />
R. Shyam 1,2 and U. Mosel 1<br />
1 Institut <strong>für</strong> Theoretische Physik, Universität Giessen, Germany; 2 Saha Institute of Nuclear Physics, Kolkata, India<br />
Experiments with High Acceptance Di-electron Spectrometer<br />
(HADES) are aimed at searching for medium<br />
modifications of hadrons at moderately high temperatures<br />
(T < 100 MeV) and baryonic densities up to 3 times the<br />
normal nuclear matter density. Due to negligible final state<br />
interactions with surrounding medium, dileptons provide a<br />
very clean and powerful probe for this purpose.<br />
Dilepton production was studied by the DLS collaboration<br />
at BEVALAC [1] at beam energies of 1–2<br />
GeV/nucleon. A large dilepton excess over the ”hadronic<br />
cocktail” was observed in the 12 C + 12 C and 40 Ca + 40 Ca<br />
collisions which could not be explained by theoretical models.<br />
This situation became known as the ”DLS puzzle”. To<br />
resolve this issue, the HADES experiment [2] has reinvestigated<br />
this reaction in 12 C + 12 C collision at similar beam<br />
energies. The remarkable fact is that the HADES data agree<br />
well with those of the DLS Collaboration. Therefore, there<br />
is no longer any question against the validity of the DLS<br />
data and the puzzle has now shifted to the theory side.<br />
In a recent transport model calculation it has been<br />
shown [3] that if larger cross sections are used for the<br />
proton-neutron (pn) bremsstrahlung process then the excess<br />
dilepton yields observed in 12 C + 12 C collisions by<br />
both the DLS and the HADES experiments can be reproduced.<br />
Enhanced pn bremsstrahlung cross sections,<br />
however, are not in agreement with the results presented<br />
in Refs. [4] and [5] where a fully relativistic and gaugeinvariant<br />
model has been employed to calculate the dilepton<br />
production in nucleon-nucleon (NN) collisions. On<br />
the other hand, calculations reported in Refs. [6] do support<br />
a larger value for this cross section. This is somewhat<br />
puzzling as the later model uses similar ingredients and the<br />
input parameters as those in Refs. [4, 5].<br />
We have taken up a systematic investigation of the dilepton<br />
production in the NN collisions at HADES energies<br />
within our fully relativistic and gauge-invariant model. We<br />
aim at describing the recent HADES data for this reaction<br />
reported very recently in Ref. [7]. Furthermore, we would<br />
also like to understand the reason for the differences seen<br />
between the results of Refs. [4, 5] and [6] as it has important<br />
implications for a proper theoretical interpretation of<br />
the HADES 12 C + 12 C data.<br />
In this report we examine the role of various meson exchange<br />
processes to the dilepton production in the pn collisions.<br />
In Fig. 1, we show individual contributions of the<br />
π- and ρ-exchange graphs to the invariant mass distribution<br />
of the dilepton production in the pn collisions at 1.25 GeV<br />
beam energy. Contributions of other meson exchange processes<br />
are relatively smaller. The coherent sum of the two<br />
∗ Work supported by <strong>GSI</strong> Darmstadt<br />
terms is also shown there. We note that π-exchange process<br />
dominates the cross sections and more significantly it<br />
interferes destructively with the ρ-exchange terms as the<br />
coherent sum of the two diagrams is even slightly smaller<br />
than the pion-only exchange term. This result is in contrast<br />
to the observations made in Ref. [6]. This implies that a<br />
larger ρ-exchange term will lead to even smaller total cross<br />
sections.<br />
As is shown in Ref. [8], the HADES dilepton data for pp<br />
collisions agree with the predictions of our model whereas<br />
the calculations of Ref. [6] overestimate them. We are currently<br />
carrying out investigations to explain the pn cross<br />
sections where a bump has been observed in the data in the<br />
mass region between 0.15 and 0.5 GeV/c 2 .<br />
dσ/dM [µb/(GeV/c 2 )]<br />
10 1<br />
10 0<br />
10 -1<br />
10 -2<br />
10 -3<br />
10 -4<br />
10 -5<br />
p + n 1.25 GeV<br />
π + ρ coherent sum<br />
π exchange only<br />
ρ exchange only<br />
0 0.1 0.2 0.3 0.4 0.5<br />
M (GeV/c 2 )<br />
Figure 1: Contributions of π (dotted line) and ρ (dashed<br />
line) exchange diagrams to the invariant mass distribution<br />
of the dileptons produced in proton-neutron collisions at<br />
the beam energy of 1.25 GeV. Their coherent sum is shown<br />
by the solid line<br />
References<br />
[1] R. J. Porter et al., Phys. Rev. Lett. 79 (1997) 1229.<br />
[2] G. Agakishiev et al., Phys. Lett. B663 (2008) 43.<br />
[3] E. Bratkovskaya and W. Cassing, Nucl. Phys. A807 (2008)<br />
214.<br />
[4] R. Shyam and U. Mosel, Phys. Rev. C 67 (2003) 065202.<br />
[5] R. Shyam and U. Mosel, Phys. Rev. C 79 (2009) 035203.<br />
[6] L.P. Kaptari and B. Kämpfer, Nucl. Phys. A764 (2006) 338;<br />
Phys. Rev. C 80 (2009) 064003<br />
[7] G. Agakishiev et al., arXiv:0910.5875 [nucl-ex].<br />
[8] B. Ramstein et al., arXiv:0912.2677 [nucl-ex].<br />
259
NQMA-THEORY-06 <strong>GSI</strong> SCIENTIFIC REPORT 2009<br />
Estimate of the magnetic field strength in heavy-ion collisions ∗<br />
V. Skokov † 1 , Yu. Illarionov 2 , and V. Toneev 3<br />
1 <strong>GSI</strong>, Darmstadt, Germany; 2 University of Trento, Italy; 3 JINR, Dubna, Russia<br />
One of the most exciting signals of the deconfinement<br />
and the chiral phase transitions in heavy-ion collisions, the<br />
chiral magnetic effect, suggested in Ref. [1], predicts the<br />
preferential emission of charged particles along the direction<br />
of angular momentum in the case of the noncentral<br />
heavy-ion collisions due to the presence of nonzero chirality.<br />
This effect is because the strong magnetic field in the<br />
presence of imbalanced chirality induces a current along<br />
the magnetic field. As it was stressed in Refs. [1, 2], both<br />
the deconfinement and the chiral phase transitions are essential<br />
for the chiral magnetic effect to take place.<br />
The effects caused by a strong magnetic field are not<br />
limited by the chiral magnetic effect [2]. They include<br />
also the induced chiral symmetry breaking, modification<br />
of the nature of the chiral phase transition (e.g. turning the<br />
crossover phase transition to the first-order one through influence<br />
on the chiral condensate), influence on the possible<br />
color-conducting phases and the pion condensate, spontaneous<br />
creation of the axial currents, and formation of the<br />
π0-domain walls. Recently, the effect of a large magnetic<br />
field on the sound velocity of a propagating plane wave was<br />
studied.<br />
The key quantity of these effects is a magnitude of the<br />
background magnetic field strength created in heavy-ion<br />
collisions. Early estimates of the magnetic field for RHIC<br />
energies was made in Ref. [1]. It was shown that the field<br />
may reach very high values eB ∼ 3·m 2 π ∼ 3×10¹⁸ Gauss.<br />
In Ref. [3] we improved the previous qualitative estimate<br />
by making the quantitative calculation of the magnetic field<br />
for heavy-ion collisions at different impact parameters and<br />
different energies and studying its characteristics. The calculations<br />
were carried out within the microscopic transport<br />
model, namely the Ultrarelativistic Quantum Molecular<br />
Dynamics model (UrQMD), and were complemented<br />
by analytical considerations.<br />
In Fig. 1, the time evolution of the magnetic field<br />
strength for SPS and RHIC energies is shown. The magnetic<br />
field is created in the noncentral Au–Au collision with<br />
the impact parameter b = 4 fm. The resulting field strength<br />
is averaged over 100 events to reduce statistical fluctuations.<br />
Note that this magnetic field strength is higher by about<br />
4 orders of magnitude than that in the surface of magnetar.<br />
The calculated dependence of the magnetic field strength<br />
on the coordinate y parallel to the direction of angular momentum<br />
demonstrates that the field stays approximately<br />
constant up to y ∼ 5 fm, showing the high degree of homogeneity<br />
in the central region.<br />
260<br />
∗ Work supported by Frankfurt Institute for Advanced Studies<br />
† V.Skokov@gsi.de<br />
2<br />
eB y /m π<br />
2<br />
eB y /m π<br />
0.2<br />
0.15<br />
0.1<br />
0.05<br />
b = 4 fm<br />
E lab =10A GeV<br />
E lab =60 A GeV<br />
E lab =160A GeV<br />
0<br />
0 2 4 6<br />
t, fm/c<br />
8 10<br />
2.5<br />
2<br />
b = 4 fm<br />
1/2<br />
s =130 GeV<br />
NN<br />
1/2<br />
=200 GeV<br />
1.5<br />
1<br />
0.5<br />
s NN<br />
0<br />
0 0.1 0.2 0.3 0.4 0.5<br />
t, fm/c<br />
Figure 1: The time evolution of the magnetic field strength<br />
eBy at the central point of colliding ions in Au–Au collisions<br />
with impact parameter, b = 4 fm, in the UrQMD<br />
model, for different bombarding energies. The magnetic<br />
field obtained by modelling the gold ions as two Lorenz<br />
contracted non-interacting uniformly charged spheres with<br />
radius R = 7 fm are shown by dashed lines.<br />
We estimated the lowest bound of the maximal magnetic<br />
field strength at the LHC energy √ sNN = 4.5 TeV to be<br />
about 15 · m2 π in collisions of Pb–Pb ions with the impact<br />
parameter b = 4 fm.<br />
References<br />
[1] D. E. Kharzeev, L. D. McLerran and H. J. Warringa, Nucl.<br />
Phys. A 803, 227 (2008) [arXiv:0711.0950].<br />
[2] K. Fukushima, D. E. Kharzeev and H. J. Warringa, Phys. Rev.<br />
D 78, 074033 (2008) [arXiv:0808.3382].<br />
[3] V. Skokov, A. Y. Illarionov and V. Toneev, Int. J. Mod. Phys.<br />
A 24 (2009) 5925 [arXiv:0907.1396].
<strong>GSI</strong> SCIENTIFIC REPORT 2009 NQMA-THEORY-07<br />
Ratio Fluctuations in Nucleus-Nucleus Collisions<br />
from Microscopic Transport Approach ∗<br />
E. L. Bratkovskaya 1 , M. I. Gorenstein 2,3 , M. Hauer 4 , and V. P. Konchakovski 1,4<br />
1 Institut <strong>für</strong> Theoretische Physik, JWG Universität Frankfurt, Germany; 2 Frankfurt Institute for Advanced Studies,<br />
University of Frankfurt, Germany; 3 Bogolyubov Institute for Theoretical Physics, Kiev, Ukraine; 4 Helmholtz Research<br />
School, University of Frankfurt, Germany<br />
Event-by-event fluctuations of the kaon-to-pion [1, 3, 4]<br />
as well as kaon-to-proton and proton-to-pion [2, 3, 4]<br />
number ratio in nucleus-nucleus collisions are studied<br />
within the statistical hadron-resonance gas model (SM) for<br />
different statistical ensembles and in the Hadron-String-<br />
Dynamics (HSD) transport approach. Substantial differences<br />
in the HSD and SM results are found for the fluctuations<br />
and correlations of the particle numbers.<br />
It has been found that the HSD model can qualitatively<br />
reproduce the measured excitation function for the K/π<br />
ratio fluctuations in central Au+Au (or Pb+Pb) collisions<br />
from low SPS up to top RHIC energies (Fig. 1, top). Accounting<br />
for the experimental acceptance as well as the<br />
centrality selection has a small influence on σKπ dyn and does<br />
not change the shape of the σKπ dyn excitation function.<br />
Thus, the HSD hadron-string model - which does not<br />
have a QGP phase transition and not explicitly includes the<br />
quark and gluon degrees of freedom - can reproduce qualitatively<br />
the experimental excitation function. In particular,<br />
it gives the rise of σKπ dyn with lowering the bombarding energy.<br />
This fact brings to the conclusion that the observable<br />
σKπ dyn might dominantly signal of nonequilibrium string dynamics<br />
rather than a phase transition of hadronic to partonic<br />
matter or to the QCD critical point.<br />
The data for σ Kp<br />
dyn in Pb+Pb collisions at the SPS energies<br />
will be available soon and allow for further insight. A<br />
comparison of the HSD results with preliminary STAR data<br />
in Au+Au collisions at RHIC energies are not fully conclusive:<br />
σdyn from the HSD calculations is approximately<br />
in agreement with data for the K/p ratio (Fig. 1, middle),<br />
but overestimates the experimental results for the p/π ratio<br />
(Fig. 1, bottom). New data on event-by-event fluctuations<br />
in Au+Au at RHIC energies will help to clarify the situation.<br />
References<br />
[1] M. I. Gorenstein, M. Hauer, V. P. Konchakovski and<br />
E. L. Bratkovskaya, Phys. Rev. C 79 (2009) 024907.<br />
[2] V. P. Konchakovski, M. Hauer, M. I. Gorenstein and<br />
E. L. Bratkovskaya, J. Phys. G 36 (2009) 125106.<br />
[3] V. P. Konchakovski, M. I. Gorenstein, E. L. Bratkovskaya and<br />
W. Greiner, to be printed in J. Phys. G, arXiv:1001.3085.<br />
[4] V. P. Konchakovski, M. Hauer, M. I. Gorenstein and<br />
E. L. Bratkovskaya, arXiv:0912.5157 [nucl-th].<br />
∗ Work supported by the Helmholtz International Center for FAIR<br />
within the the LOEWE program launched by the State of Hesse.<br />
<br />
<br />
<br />
<br />
<br />
<br />
<br />
<br />
<br />
<br />
<br />
<br />
<br />
<br />
<br />
<br />
<br />
<br />
<br />
<br />
<br />
<br />
<br />
<br />
<br />
<br />
<br />
<br />
<br />
<br />
<br />
<br />
<br />
<br />
<br />
<br />
<br />
<br />
<br />
<br />
<br />
<br />
<br />
<br />
<br />
<br />
<br />
<br />
<br />
<br />
<br />
<br />
<br />
<br />
<br />
Figure 1: The HSD results for the excitation function in<br />
σdyn for the K/π, K/p, p/π ratios within the experimental<br />
acceptance (solid line) in comparison to the experimental<br />
data measured by the NA49 Collaboration at SPS and<br />
by the STAR Collaboration at RHIC. The UrQMD calculations<br />
are shown by dotted lines.<br />
<br />
<br />
261
NQMA-THEORY-08 <strong>GSI</strong> SCIENTIFIC REPORT 2009<br />
Dileptons and charm as probes of the strongly interacting quark-gluon<br />
plasma (sQGP) within the parton-hadron-string dynamics (PHSD) transport ∗<br />
O. Linnyk †1 , E. L. Bratkovskaya 1 , and W. Cassing 2<br />
1 Frankfurt Institute for Advanced Studies, Frankfurt am Main, Germany; 2 Institut <strong>für</strong> Theoretische Physik, Universität<br />
Giessen, Giessen, Germany<br />
Figure 1: Multiplicity of q + ¯q events as a function of quark<br />
virtualities.<br />
Our ultimate goal is understanding the dynamical properties<br />
of the partonic phase with quarks, antiquarks and gluons<br />
as dynamical degrees of freedom (strongly interacting<br />
QGP) and the phase transition to an interacting hadronic<br />
system. During 2009 we focused on studying how the QGP<br />
phase transition influences the charm and dilepton production.<br />
The charm quark degrees of freedom are of particular<br />
importance since they are expected to be dominantly produced<br />
in the early, QGP state of the heavy ion collisions.<br />
The dileptons are well suited for an investigation of the violent<br />
phases of a high-energy heavy-ion collision, because<br />
they can leave the reaction volume essentially undistorted<br />
by final-state interactions. As ’research tools’ we are using<br />
effective field theory based on the high temperature QCD<br />
and the microscopic Parton-Hadron-String-Dynamics [1]<br />
(PHSD) transport approach.<br />
Dilepton radiation by the quasiparticles proceeds via the<br />
following elementary processes: q + ¯q → γ ∗ , q(¯q) + g →<br />
γ ∗ + q(¯q), and q + ¯q → g + γ ∗ . Note that in our calculations<br />
the running coupling αS (which depends on the local<br />
energy density according to a parametrization of lQCD<br />
data) is of the order O(1) and thus the contribution of the<br />
higher order diagrams is not subleading! Also, in order to<br />
make a quantitative comparison to experimental data at the<br />
realistically low photon virtuality M ∼ 1 GeV, we have<br />
taken into account the non-perturbative spectral functions<br />
and self-energies of quarks and gluons thus going beyond<br />
the leading twist (cf. Fig.1).<br />
∗ Work supported through the “HIC for FAIR” framework of the<br />
“LOEWE” program.<br />
† linnyk@fias.uni-frankfurt.de<br />
262<br />
Figure 2: Spectra of dileptons at SPS energy.<br />
In Fig. 2 we present PHSD results for the dilepton spectrum<br />
as produced in In + In reactions at 158 AGeV compared<br />
to the data of the NA60 Collaboration [2]. We find<br />
that the spectrum at invariant masses below 1 GeV is well<br />
reproduced by the ρ meson yield, if a broadening of the<br />
meson spectral function in the medium is assumed. On the<br />
other hand, the spectrum at M > 1 GeV is shown to be<br />
dominated by the partonic sources.<br />
At RHIC and LHC energies the radiation from QGP is<br />
expected to constitute a large contribution to the dilepton<br />
spectrum. On the other hand, at lower energies one probes<br />
the physics of the nuclear matter at extremely high baryonic<br />
densities as will be produced at the future experimental<br />
facility FAIR. The FAIR facility will allow the study of<br />
charm hadron production closer to the threshold for charm<br />
production in pp reactions so that in-medium effects might<br />
have a strong influence on the open and hidden charm production.<br />
The dilepton production at FAIR energies will reflect<br />
the properties of hadrons in the dense nuclear medium.<br />
References<br />
[1] W. Cassing and E. L. Bratkovskaya, Phys. Rev. C 78 (2008)<br />
034919, Nucl. Phys. A 831 (2009) 215.<br />
[2] S. Damjanovic et al., Nucl. Phys. A 783 (2007) 327c.<br />
[3] O. Linnyk, E.L. Bratkovskaya, W. Cassing, J. Phys. G 36<br />
(2009) 064059.<br />
[4] E.L. Bratkovskaya, W. Cassing, O. Linnyk, Phys. Lett. B 670<br />
(2009) 428.<br />
[5] O. Linnyk, E. L. Bratkovskaya and W. Cassing, Nucl. Phys.<br />
A 830, 491C (2009).
<strong>GSI</strong> SCIENTIFIC REPORT 2009 NQMA-THEORY-09<br />
In-Medium Properties of Vector Mesons in Elementary Nuclear Reactions ∗<br />
While the vacuum properties of most hadrons are known<br />
to reasonable accuracy today, it is a much-debated question<br />
how these properties change in nuclear matter. In particular<br />
for the light vector mesons there have been various theoretical<br />
predictions regarding their in-medium properties.<br />
One of the expected in-medium effects is the so-called<br />
’collisinal broadening’ of the meson spectral function, due<br />
to inleastic collisions with the hadronic medium. A second<br />
class of predictions claim that the vector meson masses will<br />
be shifted in the medium [1]. These changes of the peak<br />
mass are connected to the partial restoration of chiral symmetry<br />
in the medium and have been studied via QCD sum<br />
rules [2]. This effect has been claimed to be seen in experiments,<br />
but is still being discussed controversially.<br />
For studying in-medium effects, the more promiment<br />
hadronic decay modes of the vector mesons suffer from the<br />
drawback that they are affected by strong final-state interaction<br />
with the hadronic medium – in contrast to the rare<br />
dilepton decay modes, which only feel the electromagnetic<br />
force. Therefore they are ideally suited to carry the inmedium<br />
information outside to the detector, undisturbed<br />
by the hadronic medium.<br />
Although dilepton production has first been studied in<br />
heavy-ion collisions, we concentrate on elementary nuclear<br />
reactions in our work (γA, pA and πA). These have a number<br />
of advantages, in particular they involve a more sharply<br />
defined density and are simply much cleaner. This makes<br />
it easier to interpret the resulting spectra and to disentangle<br />
the various contributing channels.<br />
Experimentally, dilepton spectra from elementary nuclear<br />
reactions are being studied e.g. with the CLAS detector<br />
at JLAB, where Bremsstrahlung photons in the energy<br />
range of about 1-3 GeV are shot on nuclei [3], or by the<br />
E325 experiment at the Japanese KEK facility, where 12<br />
GeV protons are used as projectile [4]. Also the HADES<br />
detector at <strong>GSI</strong> has an ambitious program for measuring<br />
dilepton spectra from AA, pA and pp reactions [5]. On the<br />
side of the hadronic decays, most notably ω → π 0 γ is being<br />
investigated by the CB/TAPS group in photon-induced<br />
reactions at the ELSA accelerator [6].<br />
For the numerical simulation of these processes we use<br />
the GiBUU transport model, which provides a unified<br />
framework for various types of elementary reactions on nuclei<br />
as well as heavy-ion collisions [7, 8, 9]. This model<br />
takes care of the correct transport-theoretical description of<br />
the hadronic degrees of freedom in nuclear reactions and<br />
all the subtleties this may involve, including the propagation,<br />
collisions and decays of particles in a nuclear envi-<br />
∗ Work supported by DFG.<br />
† janus.weil@theo.physik.uni-giessen.de<br />
J. Weil † 1 and U. Mosel 1<br />
1 Institut <strong>für</strong> Theoretische Physik, JLU Giessen, Germany<br />
dσ/dμ [a.u.]<br />
10 3<br />
10 2<br />
10 1<br />
10 0<br />
10 -1<br />
10 -2<br />
10 -3<br />
0 0.2 0.4 0.6 0.8 1 1.2<br />
μ [GeV]<br />
total<br />
ρ → e + e -<br />
ω → e + e -<br />
φ → e + e -<br />
ω → π 0 e + e -<br />
π 0 → e + e - γ<br />
η → e + e - γ<br />
Δ → Ne + e -<br />
data<br />
Figure 1: Dilepton spectrum for p+p@3.5GeV.<br />
ronment. For the investigation of in-medium properties of<br />
vector mesons, the most crucial parts of the transport model<br />
are: 1) The production mechanisms of vector mesons on<br />
nuclei, e.g. γN → VX or NN → VX. 2) The description<br />
of the VN interaction, which is responsible for<br />
absorption and collisional broadening. 3) A proper offshell<br />
treatment in the propagation of vector mesons and<br />
the handling of density-dependent spectral functions. 4)<br />
A correct description of the background processes (Dalitz<br />
decays, Bremsstrahlung, etc).<br />
Fig. 1 shows a preliminary comparison plot of a GiBUU<br />
simulation to HADES data. The simulation results have not<br />
been corrected for the full HADES acceptance yet. Only<br />
simple kinematical cuts have been applied. Still the simulation<br />
reasonably reproduces the shape of the data over<br />
most of the spectrum, apart from a slight underestimation<br />
in the intermediate region (possibly due to the missing<br />
bremsstrahlung contribution).<br />
References<br />
[1] G.E. Brown, M. Rho, Phys. Rev. Lett. 66 (1991) 2720.<br />
[2] T. Hatsuda, S.H. Lee, Phys. Rev. C 46 (1992) R34.<br />
[3] M.H. Wood et al., Phys. Rev. C 78 (2008) 015201.<br />
[4] M. Naruki et al., Phys. Rev. Lett. 96 (2006) 092301.<br />
[5] I. Fröhlich et al., Int.J.Mod.Phys.A24 (2009) 317-326.<br />
[6] M. Kotulla et al., Phys. Rev. Lett. 100 (2008) 192302.<br />
[7] http://gibuu.physik.uni-giessen.de<br />
[8] M. Effenberger et al., Phys. Rev. C 60(1999) 044614.<br />
[9] P. Mühlich, U. Mosel, Nucl. Phys. A 773 (2006) 156-172.<br />
263
NQMA-THEORY-10 <strong>GSI</strong> SCIENTIFIC REPORT 2009<br />
Pion induced coherent strangeness production ∗<br />
2<br />
2<br />
branching ratios for the decay to the K + Λ channel. Terms<br />
corresponding to the interference among various resonance<br />
excitations are included in the total reaction amplitude.<br />
We find that excitations of N ∗ (1650), and N ∗ (1710) resonant<br />
states dominate the cross sections for the (π + , K + )<br />
reaction for beam energies below 2 GeV. Our model describes<br />
well the shapes of the experimental angular dis-<br />
∗ Work supported by EU, EURONS contract No. 506065.<br />
† stefan.bender@theo.physik.uni-giessen.de<br />
S. Bender † 1 , H. Lenske 1,2 , and R. Shyam 3<br />
1 2 3 Institut <strong>für</strong> Theoretische Physik, Universität Gießen, Germany; <strong>GSI</strong>, Darmstadt, Germany; Saha Institute of Nuclear<br />
Physics, Kolkata, India<br />
We investigated pion induced coherent strangeness production<br />
on light ( 12C) and medium-heavy ( 40Ca, 51V, 89Y) nuclei with a covariant model. This model was based on a<br />
Lagrangian approach, where resonance excitation and decay<br />
is the driving mechanism behind the elementary process.<br />
The aim of this work was to apply this model, which<br />
was already successfully applied to strangeness production<br />
on nuclei in proton [1, 2] and photon [3] induced reactions,<br />
to pion-nucleus reactions.<br />
Since the Λ is not subject to Pauli <strong>block</strong>ing with respect<br />
to the other nucleons, it provides an excellent probe for the<br />
interplay of single-particle and many-body degrees of freedom<br />
in nuclei. They are, therefore, a suitable choice when<br />
it comes to verify our models of these bound states and for<br />
doing spectroscopy.<br />
The theoretical description, however, gets rather involved<br />
since one is dealing with interacting many-body<br />
systems and approximations are necessary when dealing<br />
with them. Most of the theoretical models used so far to describe<br />
the (π + , K + ) reaction employ a non-relativistic distorted<br />
wave impulse approximation (DWIA) framework [4,<br />
5] without resolving the production vertex. In these calculations,<br />
the Λ bound states are generated by solving the<br />
Schrödinger equation with Woods–Saxon or harmonic oscillator<br />
potentials. However, for processes involving momentum<br />
transfers of typically 300 MeV/c or more, a nonrelativistic<br />
treatment of the corresponding wave functions<br />
may not be adequate as in this region the lower component<br />
of the Dirac spinor is no longer negligible in comparison to<br />
its upper component.<br />
In our work [6, 7], we studied the A(π + , K + )ΛA reaction<br />
within a fully covariant model by retaining the field<br />
theoretical structure of the interaction vertices and by treating<br />
the baryons as Dirac particles. In this model, the kaon<br />
production proceeds via the collision of the projectile pion<br />
with one of the target nucleons. This excites intermediate<br />
baryon resonance states (N ∗ ) which decay into a kaon and<br />
a Λ hyperon. The hyperon is captured in the respective nuclear<br />
orbit while the kaon rescatters onto its mass shell. The<br />
intermediate resonance states included are N ∗ (1650)[ 1−<br />
2 ],<br />
N ∗ (1710)[ 1<br />
tributions [8] for the two states which corresponds to the<br />
prominent peaks in the<br />
+ ∗ 3+<br />
], and N (1720)[ ] which have dominant<br />
12 ΛC spectrum. The total cross sections<br />
show a substantial dependence on the beam energy<br />
with a distinct peak around 1 GeV for reactions on both<br />
12 40 C and Ca targets. The differential cross sections peak<br />
near zero degrees for both light mass as well as heavier targets.<br />
Thus, measurements at forward angles and at beam<br />
energies around 1 GeV are expected to have high yields.<br />
The characteristic bump structures reflecting the Λ major<br />
shell orbits as seen in the spectra of the 51 ΛV and 89 ΛY<br />
hypernuclei (see figure 1 for 89 ΛY) were reproduced reasonably<br />
well by our model [6, 7]. However, for a quantitative<br />
description of the spectra, more realistic calculations with<br />
configuration mixed Λ particle, neutron hole states are required.<br />
Mixing of the different parity states within a given<br />
particle-hole configuration may also be needed.<br />
1.4<br />
1.2<br />
total<br />
data<br />
fΛ<br />
1<br />
0.8<br />
dΛ<br />
0.6<br />
0.4<br />
0.2<br />
0<br />
−30<br />
pΛ<br />
sΛ<br />
−25 −20 −15 −10 −5 0<br />
−Ebind [MeV]<br />
Figure 1: The excitation spectrum compared to experimental<br />
data for the 89 ΛY hypernucleus.<br />
References<br />
[1] R. Shyam, H. Lenske and U. Mosel, Phys. Rev. C69, 065205<br />
(2004), [arXiv:nucl-th/0308085].<br />
[2] R. Shyam, H. Lenske and U. Mosel, Nucl. Phys. A764, 313<br />
(2006), [arXiv:nucl-th/0505043].<br />
[3] R. Shyam, H. Lenske and U. Mosel, Phys. Rev. C77, 052201<br />
(2008), [arXiv:0710.4888].<br />
[4] C. B. Dover, L. Ludeking and G. E. Walker, Phys. Rev. C22,<br />
2073 (1980).<br />
264<br />
¯σ2 ◦ –14◦ [µb/sr·0.25 MeV]<br />
[5] H. Band ō, T. Motoba and J. ˇZofka, Int. J. Mod. Phys. A5,<br />
4021 (1990).<br />
[6] S. Bender, Pion induced coherent strangeness production<br />
on light and medium-heavy nuclei, PhD thesis, Universität<br />
Gießen, 2009.<br />
[7] S. Bender, R. Shyam and H. Lenske, arXiv:0910.4868.<br />
[8] H. Hotchi et al., Phys. Rev. C64, 044302 (2001).
<strong>GSI</strong> SCIENTIFIC REPORT 2009 NQMA-THEORY-11<br />
���ÖÑÓÒ�ÙÑ �Ò �ÓØ �Ò� ��Ò×� Ñ���ÙÑ �ÖÓÑ É�� ×ÙÑ ÖÙÐ�× £<br />
Ã�Ò�� ÅÓÖ�Ø� �Ò� ËÙ ÀÓÙÒ� Ä��<br />
�ËÁ ��ÖÑ×Ø��Ø ��ÖÑ�ÒÝ� ÁÈ�È �ÓÒ×�� ÙÒ�Ú�Ö×�ØÝ Ë�ÓÙÐ ÃÓÖ��<br />
À��ÚÝ ÕÙ�Ö�ÓÒ�ÙÑ ×Ù � �× Â�� ÔÖÓÚ���× � ÔÖÓ��<br />
Ó� ÓÒ¢Ò�Ñ�ÒØ �� ÓÒ¢Ò�Ñ�ÒØ ØÖ�Ò×�Ø�ÓÒ �Ò É�� � ℄<br />
Ï��Ð� �Ò Ñ���ÙÑ ÑÓ��¢ �Ø�ÓÒ Ó�ÕÙ�Ö� �ÒØ�ÕÙ�Ö� ÔÓØ�Ò<br />
Ø��Ð �Ò� ×Ù�×�ÕÙ�ÒØ ��Ò�� Ó�Ø�� �ÓÙÒ� ×Ø�Ø� ÔÖÓÔ�ÖØ��×<br />
��Ú� ���Ò ×ØÙ���� Û� ��Ú� ��Ú�ÐÓÔ�� � É�� ×ÙÑ ÖÙÐ�<br />
�ÔÔÖÓ� � ØÓ �Ò Ñ���ÙÑ ÑÓ��¢ �Ø�ÓÒ Ó�Ø�� ���ÚÝ ÕÙ�Ö�Ó<br />
Ò�� �Ý ÙØ�Ð�Þ�Ò� Ø�ÑÔ�Ö�ØÙÖ� ��Ô�Ò��ÒØ �ÐÙÓÒ ÓÒ��Ò×�Ø�×<br />
� � �℄ ËÓ ��Ö �Ò�ÐÝ×�× ��Ú� ���Ò Ð�Ñ�Ø�� ØÓ ÔÙÖ� ��Ù��<br />
�×� Ó� Û�� � Ð�ØØ� � É�� Ö�×ÙÐØ× Û�Ö� Ù×�� ØÓ �ÜØÖ� Ø<br />
�ÐÙÓÒ ÓÒ��Ò×�Ø�× ÁÒ Ø��× ÛÓÖ� Û� ¢Ö×Ø �ÜØ�Ò� Ø�� �Ö�Ñ�<br />
ÛÓÖ� ØÓ Ø�� �ÙÐÐ É�� �×� �Ý ÑÓ��Ð�Ò� Ø�� �ÐÙÓÒ ÓÒ��Ò<br />
×�Ø�× Ó����ÖÓÒ� Ñ�ØØ�Ö Û�Ø� � Ö�×ÓÒ�Ò � ��× Ì��Ò Û�<br />
�Ð ÙÐ�Ø� Ø�� Ñ�×× ×���Ø Ó� Â�� �Ò� � �Ò� �Ü�Ñ�Ò� ÔÓ×<br />
×��Ð� �ÑÔÐ� �Ø�ÓÒ ØÓ �ÜÔ�Ö�Ñ�ÒØ�Ð ��Ø� �Ò Ø�� ÓÒØ�ÜØ Ó�Ø��<br />
×Ø�Ø�×Ø� �Ð ���ÖÓÒ�Þ�Ø�ÓÒ<br />
Ì�� × �Ð�Ö �Ò� ØÛ�×Ø �ÐÙÓÒ ÓÒ��Ò×�Ø�× Û�� � �Ö�<br />
Ø�� ÐÓÛ�×Ø ��Ñ�Ò×�ÓÒ�Ð ÓÔ�Ö�ØÓÖ× �Ò Ø�� ÓÔ�Ö�ØÓÖ ÔÖÓ�Ù<br />
Ø�ÓÒ �ÜÔ�Ò×�ÓÒ ÇÈ� Ó�Ø�� ���ÚÝ ÕÙ�Ö� ÙÖÖ�ÒØ ÓÖÖ�Ð�<br />
ØÓÖ �Ö� Ö�Ð�Ø�� ØÓ Ø�� �ÐÙÓÒ� Ô�ÖØ Ó�Ø�� �Ò�Ö�Ý ÑÓÑ�ÒØÙÑ<br />
Ø�Ò×ÓÖ Ó�É�� �× � Ì � �Ú� � Å Ì �Ò�<br />
� Ì �<br />
«× Ì<br />
�<br />
�<br />
Å Ì Û��Ö� Ø�� Å �Ò� Å ÓÖÖ�<br />
×ÔÓÒ� ØÓ Ø�� �ÐÙÓÒ� Ô�ÖØ Ó�Ø�� ØÖ� � �ÒÓÑ�ÐÝ �Ò� ×ÝÑ<br />
Ñ�ØÖ� �Ò� ØÖ� �Ð�×× Ô�ÖØ ×Ù � Ø��Ø Å Ì � � Ô �Ò�<br />
Å Ì �� Ô �Ò Ø�� ÔÙÖ� ��Ù�� Ø��ÓÖÝ Ö�×Ô� Ø�Ú�ÐÝ ÇÒ�<br />
Ò���× ØÓ ×Ù�ØÖ� Ø Ø�� ÕÙ�Ö� ÓÒØÖ��ÙØ�ÓÒ �ÖÓÑ Ø�� �Ò�Ö�Ý<br />
ÑÓÑ�ÒØÙÑ Ø�Ò×ÓÖ ØÓ Ó�Ø��Ò Ø�� �ÐÙÓÒ� Ô�ÖØ ÌÓ �ÖÖÝ ÓÙØ<br />
Ø�� ×Ù�ØÖ� Ø�ÓÒ Û� ÑÓ��Ð Ø�� �ÐÙÓÒ� Ô�ÖØ ÓÒ Ø�� �Ò�ÐÓ�Ý<br />
Û�Ø� Ø�� �×� Ó�ÐÓÛ ��Ò×�ØÝ ÒÙ Ð��Ö Ñ�ØØ�Ö �Ò Û�� � Ø��<br />
Ð�Ò��Ö ��Ò×�ØÝ �ÔÔÖÓÜ�Ñ�Ø�ÓÒ �× Ù×��<br />
Š�� � � �<br />
Š�� � � �<br />
��Ñ �<br />
��� �<br />
� �<br />
À�Ö� �� ��ÒÓØ�× Ø�� ÒÙÑ��Ö ��Ò×�ØÝ Ó�� ���ÖÓÒ ×Ô� ��× �<br />
Û�Ø� Ñ�×× Ñ� �Ð ÙÐ�Ø�� �ÖÓÑ � Ö�×ÓÒ�Ò � ��× ÑÓ��Ð Û�Ø�<br />
�Ü ÐÙ��� ÚÓÐÙÑ� ÓÖÖ� Ø�ÓÒ ��℄ Ì�� ×Ù�× Ö�ÔØ �Ò �Õ<br />
Ñ��Ò× Ø�� ��Ö�Ð Ð�Ñ�Ø Û�� � ×Ù�ØÖ� Ø× Ø�� ��ÖÑ�ÓÒ� ÓÒ<br />
ØÖ��ÙØ�ÓÒ Ì�� ÑÓÑ�ÒØ Ó�Ø�� �ÐÙÓÒ ��×ØÖ��ÙØ�ÓÒ �ÙÒ Ø�ÓÒ<br />
�� � �Ò �� ×���ÐÝ Ø���Ò ØÓ �� ÓÑÑÓÒ Ú�ÐÙ� � Ì�� �Ü<br />
ÐÙ��� ÚÓÐÙÑ� �× ��Ø�ÖÑ�Ò�� �Ý � ¢Ø ØÓ Ø�� �ÕÙ�Ø�ÓÒ Ó�×Ø�Ø�<br />
�Ò� �ÐÙÓÒ� Ô�ÖØ Ó�Ø�� ØÖ� � �ÒÓÑ�ÐÝ Ñ��×ÙÖ�� �Ò Ø� Ð�Ø<br />
�×Ø Ð�ØØ� � É�� ��℄<br />
×�ÓÛÒ �Ò ���<br />
Ì�� Ö�×ÙÐØ�ÒØ �ÐÙÓÒ ÓÒ��Ò×�Ø�× �Ö�<br />
Ì�� Ñ�×× Ó� ��ÑÓÒ�ÙÑ �× �Ð ÙÐ�Ø�� Û�Ø� �ÓÖ�Ð ØÖ�Ò×<br />
�ÓÖÑ�� É�� ×ÙÑ ÖÙÐ� �× ��× Ö���� �Ò Ê�� ��℄ ÈÓ××��Ð�<br />
�ÖÓ��Ò�Ò� �× �Ð×Ó Ø���Ò �ÒØÓ � ÓÙÒØ �ÙØ � �× Ó�Ø��Ò��<br />
�Ò ÑÓ×Ø �×�× ��Ø�Ö ÓÔØ�Ñ�Þ�Ø�ÓÒ Ï� �ÜÔÐÓÖ� Ú�Ö�ÓÙ× Ø�Ñ<br />
Ô�Ö�ØÙÖ�× �Ò� ��Ñ� �Ð ÔÓØ�ÒØ��Ð× �Ò��ÖÖ�� �ÖÓÑ ×Ø�Ø�×Ø� �Ð<br />
£ ÏÓÖ� ×ÙÔÔÓÖØ�� �Ý ÃÓÖ��Ò Å�Ò�×ØÖÝ Ó� ��Ù �Ø�ÓÒ<br />
G 0 [GeV 4 ]<br />
0.015<br />
0.014<br />
G 2 [GeV 4 ]<br />
-0.0005<br />
-0.001<br />
0.013<br />
0.012<br />
0.011<br />
v0 =0.55 fm<br />
0.01<br />
135 140 145 150 155 160 165 170 175 180<br />
T [MeV]<br />
3<br />
-0.0015<br />
μB =0 MeV<br />
20 MeV<br />
38 MeV<br />
-0.002<br />
240 MeV<br />
298 MeV<br />
403 MeV<br />
-0.0025<br />
-0.003<br />
135 140 145 150 155 160 165 170 175 180<br />
T [MeV]<br />
���ÙÖ� � �ÐÙÓÒ ÓÒ��Ò×�Ø�× �Ø Ú�Ö�ÓÙ× ��Ñ� �Ð ÔÓØ�ÒØ��Ð×<br />
���ÖÓÒ�Þ�Ø�ÓÒ Ô� ØÙÖ� ��℄ Ï� ¢Ò� Ø��Ø Ø�� �ÓÛÒÛ�Ö� Ñ�××<br />
×���Ø Ó� Â�� �Ò� � �× � � Å�Î �Ò� � � �<br />
Å�Î �Ò ÓÐÐ�×�ÓÒ× Û�Ø� Ô ×ÆÆ � ��Î Ö�×Ô� Ø�Ú�ÐÝ Ï�<br />
�Ü�Ñ�Ò� Ø�� ���� Ø Ó� Ñ�×× Ö��Ù Ø�ÓÒ �Ò Ø�� ×Ø�Ø�×Ø� �Ð ÔÖÓ<br />
�Ù Ø�ÓÒ Ó�Ø�� ��ÖÑÓÒ�� �× ×�ÓÛÒ �Ò ��� ÇÒ� ×��× Ø��<br />
Ñ�×× Ö��Ù Ø�ÓÒ Ö�×ÙÐØ× �Ò ÒÓØ��Ð� ��Ò��× �Ò Ø�� Ô�ÖØ� Ð� Ö�<br />
Ø�Ó<br />
σ ψ′ /σ J/ψ<br />
0.1<br />
Exp. data<br />
No mass shift<br />
δm<br />
0.08 J/ψ = -17 MeV, δmχc = -40 MeV<br />
δmJ/ψ = -30 MeV, δmχc = -70 MeV<br />
0.06<br />
0.04<br />
0.02<br />
0<br />
-200 -150 -100 -50 0<br />
ψ′ mass shift [MeV]<br />
R χc<br />
0.07<br />
0.06<br />
0.05<br />
0.04<br />
0.03<br />
0<br />
0.02<br />
No mass shift<br />
0.01δmJ/ψ<br />
= -17 MeV, δmχc = -40 MeV<br />
δmJ/ψ = -30 MeV, δmχc = -70 MeV<br />
0<br />
-200 -150 -100 -50 0<br />
ψ′ mass shift [MeV]<br />
���ÙÖ� � È�ÖØ� Ð� ÒÙÑ��Ö Ö�Ø�Ó �× � �ÙÒ Ø�ÓÒ Ó� � Ñ�××<br />
×���Ø Ä��Ø� Æ � �Æ� Ê���Ø� �Ö� Ø�ÓÒ Â�� ÓÑ�Ò� �ÖÓÑ �<br />
Ê���Ö�Ò �×<br />
� ℄ Ì Å�Ø×Ù� À Ë�ØÞ È�Ý× Ä�ØØ � �� ��� � �<br />
� ℄ Ì À�×��ÑÓØÓ Ç Å�Ý�ÑÙÖ� à À�ÖÓ×� Ì Ã�Ò�� È�Ý× Ê�Ú<br />
Ä�ØØ �� ���<br />
� ℄ à ÅÓÖ�Ø� Ë À Ä�� È�Ý× Ê�Ú Ä�ØØ �<br />
��℄ à ÅÓÖ�Ø� Ë À Ä�� È�Ý× Ê�Ú � �� � ��� �<br />
��℄ � ËÓÒ� Ë À Ä�� à ÅÓÖ�Ø� È�Ý× Ê�Ú � �� �<br />
�� �<br />
��℄ � À Ê�× ��� Å Á �ÓÖ�Ò×Ø��Ò À ËØ�Ó ��Ö Ï �Ö��Ò�Ö �<br />
È�Ý× � � �� ���<br />
��℄ � ��Þ�ÚÓÚ �Ø�Ð È�Ý× Ê�Ú � � � �� �<br />
��℄ à ÅÓÖ�Ø� Ë À Ä�� �Ö��Ú� � � ���<br />
��℄ � �Ò�ÖÓÒ� È �Ö�ÙÒ ÅÙÒÞ�Ò��Ö Â ËØ� ��Ð ÆÙ Ð È�Ý×<br />
��� � ��<br />
265
NQMA-THEORY-12 <strong>GSI</strong> SCIENTIFIC REPORT 2009<br />
Statistical hadronization of heavy flavor quarks in elementary collisions:<br />
successes and failures<br />
A. Andronic 1 , F. Beutler 6 , P. Braun-Munzinger 1,2,3,4 , K. Redlich 5,2 , and J. Stachel 6<br />
1 <strong>GSI</strong> Darmstadt, Germany; 2 ExtreMe Matter Institute, <strong>GSI</strong> Darmstadt, Germany; 3 Technical University Darmstadt,<br />
Germany; 4 FIAS, J.W Goethe University, Frankfurt, Germany; 5 University of Wrocław, Poland; 6 University of<br />
Heidelberg, Germany<br />
We analyze recently compiled data on the production of<br />
open heavy flavor hadrons and quarkonia in e + e − as well<br />
as pp and p-nucleus collisions in terms of the statistical<br />
hadronization model [1].<br />
In Fig. 1 we show a comparison of data and model prediction.<br />
for charmed and bottom hadron yields in e + e −<br />
annihilations at √ s=91 GeV. For the model we have used<br />
the parameter set: T =170 MeV, V =16 fm 3 and γs=0.66,<br />
which represents the best fit of multiplicities of hadrons<br />
with lighter quarks [1].<br />
Multiplicities<br />
1<br />
-1<br />
10<br />
-2<br />
10<br />
-3<br />
10<br />
-4<br />
10<br />
-5<br />
10<br />
-6<br />
10<br />
-7<br />
10<br />
-8<br />
10<br />
Data<br />
+ -<br />
e e ,<br />
s=91<br />
GeV<br />
3<br />
Model, T=170 MeV, V=16 fm , γ =0.66<br />
s<br />
5-flavor<br />
15<br />
no flavor, bottom: x10<br />
+<br />
D<br />
0<br />
D<br />
+<br />
Ds<br />
+<br />
D*<br />
+<br />
Ds*<br />
±<br />
Ds1<br />
±<br />
*<br />
s2<br />
D<br />
J/ ψ<br />
pr<br />
J/ ψ<br />
ψ’<br />
χ<br />
c1<br />
+<br />
Λc<br />
+<br />
B<br />
0<br />
B<br />
0<br />
Bs<br />
B*<br />
Υ<br />
0<br />
Λb -<br />
Ξb<br />
Figure 1: Multiplicities of hadrons with charm and bottom<br />
quarks in e + e − collisions compared to the thermal model<br />
calculations for two cases: i) the 5-flavor jet scheme (thick<br />
lines) and ii) no (net) flavor jet scheme (thin lines with diamonds).<br />
Note, for case ii) the factor 10 15 used to scale the<br />
model calculations for bottom hadrons to fit in the plotting<br />
range.<br />
The calculation employing the 5-flavor scheme is in very<br />
good agreement with the data. Despite this overall agreement,<br />
the exceptions are significant: the Υ meson yield is<br />
underpredicted by the model by 17 orders of magnitude,<br />
while the prompt J/ψ yield is underpredicted by almost 2<br />
orders of magnitude. Obviously, the production of quarkonia<br />
is expected to be strongly suppressed in the statistical<br />
model. The disagreement is a consequence of the separate<br />
hadronization of the c and ¯c quarks. The measured<br />
prompt J/ψ production in Z 0 decays (into hadrons) is about<br />
3×10 −4 . The thermal model predicts a prompt yield for<br />
J/ψ of 4.1×10 −6 (1.6×10 −7 for ψ ′ and 4.3×10 −7 for χc1),<br />
identically for the two calculation schemes. Whenever the<br />
model seems to describe the yields of charmonia the measured<br />
yields are dominated by the feed down from bottom<br />
hadrons and the agreement only reflects the agreement seen<br />
for the open bottom hadrons and their branching ratios to<br />
266<br />
charmonia, properly considered in the model.<br />
The calculation employing a purely thermal ansatz underpredicts<br />
all the measurements by many oders of magnitude,<br />
while for the light quark sector the differences between<br />
calculations with a pure thermal model and with the<br />
5-flavor quark-antiquark scheme were found to be small<br />
[1]. This reflects the fact that a negligible number of c and<br />
b quarks are formed in the fragmentation process.<br />
σ ψ , /σ J/ψ<br />
0.25<br />
0.2<br />
0.15<br />
0.1<br />
0.05<br />
0<br />
Data<br />
Statistical model<br />
10 10 2<br />
pA<br />
PbPb<br />
√s NN (GeV)<br />
Figure 2: Production cross section of ψ ′ relative to J/ψ.<br />
In Fig. 2 we show the model comparison to data for the<br />
relative production cross section of J/ψ and ψ ′ charmonia.<br />
The measurements in pA collisions are about a factor<br />
4 above the model values. The relative production cross<br />
sections of charmonium states cannot be described in the<br />
thermal approach. This is in sharp contrast to the (only<br />
currently existing) measurement in central nucleus-nucleus<br />
collisions, performed at the SPS by the NA50 experiment,<br />
which is well described. We recall that it was in part the observation<br />
of this measurement that brought forward the idea<br />
of statistical production of charmed hadrons in nucleusnucleus<br />
collisions [2]. We note that the pA data exhibit a<br />
constant ψ ′ /J/ψ production ratio as a function of energy.<br />
In the model, the value is determined only by the temperature<br />
and this is reflected in the slight decrease of the ratio<br />
towards low energies. A constant value, also up to the LHC<br />
energies, is predicted beyond √ sNN ≃20 GeV.<br />
References<br />
[1] A. Andronic, F. Beutler, P. Braun-Munzinger, K. Redlich,<br />
J. Stachel, Phys. Lett. B 675 (2009) 312 [arXiv:0804.4132],<br />
Phys. Lett. B 678 (2009) 350 [arXiv:0904.1368].<br />
[2] P. Braun-Munzinger, J. Stachel, Phys. Lett. B 490 (2000) 196<br />
[nucl-th/0007059].
<strong>GSI</strong> SCIENTIFIC REPORT 2009 NQMA-THEORY-13<br />
The horn, the hadron mass spectrum and the QCD phase diagram<br />
A. Andronic 1 , P. Braun-Munzinger 1,2,3,4 , and J. Stachel 5<br />
1 <strong>GSI</strong> Darmstadt, Germany; 2 ExtreMe Matter Institute, <strong>GSI</strong> Darmstadt, Germany; 3 Technical University Darmstadt,<br />
Germany; 4 FIAS, J.W Goethe University, Frankfurt, Germany; 5 University of Heidelberg, Germany<br />
The analysis of hadron yields measured in central heavy<br />
ion collisions from AGS up to RHIC energies has shown<br />
[2] that hadron multiplicities can be described very well<br />
with a hadro-chemical equilibrium approach which is governed<br />
by the chemical freeze-out temperature T, baryochemical<br />
potential µb, and the fireball volume V. The main<br />
result of these investigations was that the extracted temperature<br />
values rise rather sharply from low energies on<br />
towards √ sNN ≃10 GeV and reach afterwards constant<br />
values near T =160 MeV, while the baryochemical potential<br />
decreases smoothly as a function of energy. While in<br />
general all hadron yields are described rather quantitatively<br />
[2], a notable exception was up-to-now the energy dependence<br />
of the K + /π + ratio which exhibits a rather marked<br />
maximum, “the horn” [3], near √ sNN ≃ 10 GeV [4].<br />
dN/dy<br />
2<br />
10<br />
10<br />
1<br />
−1<br />
10<br />
Data<br />
π+<br />
π<br />
STAR<br />
PHENIX<br />
BRAHMS<br />
sNN=200<br />
GeV<br />
Model, χ2/N<br />
=29.7/11<br />
df<br />
3<br />
T=164 MeV, µ = 30 MeV, V=1950 fm<br />
b<br />
− +<br />
K −<br />
K p p Λ Λ −<br />
Ξ +<br />
Ξ Ω φ d d K* Σ * Λ*<br />
Figure 1: Experimental hadron yields and model fit at 200<br />
GeV.<br />
We have performed recently [1] a new analysis of hadron<br />
production in central nucleus-nucleus collisions, with the<br />
aim to explore the consequences of an improved hadronic<br />
mass spectrum in which the σ meson and many higherlying<br />
resonances are included. An example of a fit to the<br />
data is shown in Fig. 1 for the energy of 200 GeV. The<br />
model is successful in reproducing the measurements and<br />
this applies to all energies, from 2 AGeV beam energy<br />
(fixed target) up to the top RHIC energy of √ sNN =200<br />
GeV. The reduced χ 2 values are reasonable. In most cases<br />
the fit quality is improved compared to our earlier analysis<br />
[2], even though the experimental errors are now smaller.<br />
An important result of our analysis is that the resulting thermal<br />
parameters are close to those obtained earlier [2].<br />
We employ parametrizations of T and µb to investigate<br />
the energy dependence of the relative production yields<br />
K + /π + and Λ/π − , shown in Fig. 2. The K + /π + ratio<br />
shows a rather pronounced maximum at a beam energy<br />
K + / π +<br />
Λ / π -<br />
0.25<br />
0.2<br />
0.15<br />
0.1<br />
0.05<br />
0<br />
0.2<br />
0.175<br />
0.15<br />
0.125<br />
0.1<br />
0.075<br />
0.05<br />
0.025<br />
0<br />
µ b<br />
10 10 2<br />
T<br />
thermal model<br />
STAR PHENIX<br />
NA49 NA44<br />
E802,E866<br />
E866,E895<br />
E895 E896<br />
NA49<br />
NA57,NA44<br />
STAR<br />
thermal model<br />
10 3<br />
√s NN (GeV)<br />
160<br />
140<br />
120<br />
100<br />
80<br />
60<br />
800<br />
700<br />
600<br />
500<br />
400<br />
300<br />
200<br />
100<br />
0<br />
T (MeV)<br />
µ b (MeV)<br />
Figure 2: Energy dependence of the relative production ratios<br />
K + /π + and Λ/π − . The dashed lines show the energy<br />
dependence of T (upper panel) and µb (lower panel).<br />
of 30 AGeV [4], and the data are well reproduced by the<br />
model calculations. In the thermal model this maximum<br />
occurs naturally at √ sNN ≃8 GeV [5]. It is due to the<br />
counteracting effects of the steep rise and saturation of T<br />
and the strong monotonous decrease in µb. The competing<br />
effects are most prominently reflected in the energy dependence<br />
of the Λ hyperon to pion ratio (lower panel of<br />
Fig. 2), which shows a pronounced maximum at √ sNN ≃5<br />
GeV. This is reflected in the K + /π + ratio somewhat less<br />
directly; it appears mainly as a consequence of strangeness<br />
neutrality, assumed in our calculations.<br />
References<br />
[1] A. Andronic, P. Braun-Munzinger, J. Stachel, Phys. Lett.<br />
B 673 (2009) 142 [arXiv:0812.1186], Erratum: ibid.<br />
B 678 (2009) 516; Acta Phys. Pol. 40 (2009) 1005<br />
[arXiv:0901.2909].<br />
[2] A. Andronic, P. Braun-Munzinger, J. Stachel, Nucl. Phys. A<br />
772 (2006) 167.<br />
[3] M. Ga´zdzicki, M.I. Gorenstein, Acta Phys. Polon. B 30<br />
(1999) 2705.<br />
[4] C. Alt et al. (NA49), Phys. Rev.C 77 (2008) 024903.<br />
[5] P. Braun-Munzinger, J. Cleymans, H. Oeschler, K. Redlich,<br />
Nucl. Phys. A 697 (2002) 902.<br />
267
NQMA-THEORY-14 <strong>GSI</strong> SCIENTIFIC REPORT 2009<br />
Equation of State for physical quark masses ∗<br />
F. Karsch1,2,7 , M. Cheng4 , S. Ejiri1 , P. Hedge1,6 , O. Kaczmarek7 , E. Laermann7 , R. D. Mawhinney6 ,<br />
C. Miao1 , S. Mukherjee1 , P. Petreczky1,5 , C. Schmidt7 † 3<br />
, and W. Söldner<br />
1 BNL, Upton, NY 11973, USA; 2 Columbia University, New York, NY 10027, USA; 3 <strong>GSI</strong>, Darmstadt, Germany;<br />
4 LLNL, Livermore, CA 94550, USA; 5 RIKEN-BNL Research Center, BNL, Upton, NY 11973, USA; 6 Stony Brook<br />
University, Stony Brook, NY 11790, USA; 7 Universität Bielefeld, D-33615 Bielefeld, Germany<br />
8<br />
7<br />
6<br />
5<br />
4<br />
3<br />
2<br />
1<br />
0<br />
(ε-3p)/T 4<br />
0.1m s : N τ =6<br />
8<br />
0.05m s : N τ =8<br />
HRG<br />
T [MeV]<br />
140 160 180 200 220 240 260<br />
Figure 1: Trace anomaly (ɛ − 3p)/T 4 calculated for physical<br />
quark mass and compared with previous calculations<br />
at larger light quark masses ml =0.1ms as well as with<br />
HRG model which includes all resonances up to 2.5GeV.<br />
Also shown are interpolations of the lattice data.<br />
We have calculated the QCD equation of state for temperatures<br />
corresponding to the transition region with physical<br />
mass values for two degenerate light quark flavors and<br />
a strange quark using an improved staggered fermion action<br />
(p4-action) on lattices with temporal extent N τ =8,<br />
see Ref. [1]. We compare our results with previous calculations<br />
performed at twice larger values of the light quark<br />
masses as well as with results obtained from a resonance<br />
gas model calculation. We show that compared to the calculations<br />
performed at twice larger value of the light quark<br />
mass the transition region shifts by about 5MeV toward<br />
smaller temperatures, as can be seen in Fig. 1 where the<br />
shift below the transition region T = 200MeV is nicely<br />
visble. From the trace anomaly (ɛ − 3p)/T 4 the energy<br />
density ε and the pressure p are calculated, see Fig. 2.<br />
We have also calculated the renormalized Polyakov loop,<br />
subtracted chiral condensate and strangeness fluctuations in<br />
(2+1)-flavor QCD in the crossover region from low to high<br />
temperatures, see Ref. [1]. There, we also discuss the de-<br />
∗ Work supported in part by contracts DE-AC02-98CH10886 and DE-<br />
FG02-92ER40699 with the U.S. DoE, BMBF under grant 06BI401, <strong>GSI</strong><br />
under grant BILAER, EMMI under grant HA216/EMMI, and DFG under<br />
grant GRK 881. Numerical simulations have been performed on the QC-<br />
DOC computer of the RIKEN-BNL research center, the DOE funded QC-<br />
DOC at BNL, the apeNEXT at Bielefeld University and the BlueGene/L<br />
at the NY Center for Computational Sciences (NYCCS).<br />
† soeldner@gsi.de<br />
268<br />
16<br />
14<br />
12<br />
10<br />
8<br />
6<br />
4<br />
2<br />
0<br />
m q =0.1m s<br />
0.05m s<br />
0.1<br />
0.05<br />
ε/T 4<br />
3p/T 4<br />
ε SB /T 4<br />
T [MeV]<br />
140 160 180 200 220 240 260<br />
Figure 2: Energy density and three times the pressure at<br />
physical value of light quark mass and compared with previous<br />
calculations performed at ml =0.1ms. The horizontal<br />
band shows the expected uncertainty in the energy<br />
density due to the choice of the lower integration limit.<br />
confining and chiral aspects of the QCD transition in more<br />
detail.<br />
We found that thermodynamic quantities below the deconfinement<br />
transition are larger compared to the previous<br />
calculations performed at twice larger quark mass but fall<br />
below the resonance gas model result. The differences in<br />
the thermodynamic quantities calculated at ml =0.05ms<br />
and ml =0.1ms can be well understood in terms of the<br />
shift of the transition temperatures towards smaller values<br />
when the quark mass is decreased. This conclusion is<br />
also supported by the calculation of renormalized Polyakov<br />
loop, subtracted chiral condensate and strangeness fluctuations.<br />
No additional enhancement of the pressure and the<br />
energy density is seen at low temperatures. This and the<br />
deviation from the resonance gas model may be a cutoff effect<br />
due to taste violations. However, better statistical accuracy<br />
and calculations at smaller lattice spacing are needed<br />
to quantify this assertion. At temperatures above 200 MeV<br />
no quark mass dependence is seen in the equation of state.<br />
References<br />
[1] M. Cheng et al., “Equation of State for physical quark<br />
masses,” arXiv:0911.2215 [hep-lat].
<strong>GSI</strong> SCIENTIFIC REPORT 2009 NQMA-THEORY-15<br />
Lattice QCD with distributed GPUs<br />
M. Bach 1,2 , P. Bialas 5 , O. Kaczmarek 3 , F. Karsch 3 , V. Lindenstruth 1,2 , C. Schmidt 3 , and W. Söldner 4<br />
1 Frankfurt Institute for Advanced Studies, Germany; 2 Institut <strong>für</strong> Informatik, Frankfurt, Germany; 3 Universtität<br />
Bielefeld, Germany; 4 <strong>GSI</strong>, Darmstadt, Germany; 5 Jagellonian University, Krakow, Poland<br />
Lattice QCD today is one of the big computational challenges.<br />
Amongst other subjects lattice QCD allows to study<br />
the quark gluon plasma in areas where perturbative methods<br />
fail.[2] The current algorithm of choice is the rational<br />
hybrid Monte Carlo.[1]<br />
The Traditional Approach<br />
Up till now Lattice QCD calculations are often performend<br />
on specialized hardware like the apeNEXT or extremely<br />
large systems like the BlueGene. These system are<br />
special, in that the single nodes are rather slow, but communication<br />
between the nodes is extremely efficient. However<br />
production of and access to this systems is expensive.<br />
New Possibilities<br />
In recent years multi and many core architectures have<br />
evolved, continuing an increase in single node compute<br />
power even though the race for higher clock speeds has<br />
come to a halt. Today such architectures are available in<br />
GPUs, providing an excellent ratio between arithmetical<br />
power and costs. Therefore GPUs provide an interesting<br />
platform for lattice QCD calculations.[3]<br />
Figure 1: One of the development systems<br />
Utilizing new Hardware<br />
In a first step we have been able to implement a GPU<br />
based conjugate gradient solver for calculations with staggered<br />
fermions using NVIDIA CUDA. This solver is the<br />
most expensive step in Lattice QCD calculations. Our<br />
solver achieves a performance of ≈ 55 Gflops on one<br />
NVIDIA Tesla C1060 and ≈ 75 Gflops on a GTX285.<br />
A multi GPU version has been implemented which scales<br />
over multiple GPUs in a single system. This performance<br />
has only been possible by heavily optimizing the memory<br />
access patterns of the algorithm, which in its current implementation<br />
now saturates the memory bandwidth of the<br />
GPUs.<br />
Challenges<br />
With increasing arithmetical power of a single node the<br />
penalties of communication increasingly limit the overall<br />
performance of the algorithm. Therefore we are studying<br />
different methods in partitioning the problem and organizing<br />
the communication in ways to optimize overall algorithm<br />
performance. Key points to reach that goal are to<br />
minimize communication and parallelize communication<br />
and calculations as far as possible.<br />
Applications and Outlook<br />
Today the solver is used to calculate Taylor expansion<br />
coefficints of the pressure with respect to the chemical potential<br />
on a given gauge field configuration. The goal is<br />
to explore the QCD phase at nonzero baryon number density.<br />
Therefore work is ongoing in implementing a full rational<br />
hybrid monte carlo algorithm. This implementation<br />
is based on a full rational hybrid monte carlo code existing<br />
for the apeNEXT, but due to the different nature of the<br />
hardware major parts of it have to be rewritten to work efficiently.<br />
References<br />
[1] M. A. Clark and A. D. Kennedy, “The RHMC algorithm for 2<br />
flavors of dynamical staggered fermions,” Nucl. Phys. Proc.<br />
Suppl. 129 (2004) 850 [arXiv:hep-lat/0309084].<br />
[2] M. Cheng et al., “Equation of State for physical quark<br />
masses,” [arXiv:0911.2215 [hep-lat]].<br />
[3] M. A. Clark, “QCD on GPUs: cost effective supercomputing,”<br />
PoS LATTICE2009, 003 (2009) [arXiv:0912.2268<br />
[hep-lat]].<br />
269
NQMA-THEORY-16 <strong>GSI</strong> SCIENTIFIC REPORT 2009<br />
On the magnetic equation of state in (2+1)-flavor QCD ∗<br />
F. Karsch 1,2,4 , S. Ejiri 1 , E. Laermann 4 , C. Miao 1 , S. Mukherjee 1 , P. Petreczky 1,3 , C. Schmidt 4 ,<br />
W. Söldner † 2 , and W. Unger 4<br />
1 BNL, Upton, NY 11973, USA; 2 <strong>GSI</strong>, Darmstadt, Germany; 3 RIKEN-BNL Research Center, BNL, Upton, NY 11973,<br />
USA; 4 Universität Bielefeld, D-33615 Bielefeld, Germany<br />
0.25<br />
0.20<br />
0.15<br />
l<br />
0.10<br />
0.05<br />
(ml /ms )<br />
0.00<br />
0.00 0.10 0.20 0.30 0.40 0.50 0.60 0.70<br />
1/2<br />
3.28<br />
3.29<br />
3.295<br />
3.30<br />
3.305<br />
3.31<br />
3.32<br />
3.33<br />
Figure 1: The light quark chiral condensate in lattice units<br />
versus the square root of the ratio of the light and strange<br />
quark masses. The condensates have been calculated on<br />
lattice of size N 3 σ × 4 at various values of the gauge couplings<br />
β. The spatial lattice size for the two lightest quark<br />
mass values, ml/ms =1/80 and 1/40, isNσ =32, for<br />
ml/ms =1/20 it is Nσ =32for β =3.28. In all other<br />
cases (ml/ms =1/10, 1/5 and 2/5) the spatial lattice size<br />
is Nσ =16.<br />
A first study of critical behavior in the vicinity of the chiral<br />
phase transition of (2+1)-flavor QCD is presented [1].<br />
We analyze the quark mass and volume dependence of the<br />
chiral condensate and chiral susceptibilities in QCD with<br />
two degenerate light quark masses and a strange quark.<br />
The strange quark mass (ms) is chosen close to its physical<br />
value; the two degenerate light quark masses (m l) are<br />
varied in a wide range 1/80 ≤ ml/ms ≤ 2/5, where the<br />
smallest light quark mass value corresponds to a pseudoscalar<br />
Goldstone mass of about 75 MeV. All calculations<br />
are performed with staggered fermions on lattices with<br />
temporal extent Nτ =4. For an overview of the data see<br />
Fig.1.<br />
We show that numerical results are consistent with<br />
O(N) scaling in the chiral limit. We find that in the region<br />
of physical light quark mass values, m l/ms � 1/20,<br />
the temperature and quark mass dependence of the chiral<br />
∗ Work supported in part by contracts DE-AC02-98CH10886 with the<br />
U.S. DoE, BMBF under grant 06BI401, <strong>GSI</strong> under grant BILAER, EMMI<br />
under grant HA216/EMMI, and DFG under grant GRK 881. Numerical<br />
simulations have been performed on the BlueGene/L at the NY Center for<br />
Computational Sciences (NYCCS) which is supported by the U.S. DoE<br />
and by the State NY as well as the QCDOC computer of USQCD.<br />
† soeldner@gsi.de<br />
270<br />
β<br />
1.0<br />
0.1<br />
M b /h 1/δ<br />
O(2)<br />
t/h<br />
0.1 0.2 0.5 1.0 2.0 4.0<br />
1/βδ<br />
(2+1)-f, impr: 1/80<br />
1/40<br />
1/20<br />
2-f, std: 0.008<br />
0.01335<br />
0.0267<br />
Figure 2: Scaling plot for the chiral condensate calculated<br />
with an improved staggered action in (2+1)-flavor QCD<br />
(this work) and the standard staggered action in 2-flavor<br />
QCD [2, 3]. The results are shown in a log-log plot. For<br />
the (2+1)-flavor data set labels indicate the ratio m l/ms,in<br />
the 2–flavor case we give the bare quark masses ˆm. Data<br />
for the lightest quark mass are from [2], data for the other<br />
two quark mass values are from [3].<br />
condensate is already dominated by universal properties of<br />
QCD that are encoded in the scaling function for the chiral<br />
order parameter, the magnetic equation of state. This<br />
is shown in Fig.2 where we also compare to Nf =2data<br />
from earlier studies [2, 3]. Within our new study it is now<br />
possible for the first time to show strong evidince for the<br />
characteristic O(N) scaling behavior.<br />
We also provide evidence for the influence of thermal<br />
fluctuations of Goldstone modes on the chiral condensate at<br />
finite temperature. At temperatures below, but close to the<br />
chiral phase transition at vanishing quark mass, this leads<br />
to a characteristic dependence of the light quark chiral condensate<br />
on the square root of the light quark mass, as can<br />
be seen in Fig.1.<br />
References<br />
[1] S. Ejiri et al., “On the magnetic equation of state<br />
in (2+1)-flavor QCD,” Phys. Rev. D 80 (2009) 094505<br />
[arXiv:0909.5122 [hep-lat]].<br />
[2] C. W. Bernard et al., “Critical behavior in N(t) = 4 staggered<br />
fermion thermodynamics,” Phys. Rev. D 61, 054503 (2000).<br />
[3] M. D’Elia, A. Di Giacomo and C. Pica, “Two flavor QCD and<br />
confinement,” Phys. Rev. D 72, 114510 (2005).
<strong>GSI</strong> SCIENTIFIC REPORT 2009 NQMA-THEORY-17<br />
The Functional Renormalization Group and O(4) scaling ∗<br />
B. Stokić 1 , B. Friman 1 , and K. Redlich 2,3<br />
1 <strong>GSI</strong>, Darmstadt, Germany; 2 ITP, University of Wroclaw, Poland; 3 IKP, TU Darmstadt, Germany<br />
In this work [1] we use the FRG method in the quark–<br />
meson model to explore the universal properties of the chiral<br />
phase transition. We go beyond previous RG studies of<br />
this model and analyze the critical region in the broken and<br />
in the symmetric phase close to the critical point and discuss<br />
the scaling functions for different physical quantities<br />
as well as the magnetic equation of state [2]. In this report<br />
we only show a few illustrative examples.<br />
The FRG equation for the effective action reads [3]<br />
∂kΓk[Φ, ψ] = 1<br />
2 Tr<br />
�<br />
−Tr<br />
�<br />
∂kRkF<br />
∂kRkB<br />
�<br />
�<br />
Γ (2)<br />
kF<br />
Γ (2)<br />
kB [Φ, ψ] + RkB<br />
[Φ, ψ] + RkF<br />
� −1 �<br />
� −1 �<br />
, (1)<br />
where Γ (2)<br />
kB and Γ(2)<br />
kF denote the second functional derivatives<br />
of the effective action Γk[Φ, ψ] with respect to the<br />
field variables. The fields Φ and ψ in Eq. (1) denote<br />
bosonic and fermionic fields, respectively.<br />
In order to exhibit the scaling behavior of the susceptibilities<br />
for a non-vanishing explicit symmetry breaking term<br />
h �= 0, we introduce the ratios<br />
R h χπ,σ<br />
t ∂χπ,σ<br />
=<br />
χπ,σ ∂t<br />
for the transverse χπ and the longitudinal χσ susceptibilities.<br />
These ratios define the effective critical exponents [4].<br />
In the top figure we show the t and h dependence of<br />
the Rh χπ and Rh χσ in the vicinity to the critical point. In<br />
the symmetric phase, χπ and χσ coincide and their critical<br />
behavior is determined by the critical exponent γ.The<br />
transition between the two regimes takes place at z ≡<br />
th−1/βδ ≃ 1. In the broken phase, the critical exponents<br />
differ, Rh χσ ≃ β(1−δ/2) and Rh ≃ β, in complete agree-<br />
χπ<br />
ment arguments based on the Widom-Griffiths form of the<br />
magnetic equation of state.<br />
The critical exponent δ may be determined in an elegant<br />
way, by exploiting the scaling properties of the susceptibilities<br />
[5] χπ and χσ. Consider the ratio<br />
∆(t, h) = χ−1 π<br />
χ −1 =<br />
σ<br />
h ∂〈˜σ〉<br />
, (3)<br />
〈˜σ〉 ∂h<br />
which has the useful property that its value at t = 0 is<br />
independent of h within the scaling region. Indeed, one<br />
easily finds<br />
lim ∆(t, h) =<br />
h→0<br />
⎧<br />
⎨<br />
⎩<br />
1, t > 0 ,<br />
1/δ, t = 0 ,<br />
0, t < 0 .<br />
∗ Work supported in part by the Polish Ministry of Science, by DFG<br />
under the Mercator Programme. and by the Helmholtz Research School<br />
on Quark Matter Studies.<br />
(2)<br />
(4)<br />
R t<br />
χ<br />
∆(t,h)<br />
1<br />
0<br />
-1<br />
-2<br />
0.4<br />
0.3<br />
0.2<br />
0.1<br />
0<br />
-1e-05 0 1e-05<br />
t<br />
H=6×10 -12<br />
H=6×10 -13<br />
H=6×10 -14<br />
H=6×10 -15<br />
-1e-06 -5e-07 0 5e-07 1e-06<br />
t<br />
Consequently, the ratio ∆(t, h) can be used to directly<br />
extract the value of the critical exponent δ, without resorting<br />
to logarithmic fits. Moreover, this ratio simultaneously<br />
reveals the position of the critical point, since in the scaling<br />
regime, all ∆(t, h), plotted as functions of t for different h,<br />
cross at t = 0, as shown in the bottom figure.<br />
References<br />
[1] B. Stokić, B. Friman and K. Redlich, arXiv:0904.0466<br />
[2] A. Onuki, Phase transition dynamics (Cambridge University<br />
Press, Cambridge, 2002)<br />
[3] C. Wetterich, Phys. Lett. B301, 90 (1993).<br />
[4] E. K. Riedel and F. J. Wegner, Phys. Rev. B9, 924 (1974).<br />
[5] G. Boyd, J. Fingberg, F. Karsch, L. Kärkkäinen and B. Petersson,<br />
Nucl. Phys. B376, 199 (1992).<br />
σ<br />
π<br />
271
Á×�ÒØÖÓÔ�×Ò��ÖÖ�Ø��Ð�Ò�ÔÓ�ÒØ�ÒÉ��Ô��×�����Ö�Ñ<br />
�ÅÅÁ��ËÁ��ÖÑ×Ø��Ø��ÖÑ�ÒÝ�Ã�ÖÐ�Ö�ÒÞ�Ò×ÍÒ�Ú�Ö×�Ø��Ø�Ö�Þ�Ù×ØÖ����ÍÒ�ÚÓ�ÏÖÓÐ�ÛÏÖÓÐ�ÛÈÓÐ�Ò� ÁÒÖ��ÒØ�����×Ö�Ð�Ø�Ú�×Ø����ÚÝ�ÓÒÓÐÐ�×�ÓÒ�ÜÔ�Ö� �Æ���ÒÓ �ÂË�����Ö�ËØÓ�� ��Ö�Ñ�Ò�Ò�ÃÊ��Ð���<br />
��Ø�Ò�Ô��×�×ØÖÙØÙÖ�××Ø�Ø��Ò��ÝÒ�Ñ��ÐÔÖÓÔ�ÖØ��×Ó� Ñ�ÒØ×��Ú����Ò�ØØÖ�Ø��ÑÙ��ÒØ�Ö�×ØÌ��Ý��Ñ�Ø�� ��Ú����Ò�ÓÒ�ØÓÙÒ��Ö×Ø�Ò�Ô�Ý×�×����Ò���Ø��ÙÑÙ Ø�Ø�Ò�ÕÙ�Ö��ÐÙÓÒÔÐ�×Ñ�É�ÈÔ��×��Ò��Ø�ÒÚ�×Ø� É���ÐÓÒ�Û�Ø�Ø���ÜÔ�Ö�Ñ�ÒØ�Ð×ÓØ��ÓÖ�Ø��Ð×ØÙ���× ØÓØ��Ô�ÖØ�Ø�ÓÒ�ÙÒØ�ÓÒ�Ò���Ö�Ú��ÐÓÛ�Ò�Ö�Ý����Ø�Ú�<br />
Ð�Ø��ÇÙÖÔÖ�×�ÒØÛÓÖ��×ÓÒ�ÖÒ�Ò��ÓÙÒ��Ö��×Ó�Ø�� Ð�ØØ�Ö�×�Ø�ÖÑ�Ò�ÐÔÓ�ÒØÓ�Ø��¢Ö×ØÓÖ��Ö��Ö�ÐÔ��×�ØÖ�Ò Ô��×�����Ö�ÑÌ��ØÖ�Ò×�Ø�ÓÒ��Ò��×ØÓÖÓ××ÓÚ�ÖÓÒØ�� ×�Ø�ÓÒ�ÖÓÑÐÓÛØ�ÑÔ�Ö�ØÙÖ��Ò�������Ò×�ØÝ×����ÒÌ� ÓØ��Ö×���ØÓØ����ÈÌ����È�×Ø��ÓÖ�Ø��ÐÐÝ�ÜÔ�Ø�� ��Ö�ÐÔ��×�ØÖ�Ò×�Ø�ÓÒ�Ò��Ø×Ö�Ø��Ð�Ò�ÔÓ�ÒØ��ÈÌ����ÝÓÒ�Ø��Ñ��Ò¢�Ð��ÔÔÖÓÜ�Ñ�Ø�ÓÒÏ���Ú��ÔÔÐ���<br />
Ú���×���Ò�Ö�ÐÒÓÒÔ�ÖØÙÖ��Ø�Ú��Ö�Ñ�ÛÓÖ��Ò�Ø��Ö�×ÙÐØ ÔÓØ�ÒØ��Ð�Ý×ÓÐÚ�Ò�×Ó�ÐÐ��£ÓÛ�ÕÙ�Ø�ÓÒÌ���Ê�ÔÖÓ Ø���Ê�ØÓ�Ò����Ø�Ú�ÑÓ��ÐÓ�É��Ø��ÕÙ�Ö�Ñ�×ÓÒ �Ò�����Ø�Ú�ÔÓØ�ÒØ��Ð�ÒÐÙ��×�ÐÐ����Ø×Ó�£ÙØÙ�Ø�ÓÒ× ÑÓ��ÐÛ�����ÐÓÒ�×ØÓØ��×�Ñ�ÙÒ�Ú�Ö×�Ð�ØÝÐ�××Ó�Ø�� ��ÈÀ�Ò�Ø��×ÑÓ��Ð�×�Ô��Ð�Ó���×Ö���Ò�Ö�Ø��Ð��<br />
�ÖÓÑÑ�ÒÝÚ�Ö��ÒØ×Ó�É������Ø�Ú�Ø��ÓÖ��×�Ò��Ð×ÓÖ� ��Ú�ÓÖ×Ù��×�×�ÒØÖÓÔ�×Ò��ÖØ����ÈÓÖÖ�ØÐÝÛ�Ø�Ø��<br />
ØÖÓÔÝËÓÚ�Ö��ÖÝÓÒÒÙÑ��ÖÆÖ�Ø�Ó�ÒÉ��Ô��×���� �Ö�ÑÛ�Ø�×Ô���Ð�ÑÔ��×�×ÓÒØ�Ó×��ÖÓÙÒ�Ø����ÈÁÒ �ÒØÐÝ�ÖÓÑÄ�ØØ��É�� �Ê�À�Ö�Û�ÓÒÐÝ×�ÓÛÓÙÖÖ�×ÙÐØÓ��×�ÒØÖÓÔ�×�ÒØ��¢�<br />
Ø��ÒÙÐ��ÖÒÙÐ��ÖÓÐÐ�×�ÓÒ�ÜÔ�Ö�Ñ�ÒØ×Ø��Ò�Ø��ÖÝÓÒ ÒÙÑ��ÖÔ�ÖØ��Ô�Ø�Ò��×¢Ü���ÒØ��Û�ÓÐ�ÔÖÓ�××Û��Ð� Ï���Ú�×ØÙ�����×�ÒØÖÓÔ�×ÓÒØÓÙÖ×Ó�ÓÒ×Ø�ÒØ�Ò ¢�ÙÖ��×�ÒØÖÓÔ�ÓÒØÓÙÖ×ÐÓÓ�Ú�ÖÝ×ÑÓÓØ��Ò��ÓÒÓØ�Ò �ÒØÑ�Ø�Ó�×ØÓ×ÓÐÚ�Ø��£ÓÛ�ÕÙ�Ø�ÓÒ�××��Ò�ÖÓÑØ�� ÙÖ��℄�Ø��×ÓÐ��ÔÓ�ÒØ�Ò���Ø�×Ø��ÐÓ�Ø�ÓÒÓ�Ø����È Ú�ÐÙ�×�ÓÖË�Æ��×����Ò�×ÓÐ��Ð�Ò�×�Ö��ÖÓÑ�����Ö<br />
Ø��ØÓØ�Ð�ÒØÖÓÔÝØÓ��ÔÖÓ�Ù����Ô�Ò�×ÓÒØ��ÓÐÐ�×�ÓÒ�ÒÝÛ�ÝÖ�£�ØØ��ÔÖÓÜ�Ñ�ØÝÓ�Ø����ÈÌ��ÓÒ��ØÙÖ��<br />
�Ò�Ø��ÓÒØÓÙÖ××�ÓÛ�×�ÒØÖÓÔ�×Û�Ø������Ö�ÒØÒÙÑ�Ö��Ð<br />
Ó�Ø��×Ý×Ø�Ñ�¢Ö���ÐÐ�ÜÔ�Ò��Ò��Ò�ÓÓÐ�Ò��ÖÓÑÉ�È ØÓ���ÖÓÒ�Ô��×��Ò��Û�ÐÐ��×Ö�����Ý����Ð�Ý�ÖÓ �Ò�Ö�ÝÌ��ÑÓ×ØÓ�Ø���ÒØÖÓÔÝÔÖÓ�ÙØ�ÓÒÛÓÙÐ���ÓÑ �ÓÙ×�Ò�����ØØÓÛ�Ö�Ø����È�×ÒÓØÓ�×�ÖÚ��<br />
ÔÐ�Ø���ÒØ����ÖÐÝ×Ø���Ó�ÓÐÐ�×�ÓÒ�Ò�Ð�Ø�Ø�Ñ��ÚÓÐÙØ�ÓÒ<br />
����Ö�ÑØ��Ö��ÓÖ�����×�ÒØÖÓÔ�ÓÒØÓÙÖÛ�Ø��×Ô��¢ �ÝÒ�Ñ�×�ÑÔÐÝ�Ò�Ú�Ò�×��Ò�Ú�×Ó×�Ø��×Ø�Ù×ÒÓ�ÙÖØ��Ö �ÒØÖÓÔÝÔÖÓ�ÙØ�ÓÒÁÒØ��Ì�ÔÐ�Ò�Ó�Ø��É��Ô��×� ÐÙØ�ÓÒÓ�����Ú�ÒØ�ÒÖ�Ð�Ø�Ú�×Ø����ÚÝ�ÓÒÓÐÐ�×�ÓÒ�Ü Ô�Ö�Ñ�ÒØË�Ò�Ø���Ý�ÖÓ�ÝÒ�Ñ��ÚÓÐÙØ�ÓÒ��×Ö���×Ø�� ×Ý×Ø�Ñ�ÖÓ××Ø��Ô��×��ÓÙÒ��Ö��×Ø���×�ÒØÖÓÔ�����Ú �ÓÖÔÖÓÚ���××ÓÑ�ÐÙ�×ØÓ¢Ò��Ò��ÜÔ�Ö�Ñ�ÒØ�Ð×��Ò�ØÙÖ� ÓÒ×Ø�ÒØÚ�ÐÙ�Ó�Ë�ÆÓÖÖ�×ÔÓÒ�×ØÓ��Ý�ÖÓ�ÝÒ�Ñ��ÚÓ<br />
Ó�Ô��×��ÓÙÒ��ÖÝ�Ò�Ø����È É��Ô��×�����Ö�Ñ������ÒÖ�ÔÓÖØ���ÒØ��Ð�Ø�Ö�ØÙÖ��℄� Ø��Ö�Ø��УÙØÙ�Ø�ÓÒ�ÑÔÐ��×��ÓÙ×�Ò�Ó�Ø���×�ÒØÖÓÔ�× �Ö��ÓÒØ��ÖÓ××ÓÚ�Ö×����ÓÙ×ÓÒØ����ÈØ���ÓÙ×�Ò� ØÓÛ�Ö�Ø����ÈÁØÑ��Ò×Ø��Ø��ÙÒ�Ó�ÓÒØÓÙÖ×�Ò�Û��� Ê��ÒØÐÝ�Ò�ÒØ�Ö�×Ø�Ò����ØÙÖ�Ó�Ø���×�ÒØÖÓÔ�×�ÒØ��Ø����ÈØ��Ø��ÖÑÓ�ÝÒ�Ñ�ÔÓØ�ÒØ��Ð��Ò����ÓÑ<br />
ÔÓ×���ÒØÓØÛÓÔ�ÖØ×ÑÓ��Ð��Ô�Ò��ÒØÖ��ÙÐ�ÖÔ�ÖØ�Ö�Ò� ÙÒ�Ú�Ö×�Ð×�Ð�Ò�Ô�ÖØ�×�×�×Ö�×ÔÓÒ×��Ð��ÓÖ×�Ò�ÙÐ�Ö ÇÙÖÖ�×ÙÐØ�Ò��ÙÒ��Ö×ØÓÓ��ÒØ���ÓÐÐÓÛ�Ò�Û�Ý�Ò��Ö<br />
����ØÌ��×�×ÓÒ��ØÙÖ���Ò�ÑÓ��Ð×Ý×Ø�ÑÓÑÔÓ×��Ó�<br />
����ØÇÒ�Ó�ÓÙÖÑÓØ�Ú�Ø�ÓÒ�×ØÓ�Ü�Ñ�Ò���×Ù�����Ø ����ÑÓ��ÐÓÒØ�����ÖÓÒ�×����Ò��ÕÙ�Ö��ÐÙÓÒ��×ÓÒ<br />
Ö��ÐÐÝ�Ò���ÜÔ�Ø���Ò�ÑÓÖ�Ö��ÓÖÓÙ×Û�Ý ×�Ð�Ò��ÙÒØ�ÓÒ�ÓÖØ����ÈËÓÑ��ÑÔÐ��Ø�ÓÒ×�ÓÖØ���Ü Ô�Ö�Ñ�ÒØ��Ú����ÒÖ�ÔÓÖØ��ÓÒØ����×�×Ó�Ø���ÓÙ×�Ò� Ø��É�È×���Û����Ö��ÒØ�ÖÔÓÐ�Ø���ÝØ���Á×�Ò�ÑÓ��Ð�ÖÓÑ�×��ÓÑ�×Ù��ÓÑ�Ò�ÒØÓÑÔ�Ö��ØÓØ�Ó×��ÖÓÑ�Ö<br />
Ø��Ý�ÓÒÓØÔÓ××�××�ÒÝ×�Ò�ÙÐ�Ö�Ø��×�ÓÒØÖ��ÙØ�ÓÒ×ØÓË�Æ ÓÖ��ÖË�Ò�ÆÓ�ÓÙÖ�ÒØ�Ö�×Ø�Ö�×Ø��Ö�Ú�Ø�Ú�×Ø��Ö��ÓÖ� ×Ô��¢���ØÓ�Ø��Ò���Ý�����Ö��Ö�Ú�Ø�Ú�×Ó��Ø��ÒÒ� �Ø��×Ó�Ø��ÖÑÓ�ÝÒ�Ñ�ÔÖÓÔ�ÖØ��×��Ø����Ú�Ö��Ò�Ó�<br />
�×Ø����È�×�ÔÔÖÓ����Ì�Ù×Û�ÓÒÐÙ��Ø��Ø�ÒÝÔ�Ù Ð��Ö����Ú�ÓÖÓ�Ø���×�ÒØÖÓÔ�××Ù��×Ø���ÓÙ×�Ò�����Ø<br />
Ø�Ñ�Ø��ÐÐÝ�ÒØ��Ö�Ø�ÓÙØ�����ÖÑÓÑ�ÒØÙÑÓÒØÖ��ÙØ�ÓÒ× �ÖÓÙÔ�Ê��ÔÔÖÓ��ØÓ�Ú�ÐÙ�Ø�Ø��Ø��ÖÑÓ�ÝÒ�Ñ�ÔÓ Ø�ÒØ��Ð�ÖÓÑÛ����ÒØÖÓÔÝ�Ò���ÖÝÓÒÒÙÑ��ÖÖ�Ø�ÓË�Æ �Ò����Ö�Ú��Ì�����ÙØÝÓ�Ø���Ê��×Ø��ØÓÒ��Ò×Ý× ÌÓØ��×�Ò�Û��ÑÔÐÓÝØ���ÙÒØ�ÓÒ�ÐÖ�ÒÓÖÑ�Ð�Þ�Ø�ÓÒ�×Ú�ÖÝÙÒÐ���ÐÝ<br />
�℄�ÆÓÒ����Ò�Å�×���Û�È�Ý×Ê�Ú�� �℄�Æ���ÒÓ�ÂË�����Ö�ËØÓ����Ö�Ñ�Ò�Ò�à Å�ÐÙ�Ñ�Ò��Ã��ÑÔ��ÖÈÓË�ÈÇ�� Ê���Ö�Ò�×<br />
Ê��Ð��È�Ý×Ä�ØØ��� � �� ������<br />
NQMA-THEORY-18 <strong>GSI</strong> SCIENTIFIC REPORT 2009<br />
272<br />
T�MeV�<br />
250<br />
200<br />
150<br />
100<br />
50<br />
13.9<br />
6.6<br />
4.3<br />
3.2<br />
2.5<br />
��<br />
2.0<br />
: CEP �Taylor�<br />
0<br />
0 50 100 150 200 250 300 350<br />
Μ�MeV�<br />
1.2
<strong>GSI</strong> SCIENTIFIC REPORT 2009 NQMA-THEORY-19<br />
Microscopic description of the phase transition from hadronic to partonic<br />
matter and dynamics of hadronization ∗<br />
The nature of confinement and the dynamics of the phase<br />
transition from hadronic to partonic mattre is an outstanding<br />
question of todays physics. The dynamics of partons,<br />
hadrons and strings in relativistic nucleus-nucleus collisions<br />
is analyzed within the novel Parton-Hadron-String<br />
Dynamics (PHSD) transport approach, which is based<br />
on a dynamical quasiparticle model for partons (DQPM)<br />
matched to reproduce recent lattice-QCD results - including<br />
the partonic equation of state - in thermodynamic equilibrium.<br />
Scalar- and vector-interaction densities are extracted<br />
from the DQPM as well as effective scalar- and<br />
vector-mean fields for the partons. The transition from partonic<br />
to hadronic degrees of freedom is described by covariant<br />
transition rates for the fusion of quark-antiquark<br />
pairs or three quarks (antiquarks), respectively, obeying flavor<br />
current-conservation, color neutrality as well as energymomentum<br />
conservation. Since the dynamical quarks and<br />
antiquarks become very massive close to the phase transition,<br />
the formed resonant ’pre-hadronic’ color-dipole states<br />
(q¯q or qqq) are of high invariant mass, too, and sequentially<br />
decay to the groundstate meson and baryon octets increasing<br />
the total entropy.<br />
The PHSD approach is applied to nucleus-nucleus collisions<br />
from 20 to 160 A·GeV in order to explore the spacetime<br />
regions of ’partonic matter’. We find that even central<br />
collisions at the top-SPS energy of 158 A· GeV show<br />
a large fraction of non-partonic, i.e. hadronic or stringlike<br />
matter, which can be viewed as a hadronic corona (cf.<br />
Fig. 1). Studying in detail Pb+Pb reactions from 40 to 158<br />
A·GeV - we observe that the partonic phase has a very low<br />
impact on rapidity distributions of hadrons but a sizeable<br />
influence on the transverse mass distribution of final kaons<br />
due to the repulsive partonic mean fields. Furthermore, we<br />
find a significant effect on the production of multi-strange<br />
antibaryons (Fig. 2) due to a slightly enhanced s¯s pair<br />
production in the partonic phase from massive time-like<br />
gluon decay and a larger formation of antibaryons in the<br />
hadronization process.<br />
References<br />
[1] W. Cassing and E.L. Bratkovskaya, Nucl. Phys. A831 (2009)<br />
215.<br />
[2] W. Cassing and E.L. Bratkovskaya, Phys. Rev. C 78 (2008)<br />
034919.<br />
[3] W. Cassing, E.L. Bratkovskaya, Y.-.Z. Xing, Prog. Part. Nucl.<br />
Phys. 62 (2009) 359-364.<br />
∗ Work supported by the Helmholtz International Center for FAIR<br />
within the the LOEWE program launched by the State of Hesse.<br />
E. L. Bratkovskaya 1 , W. Cassing 2 , and O. Linnyk 1<br />
1 Univ. of Frankfurt, Germany; 2 Univ. of Giessen, Germany<br />
Number<br />
partonic energy fraction<br />
2000<br />
1500<br />
1000<br />
500<br />
0.4<br />
0.3<br />
0.2<br />
0.1<br />
Pb+Pb, 158 A GeV, b=1 fm<br />
partons<br />
mesons<br />
new B+Bbar<br />
0<br />
0 3 5 8 10 13 15 18 20<br />
t [fm/c]<br />
Pb+Pb, b=1 fm<br />
T kin [A GeV]<br />
20<br />
40<br />
80<br />
160<br />
0.0<br />
0 3 5 8 10 13 15 18 20<br />
t [fm/c]<br />
Figure 1: Top: The number of produced partons, mesons<br />
and newly produced baryon + antibaryons as a function of<br />
time for Pb+Pb at 158 A·GeV (for b=1fm). Bottom: The<br />
partonic energy fraction as a function of time for impact<br />
parameter b = 1 fm for Pb+Pb at 160, 80, 40 and 20 A·GeV.<br />
dN/dy | y=0 / N wound<br />
dN/dy | y=0 / N wound<br />
0.06<br />
0.05<br />
0.04<br />
0.03<br />
0.02<br />
0.01<br />
Λ+Σ 0<br />
NA57<br />
NA49<br />
Pb+Pb, 158 A 0.010 GeV, mid-rapidity<br />
HSD<br />
PHSD<br />
0.008<br />
0.006<br />
0.004<br />
0.002<br />
_ _<br />
Λ+Σ Λ+Σ<br />
0<br />
0.00<br />
0 100 200 300<br />
0.000<br />
400 0 100 200 300 400<br />
Nwound Nwound 10 -2<br />
10 -3<br />
Ξ −<br />
NA57<br />
NA49<br />
Pb+Pb, 158 A GeV, mid-rapidity<br />
HSD<br />
PHSD<br />
10<br />
0 100 200 300 400<br />
-4<br />
Nwound 10 -3<br />
10 -4<br />
__ __<br />
__<br />
Ξ +<br />
0 100 200<br />
Nwound 300 400<br />
Figure 2: Top: The multiplicities of (Λ + Σ 0 )/Nwound<br />
(l.h.s.) and ( ¯ Λ + ¯ Σ 0 )/Nwound (r.h.s.) as a function of<br />
the number of wounded nucleons for Pb+Pb collisions at<br />
158 A·GeV at mid-rapidity from PHSD and HSD in comparison<br />
to the experimental data from the NA57 and NA49<br />
Collaborations. Bottom: The multiplicities of Ξ − /Nwound<br />
(l.h.s.) and ¯ Ξ + /Nwound (r.h.s.) vs Nwound for Pb+Pb collisions<br />
at 158 A·GeV at mid-rapidity.<br />
273
NQMA-THEORY-20 <strong>GSI</strong> SCIENTIFIC REPORT 2009<br />
Polyakov–Nambu–Jona-Lasinio Models and QCD Phase Diagram ∗<br />
T. Hell, M. Cristoforetti, B. Klein, and W. Weise<br />
Physik-Department, TU München, D-85747 Garching, Germany<br />
Strongly interacting matter under extreme conditions<br />
is a topic of continuing interest, both from the point of<br />
view of ultrarelativistic heavy-ion collisions and lattice<br />
QCD. In our work we use approaches based on the timehonored<br />
Nambu–Jona-Lasinio model in order to investigate<br />
the nature of the different phases of QCD matter<br />
at finite temperatures and densities. From hadron spectroscopy<br />
it is well-known that the chiral symmetry of the<br />
QCD Lagrangian is spontaneously broken, manifested in<br />
mass gaps between, e. g., the vector and pseudovector<br />
mesons. When dealing with two light up- and down quarks<br />
(mu ≈ md ∼ O(10 MeV) plus one heavy strange quark<br />
(ms ∼ O(100 MeV) one has to additionally include the<br />
anomalous breaking of the axial U(1) symmetry. This last<br />
point is particularly important in order to describe the mass<br />
splitting between the eta- and the eta-prime meson. The<br />
NJL model and a nonlocal version of it, both used in our<br />
work, can account for this symmetry breaking pattern.<br />
The thermodynamical description of NJL type models<br />
does not inlcude the important feature of confinement.<br />
This can be introduced by implementing the Polyakov loop<br />
〈Φ〉 as the proper order parameter for the confinementdeconfinement<br />
transition. The resulting models are of the<br />
Polyakov-loop extendend NJL (PNJL) type [1, 2, 3]. Finite<br />
temperature and finite density phenomena are described by<br />
standard means of thermal field theory.<br />
The nonlocal approach leads the phase diagram shown<br />
in Fig. 1. It shows the low-density behavior expected from<br />
lattice QCD calculations: namely a crossover region that<br />
terminates at a critical point located at TCEP ≈ 170 MeV<br />
and µCEP ≈ 180 MeV which marks the endpoint of the<br />
following first order transition line. From our investigations<br />
of the phase diagram we conclude that the location<br />
of the critical point is sensitive to the strength of the axial-<br />
U(1) breaking.<br />
A better understanding of the mechanism at the origin of<br />
these transitions requires the investigation of fluctuations<br />
beyond mean field in the PNJL model. By performing numerical<br />
simulations of the thermodynamics using standard<br />
Monte-Carlo techniques we can perform this improvement<br />
[4]. The relevance of fluctuations on the thermodynamics is<br />
particularly evident looking at the flavor non-diagonal second<br />
derivative of the thermodynamic grand canonical partition<br />
function with respect to quark chemical potentials.<br />
The PNJL mean field calculation predicts a vanishing coefficient,<br />
whereas fluctuations (primarily of pionic origin) are<br />
at the origin of a non-zero value of this flavor off-diagonal<br />
susceptibility, χud. In Fig. 2 the good agreement between<br />
∗ Work supported in part by <strong>GSI</strong>, BMBF, and by the DFG Excellence<br />
Cluster “Origin and Structure of the Universe”.<br />
274<br />
lattice data and the Monte-Carlo calculation (MC-PNJL)<br />
clearly shows the role of such fluctuations in the model.<br />
T�GeV�<br />
0.20<br />
0.15<br />
0.10<br />
0.05<br />
0.00<br />
1 st order chiral<br />
chiral crossover<br />
Polyakov loop<br />
0.05 0.10 0.15 0.20 0.25 0.30<br />
Μu�GeV�<br />
Figure 1: Phase diagram for Nf = 3 flavors calculated using<br />
the nonlocal PNJL model [1, 2]. The solid line shows<br />
the first-order chiral transition (the star denotes the critical<br />
end point). The dotted line marks the (chiral) crossover<br />
transition while the dashed lines correspond to the deconfinement<br />
transition region.<br />
� ��<br />
�<br />
�����<br />
�����<br />
�����<br />
�����<br />
����<br />
�������<br />
������������<br />
��������<br />
������������<br />
��������<br />
������������<br />
��� � ��� �<br />
����<br />
Figure 2: Temperature dependence of the second order<br />
flavor off-diagonal susceptibility in the Monte-Carlo approach<br />
to the PNJL model [4] in comparison with twoflavor<br />
lattice data.<br />
References<br />
[1] T. Hell, S. Rößner, M. Cristoforetti and W. Weise,<br />
arXiv:0911.3510 [hep-ph] (2009).<br />
[2] T. Hell, S. Rößner, M. Cristoforetti and W. Weise, Phys. Rev.<br />
D79, 014022 (2009).<br />
[3] S. Rößner, T. Hell, C. Ratti and W. Weise, Nucl. Phys. A814,<br />
118 (2008).<br />
[4] M. Cristoforetti, T. Hell, B. Klein and W. Weise, in preparation.
<strong>GSI</strong> SCIENTIFIC REPORT 2009 NQMA-THEORY-21<br />
Nuclear energy density functional from chiral pion-nucleon dynamics<br />
N. Kaiser and W. Weise<br />
Physik-Department, TU München, D-85747 Garching, Germany<br />
The nuclear energy density functional is the many-body<br />
method of choice in order to calculate the properties of<br />
medium-mass and heavy nuclei in a systematic manner. Parameterized<br />
(non-relativistic) Skyrme functionals as well<br />
as relativistic mean-field models have been used widely<br />
and successfully for such nuclear structure calculations.<br />
A complementary approach based on chiral effective field<br />
theory attempts to constrain the form of the nuclear energy<br />
density functional by many-body perturbation theory and<br />
the underlying two- and three-nucleon interactions. In particular,<br />
the long- and medium-range 1π- and 2π-exchange<br />
dynamics should be included and its role for nuclear manybody<br />
systems should to be explored systematically.<br />
A tool for constructing an explicit (and numerically<br />
tractable) nuclear energy density functional is the density<br />
matrix-expansion. It removes the non-local character of<br />
Fock contributions by mapping them onto a generalized<br />
Skyrme functional with density dependent couplings. Recently,<br />
Gebremariam, Duguet and Bogner [1] have developed<br />
via phase-space averaging techniques an improved<br />
density-matrix expansion for spin-unsaturated nuclei:<br />
�<br />
Ψα(�r − �a/2)Ψ<br />
α<br />
† α(�r + �a/2) = 3ρ<br />
j1(akf )<br />
akf<br />
− a<br />
�<br />
j1(akf ) τ −<br />
2kf<br />
3<br />
5 ρk2 1<br />
f −<br />
4 � ∇ 2 �<br />
ρ<br />
+ 3i<br />
2akf<br />
j1(akf ) �σ · (�a × � J ) , (1)<br />
with j1(akf ) a spherical Bessel function. Here, ρ(�r ) =<br />
2k 3 f (�r )/3π2 denotes the nuclear density and � J(�r ) is the socalled<br />
spin-orbit density. The Fourier transform of eq.(1)<br />
to momentum space defines a ”medium insertion” which<br />
allows to calculate the nuclear energy density functional:<br />
E[ρ, τ, � �<br />
J ] = ρ Ē(ρ) + τ − 3<br />
5 ρk2 ��<br />
1<br />
f<br />
2M + Fτ<br />
�<br />
(ρ)<br />
+( � ∇ρ) 2 F∇(ρ) + � ∇ρ · � J Fso(ρ) + � J 2 FJ(ρ) , (2)<br />
in a diagrammatic way. Our calculation [2] treats all effects<br />
from 1π-exchange, iterated 1π-exchange, and irreducible<br />
2π-exchange with intermediate ∆-isobar excitations, including<br />
Pauli-<strong>block</strong>ing corrections up to three-loop order.<br />
Fig. 1 shows the strength F∇(ρ) of the surface-term<br />
( � ∇ρ) 2 . The dashed line corresponds to the truncation<br />
to 1π- and iterated 1π-exchange, whereas the full line<br />
includes in addition the 2π-exchange and the associated<br />
three-body contributions. Taking the band spanned by<br />
phenomenological Skyrme forces as a benchmark one can<br />
conclude that chiral pion-nucleon dynamics reproduces<br />
well the strength of the surface-term in the density region<br />
ρ0/2 < ρ < ρ0 = 0.16 fm −3 mainly relevant for nuclei.<br />
F grad (ρ) [MeVfm 5 ]<br />
140<br />
120<br />
100<br />
80<br />
60<br />
40<br />
20<br />
Skyrme forces<br />
(density-gradient) 2 term<br />
0.02 0.04 0.06 0.08 0.1 0.12 0.14 0.16 0.18 0.2<br />
ρ [fm -3 0<br />
]<br />
Figure 1: Strength F∇(ρ) of the surface-term ( � ∇ρ) 2 .<br />
The strength Fso(ρ) of the spin-orbit coupling term<br />
�∇ρ · � J (see Fig.2) receives contributions from iterated 1πexchange<br />
(of the “wrong sign”) and from three-nucleon<br />
interactions mediated by 2π-exchange with virtual ∆excitation<br />
(of the “correct sign”). In the region around<br />
ρ0/2 ≃ 0.08 fm −3 where the spin-orbit interaction in nuclei<br />
gains most of its weight these two components tend<br />
to cancel, thus leaving room for the short-range nuclear<br />
spin-orbit interaction. The latter is represented either by<br />
contact-terms or by Lorentz scalar and vector mean-fields.<br />
F so (ρ) [MeVfm 5 ]<br />
40<br />
20<br />
0<br />
-20<br />
-40<br />
spin-orbit coupling<br />
0.02 0.04 0.06 0.08 0.1 0.12 0.14 0.16 0.18 0.2<br />
ρ [fm -3 -60<br />
]<br />
Figure 2: Strength Fso(ρ) of the spin-orbit term � ∇ρ · � J.<br />
Dashed curve: iterated 1π-exchange. Full curve: including<br />
three-body contributions mediated by 2π-exchange.<br />
References<br />
[1] B. Gebremariam, T. Duguet, S. Bogner, nucl-th/0910.4979.<br />
[2] N. Kaiser and W. Weise, nucl-th/0912.3207; Nucl. Phys. A<br />
(2010) in print; and references therein.<br />
275
NQMA-THEORY-22 <strong>GSI</strong> SCIENTIFIC REPORT 2009<br />
Structure of the rho meson and the pion form-factor<br />
S. Leupold 1<br />
1 Institut <strong>für</strong> Theoretische Physik, Universität Giessen, Germany<br />
From the electromagnetic form factor of the pion and<br />
from the decay modes of the τ lepton involving two or<br />
three pions one can see that the isovector–vector quark current<br />
couples strongly to the ρ meson whereas the isovector–<br />
axial-vector current couples strongly to the a1. Therefore<br />
such reactions provide excellent access to studies of the<br />
properties of (axial-)vector mesons. It has been shown recently<br />
[1] that the τ decay data, where the a1 meson shows<br />
up as a bump in the three-pion spectral information, can<br />
be well understood by the assumption that initially a ρπ<br />
pair is produced which dynamically generates a resonant<br />
state in its rescattering process. In the following it<br />
is demonstrated with the same method that the ρ cannot be<br />
understood as a dynamically generated state of π-π scattering.<br />
In other words, while the a1 meson seems to have<br />
a hadronic substructure, the ρ meson appears to be dominantly<br />
a quark-antiquark state. For further details and references<br />
see [2].<br />
FF<br />
50<br />
45<br />
40<br />
35<br />
30<br />
25<br />
20<br />
15<br />
10<br />
5<br />
0<br />
0.3 0.4 0.5 0.6 0.7 0.8 0.9 1<br />
m [GeV]<br />
data<br />
no ρ<br />
Figure 1: Pion form-factor without an elementary vector<br />
meson.<br />
The (time-like) form factor of the pion can be deduced<br />
from the reaction e + e − → π + π − . This reaction is described<br />
within a Bethe-Salpeter approach which allows for<br />
the rescattering of the pions. For the construction of the<br />
scattering kernels the very same logic as in [1] is applied:<br />
If there is an elementary resonance in the kinematical region<br />
of interest the corresponding s-channel diagram is included<br />
in the kernel. All other interactions are smooth<br />
functions of the center-of-mass energy m = √ s. These<br />
non-resonant interactions are approximated by the respective<br />
lowest-order terms of chiral perturbation theory. It is<br />
an important aspect that these interactions are fixed modelindependently.<br />
Two scenarios are studied: One without and<br />
one with an elementary vector meson. In both cases the<br />
pion-pion and pion-photon interactions from lowest-order<br />
chiral perturbation theory are taken into account. As a con-<br />
276<br />
sequence, in the first scenario the production of pions happens<br />
only directly from the virtual photon which couples to<br />
the pion charge. In this scenario the pions rescatter by the<br />
point-like interaction of the non-linear sigma model. There<br />
are essentially no free parameters in this case once the<br />
renormalization of the appearing loops is settled. The result<br />
is shown in figure 1. Obviously this scenario is not compatible<br />
with the data; the final-state interaction between the<br />
pions is not sufficient to provide enough binding for the<br />
appearance of a dynamically generated resonance. This is<br />
different from the axial-vector channel where the lowestorder<br />
chiral interaction is strong enough to generate the a1.<br />
For the second scenario, where an elementary resonance is<br />
included, there are additional processes where the photon<br />
can transform into the elementary ρ meson which only then<br />
couples to the pions and/or where the pions rescatter via the<br />
formation of a ρ meson. In this scenario there are naturally<br />
free (resonance) parameters: the mass of the vector meson<br />
and its couplings to the photon and to two pions. These<br />
ingredients are sufficient to explain the data for the form<br />
factor of the pion as can be seen from figure 2.<br />
FF<br />
50<br />
45<br />
40<br />
35<br />
30<br />
25<br />
20<br />
15<br />
10<br />
5<br />
0<br />
0.3 0.4 0.5 0.6 0.7 0.8 0.9 1<br />
m [GeV]<br />
data<br />
with ρ<br />
Figure 2: Pion form-factor including in the kernels an elementary<br />
vector-meson resonance.<br />
The presented work is of high relevance for the physics<br />
at FAIR: Tools to distinguish between dynamically generated<br />
and preformed states are of utmost importance to identify<br />
and analyze exotic states at ¯PANDA. In addition, the<br />
understanding of vector-meson properties is a key ingredient<br />
to explore the in-medium changes of hadrons which<br />
could be observed with HADES and CBM.<br />
References<br />
[1] M. Wagner and S. Leupold, Phys. Rev. D 78 (2008) 053001,<br />
Phys. Lett. B 670 (2008) 22.<br />
[2] S. Leupold, Phys. Rev. D 80 (2009) 114012 .
<strong>GSI</strong> SCIENTIFIC REPORT 2009 NQMA-THEORY-23<br />
A New Approach to the Gluon Structure Function<br />
D. Grünewald∗1 , E.-M. Ilgenfritz † 2 ‡ 3<br />
, and H.J. Pirner<br />
1 Institut <strong>für</strong> Theoretische Physik, Heidelberg, Germany; 2 Institut <strong>für</strong> Physik, Berlin, Germany, and Institut <strong>für</strong><br />
Theoretische Physik, Heidelberg, Germany; 3 Institut <strong>für</strong> Theoretische Physik, Heidelberg, Germany, and<br />
Max-Planck-Institut <strong>für</strong> Kernphysik, Heidelberg, Germany<br />
In Euclidean lattice simulations, using the operator product<br />
expansion the lowest moments of the meson and nucleon<br />
structure functions have been evaluated. On the other<br />
side, Loop-loop correlation functions of tilted Wegner-<br />
Wilson loops can be related to the gluon distribution function<br />
of a color dipole which consists of a static quark<br />
and antiquark pair connected by a Schwinger string. In<br />
the work presented here we have used an alternative approach<br />
based on light cone dynamics with constituents<br />
moving along the light cone, as suggested by the picture<br />
of Feynman scaling. In the light cone approach the<br />
non-perturbative QCD vacuum structure is hard to achieve<br />
within the Fock representation of free fields acting on a trivial<br />
vacuum. Therefore, in recent papers [1, 2] we have<br />
developed a near-light-cone (nlc) approach in which we<br />
exploit the lattice formulation, benefitting from simplifications<br />
emerging in the light cone limit. In Ref. [2] we<br />
have used the variationally optimized ground state wave<br />
functional of Ref. [1] to determine the gluon distribution<br />
function of a color dipole. The present report gives a short<br />
review of the main results obtained in this approach.<br />
The gluon structure function g(xB) is the probability<br />
that a gluon carries a fraction xB of the longitudinal<br />
momentum of the fast moving hadronic target. In<br />
light cone coordinates, it is given by the Fourier transform<br />
of the matrix element of the two-point operator<br />
Glc(z − ,�z⊥ ;0,�z⊥) of longitudinally separated gluon<br />
field strength operators F b −k (0,�z⊥) and F a −k (z− ,�z⊥) in a<br />
hadron state |h(p−,�0⊥)〉. The hadron |h(p−,�0⊥)〉 is centered<br />
in transversal configuration space at � b⊥ = �0⊥ and<br />
carries a longitudinal momentum p−. A Schwinger line in<br />
the adjoint representation, running along a light like path is<br />
inserted between the gluon field strength operators. The<br />
importance of the Schwinger lines along the light cone<br />
is demonstrated e.g. in the loop-loop correlation model<br />
where hadron-hadron scattering cross-sections are calculated<br />
from Wegner-Wilson loop correlation functions. The<br />
eikonal phases arising from the strings along the x − - direction<br />
describe so–called “final state” interaction effects<br />
which distinguish structure functions from parton probabilities.<br />
We are using near-light-cone coordinates which allow us<br />
to implement light front quantization as a limit of equal<br />
time quantization.<br />
We impose the quark dynamics of the color dipole ex-<br />
∗ d.gruenewald@tphys.uni-heidelberg.de<br />
† ilgenfri@physik.hu-berlin.de<br />
‡ pir@tphys.uni-heidelberg.de<br />
ternally. Since the total hadron longitudinal momentum<br />
is given by the sum of the momenta of its constituents,<br />
the typical mean gluon momentum is taken from experiment.<br />
The gluon string momentum p S − results from the difference<br />
of hadron momentum and quark and the antiquark<br />
momenta. At the input scale Q 2 ≈ π 2 /a 2 ⊥ =1.5GeV2 ,<br />
we use the MRST-parameterization and assign a mean momentum<br />
fraction p S − =0.38 p− to the gluon system, i.e. we<br />
ascribe this momentum p S − to the gluons.<br />
The n-link distribution function is given by the product<br />
of a splitting function Pn→n−1 multiplying the gluon distribution<br />
function with n − 1 links. The one-link distribution<br />
is calculable directly from the lattice. The theoretical<br />
gluon structure function for a n = 4 link dipole is<br />
compared with the MRST and the CTEQ gluon distribution<br />
function at Q 2 =1.5GeV 2 as functions of the gluon<br />
fractional momentum xB = p g<br />
−/p−. The first moment of<br />
the lattice gluon distribution function has been fixed in this<br />
calculation to the value 〈xB〉 =0.38 at Q 2 =1.5GeV 2 .<br />
We choose four links to be consistent with the size of a<br />
proton and the relation � R2 � na<br />
⊥ = 2<br />
⊥<br />
2 and a transversal<br />
lattice spacing of a⊥ ≈ 0.65 fm. Within the systematic uncertainty,<br />
the lattice gluon distribution function agrees with<br />
the phenomenological MRST-gluon distribution function.<br />
References<br />
[1] D. Grünewald, E.-M. Ilgenfritz, E. V. Prokhvatilov, and<br />
H. J. Pirner, “Formulating Light Cone QCD on the Lattice”,<br />
Phys. Rev. D 77 (2008) 014512.<br />
[2] D. Grünewald, E.-M Ilgenfritz, and H. J. Pirner, “Gluon<br />
Structure Function of a Color Dipole in the Light-Cone Limit<br />
of Lattice QCD”, [arXiv:0908.0715 [hep-th]].<br />
277
�Æ���ÒÓÅ�ØÓÌÅ�Ø×ÙÙÖ��Ò�ÅÆ�ØØ�� ÆÓÒ���Ð��ÒÚÓÖØ�Ü×ØÖ�Ò�×�ÒÉ��<br />
����×Ù××����ÐÓÛÛ�Ó×�×Ø���Ð�ØÝ�×�Ù�Ö�ÒØ����ÝÒÓÒ Ä�ØÙ××Ø�ÖØÛ�Ø���¢Ò�Ò�Ø��ÆÓÒ���Ð��ÒÚÓÖØ�ÜØÓ �ÅÅÁ�ËÁ��ÖÑ×Ø��Ø��ÖÑ�ÒÝ�ÊÁÃ�ÆË��Ø�Ñ�Â�Ô�Ò���ÌÌÖ�ÒØÓÁØ�ÐÝ��Ã��ÓÍÒ�ÚÃ�Ò���Û�Â�Ô�Ò<br />
Û��Ö���×Ø������Ø�Ú��ÖÓÙÔ�Ò��Ò�Ö�ÐÒÓØÒ��××�ÖÝØÓ ØÖ�Ú��Ð×Ø�ÓÑÓØÓÔÝÐ�××<br />
��Ö���×�ÓÛÒØÓÀÌ���ÒÓÒ���Ð��Ò�ÑÔÐ��×Ø��ØØ�� ����Ò�Û���Ú�×ÙÔÔÓ×��Ø��×ÝÑÑ�ØÖÝÓ�Ø��×Ý×Ø�Ñ ¥���À℄�� Ø��×Ø�Ø��ÓÖ���ØÛ��ÒØÛÓ×ØÖ����ØÆ�ÎË×�×�Ò��Ô�Ò �ÒØ��¢�ÙÖ�Û�Ø��ÒØ����Ö��Ó×ÓÚÑ�Ø�Ó��Ò��ÓÙÒ�Ø��Ø ��ÓÑ�×�ÒÙÒ�Ú�Ö×�ÐÖ�ÔÙÐ×�ÓÒÌ��×�×�Ù�ØÓØ��ÓÐÓÖ ��ÒØ�ÖÓÑØ��Ö�Ð�Ø�Ú�ÓÖ��ÒØ�Ø�ÓÒ�Ø�ÐÓÒ���×Ø�Ò��Ò�<br />
Ì��ÚÓÖØ�Ü�×�ÓÒ���Ñ�Ò×�ÓÒ�ÐÐÝ�ÜØ�Ò���Ó���Ø�Ø×Ô� Ø��Ð��Ñ�Ò×�ÓÒ�� Ó×�Ø×Ô����À��ÑÓÖ�ÓÑÔÐ�ÜØ��ÒÙ×Ù�ÐÍ �ÐÐ�ØÒÓÒ���Ð��ÒÚÓÖØ�Ü×ØÖ�Ò�Æ�ÎË Ï���Ú�×ØÙ�����Ë�Ñ�ÄÓ�ÐÆ�ÎËÙÒ��Ö�×ÔÓÒ �ØØ��Ö��ÓÖ�ÐÓÓ�×Ð����×ØÖ�Ò�Û� �×� ����Ò×ØØ�����Ý�ÒØÓÆ�×�Ñ�ÐÓ�ÐÆ�ÎË××��Ø�� �ÐÓÒ��Ö��×Ø�Ò�ÓÚ�ÖÚÓÖØ�ÜÓÖ�×�Þ�Ì��×Ö�×ÙÐØÐ��ÖÐÝ ×�ÓÛ×Ø��ØØ��Ù×Ù�ÐÍ�ÚÓÖØ�Ü×ØÖ�Ò�Û�����×���Ò ��Ù��×ÝÑÑ�ØÖÝÛ����Ò�Ð��ÒØ��Ö�Ð�Ø�Ú�ÓÖ��ÒØ�Ø�ÓÒ�Ø ��Ð��Ú��ØÓ�ÔÔ��Ö�ÒØ����ÄÔ��×��×�Ò����ÙÒ×Ø��Ð� Ö���Ø�ÒØ��¢�ÙÖ�ÇÙÖÔÖ�Ú�ÓÙ×ÛÓÖ�×ÓÒØ��Æ�ÎË��Ú�<br />
Ø�Ò�ÓÙ××ÝÑÑ�ØÖÝ�Ö����Ò�Û�Ø��Ò���Ò�Ö�Ð��ÒÞ�ÙÖ� Ä�Ò��ÙØ��ÓÖÝ���Í�¢ËÍÆÓÐÓÖ¢ËÍÆ�ÚÓÖ �ÓÛÒØÓÀ�ËÍÆ��¢�ÆÌ���×�Û�Ø�Æ� ×ÙÔ�ÖÓÒ�ÙØÓÖ�Ò������Ò×�ØÝÉ��ÁÒØ��×�×�Ø��ÚÓÖ Ø�ÜÌ��ÑÓ×Ø�ÙÒ��Ñ�ÒØ�ÐÚÓÖØ�Ü×ÓÐÙØ�ÓÒ�×Ó�Ø���ÓÖÑ Ø�Ü×ØÖ�Ò�ÔÓ××�××�×ÔÖÓÔ�ÖØ��×Ó��ÓØ�ÐÓ�Ð��Ù��ÓÐÓÖ £ÙÜ�Ò�Ø���ÐÓ��Ð��ÖÝÓÒÒÙÑ��ÖÍ�×ÙÔ�Ö£Ù��ÚÓÖ ÓÖÖ�×ÔÓÒ�×ØÓ�ÓÐÓÖ�Ð�ÚÓÖÄÓ�����ÄÔ��×�Ó�ÓÐÓÖ<br />
Û��Ö�ÔÖÓ¢Ð��ÙÒØ�ÓÒ××�Ø�×�Ý� Ó�Ø��ÓÖ��ÖÔ�Ö�Ñ�Ø�Ö¨�ÒØ��ÝÐ�Ò�Ö��ÐÓÓÖ��Ò�Ø�<br />
�Ø�Ø�ÓÒÚ�ÐÙ�Ì����ÓÚ�ÚÓÖØ�Ü×ÓÐÙØ�ÓÒÐÓÓ�×�×��ÓÒ� ��¨Ö��������Ö��Ö��Ö� Û�Ø�ÕÙ�Ö�Ñ�ØØ�ÖÓÖ��℄ ���Ò�ÔÔÐ���ØÓÓÑÔ�Ø×Ø�ÖÔ�Ý×�×�ÓÖ�ÒÒ�Ö×ØÖÙØÙÖ�<br />
ÔÓÒ�ÒØÌ��×�×���Ù×�Ø����ÒØ��ÀÔÖÓÚ���×Û�ÖÔ ÚÓÖØ�ÜÛ�Ø��Ø�Ò×�ÓÒ�×�Ñ������ÓÒÐÝ�ÒØ��¢Ö×ØÓÑ �¨Û�Ø�¨���Ò�Ø��Ú�ÙÙÑ�ÜÔ� ��� ��Ò�×ÓÐÙØ�ÓÒ×Û�Ø�Ú�Ö�ÓÙ××�ØÙÔ×�℄<br />
ÑÓ��Ð×ÒÙÑ�Ö��ÐÐÝ�ÒØ������ÖÓÙÒ�ÒÓÒ���Ð��ÒÚÓÖØ�Ü �ÓÖØ��ÓÖ��ÒØ�Ø�ÓÒÑÓ���Ò�È�Ò��Ú�ÐÙ�Ø��Ø��Ã���Ð�Ö Ð�××Ø��×ÓÖÖ�×ÔÓÒ�×ØÓØ��Ô�ÓÒ���ÝÓÒ×Ø�ÒØ�Ò��Ö�Ð Ï���Ú��Ð×ÓÓÒ×ØÖÙØ��Ø��ÐÓÛ�Ò�Ö�Ý����Ø�Ú��Ø�ÓÒ<br />
ÔÓ�ÒØ×�ÒØ��Ó×�Ø×Ô����À�Í Û���Ñ���×�×��Ñ�ÒØ�ÖÓÑÖÓ××ØÓÖÓ××���ÒÓÒ ØÖ�Ú��ÐÐÓÓÔÀ�Ö�Ø��ÑÓ×Ø�ÒØ�Ö�×Ø�Ò��×Ø��ØØ����Ú�ÒØ ×��Ø��¢�ÙÖ� Ï���Ú��Ð×Ó×ØÙ����Ø���ÐÓ��ÐÆ�ÎË�××Ó��Ø��Û�Ø�<br />
�ר���«ÍĨÍÝÊÌ��ÚÓÖØ�Ü×ØÖÙØÙÖ��×Ú�ÖÝ×�Ñ�Ð�ÖØÓ ËÍÆÄÊ¢�ÆÌ��ÓÖ��ÖÔ�Ö�Ñ�Ø�Ö�×ØÖ�Ò×�ÓÖÑ�� ��ËÍÆÄ¢ËÍÆÊ¢Í��ÓÛÒØÓÀ� ��Ö�Ð×ÝÑÑ�ØÖÝ�Ö����Ò��Ò���Ò�Ö�ÐË��Ñ�ÑÓ��Ð�℄�<br />
Ñ�ØÖ��×�Ö��ÐÓ��ÐÏ���Ú��Ú�ÐÙ�Ø��Ø���ÒØ�Ö�Ø�ÓÒ�� Ø��×�Ñ�ÐÓ�ÐÓÒ���×Ù××����ÓÚ��Ü�ÔØØ��Ø�ÐÐØ��×ÝÑ ØÛ��ÒØÛÓÆ�ÎË×Û�Ø��Ö��ØÖ�ÖÝÖ�Ð�Ø�Ú�ÓÖ��ÒØ�Ø�ÓÒ�ÒØ�� �ÓÖ��Ø�ÐÓÒ���×Ø�Ò��Ó�×��Ô�Ò�ÓÒØ��Ö�Ð�Ø�Ú�ÓÖ��Ò ×�Ñ�Ð�ÖÑ�ÒÒ�ÖØÓ×�Ñ�ÐÓ�Ð�×�Ø��Ò�ÓÙÒ�Ø��ØØ��×Ø�Ø� Ø�Ø�ÓÒ�×� �Ö�Ð�Ø�Ú��Ò�Ð���ØÛ��ÒØ��ØÛÓÓÖ��ÒØ�Ø�ÓÒ×�Ò�Ø���ÓÖ�<br />
Û�Ø�Ø��Ó×�Ø×Ô��À�À �ÓÐ�×ØÓÒ�ÑÓ��×Ó�ÐÐ���ÓÖ��ÒØ�Ø�ÓÒÑÓ���××Ó��Ø�� ËÍÆ ÑÓ��Ö�ÔÖ�×�ÒØ×�Ú�ØÓÖÐ���×ÝÑÑ�ØÖÝÓÖÖ�×ÔÓÒ��Ò�ØÓ Ó�Ø��Æ�ÎË�ÙÖØ��Ö�Ö���×Ø��×ÝÑÑ�ØÖÝ�À�À� Ú�Ò�×��×Û��ÒØ��ÓÖ��ÒØ�Ø�ÓÒ�×ÓÔÔÓ×�Ø�«��Û��Ð�Ø�� Ó׫�ÖÙÒÐ���Ø��×�Ñ�ÐÓ�Ð�×��«�×<br />
���Ö��×Ó��Ö���ÓÑØÓ�××��ÒØ���Ñ������ÚÓÖØ�ÜØÓ�×Ô� ¢Í �Ò�Ø�Ù×Ø��Ö��ÔÔ��Ö×�Æ�Ñ�Ù<br />
�¢ÓÑÔÓÒ�ÒØ�ÒØ��ÑÙÐØ�ÓÑÔÓÒ�ÒØÓÖ��ÖÔ�Ö�Ñ�Ø�Ö Ï���Ú��Ú�ÐÙ�Ø��Ø���ÒØ�Ö�Ø�ÓÒ��ØÛ��ÒØÛÓ�Ë�Ñ� �ÈÆ Ì��ÓÖ��ÒØ�Ø�ÓÒÓ�ÑÙÐØ�ÚÓÖØ�Ü×ØÖ�Ò�×Ý×Ø�Ñ××Ù��×ÚÓÖØ�ÜÐ�ØØ��<br />
���ØÙÖ�ÔÖÓÚ���×�ÑÔÓÖØ�ÒØ��×�×ØÓ��Ø�ÖÑ�Ò�Ø��×ØÖÙØÙÖ� ÑÓ×ØÖ�ÔÙÐ×�Ú�Û��ÒØ��ÓÖ��ÒØ�Ø�ÓÒ�Ð��Ò׫� Ì��×<br />
�℄�ÅË��Ö����ÒÃÅË������×Ý�Ò��Ð�×����Ò� ÃÅË������×Ý�Ò�×ØÖÓÔ�Ý×�×���� Ê���Ö�Ò�× �<br />
ÄÓ�ÐÆ�ÎËÛ�Ø��Ö��ØÖ�ÖÝÖ�Ð�Ø�Ú�ÓÖ��ÒØ�Ø�ÓÒ×��Ø��Ð��Ø�℄Å�ØÓ�Æ���ÒÓ�Ò�ÅÆ�ØØ�È�Ý×Ê�Ú��<br />
�℄�Æ���ÒÓÅÆ�ØØ��Ò�ÌÅ�Ø×ÙÙÖ�È�Ý×Ä�ØØ��� ��ÆÙÐÈ�Ý×�� �� �� �<br />
NQMA-THEORY-24 <strong>GSI</strong> SCIENTIFIC REPORT 2009<br />
278
<strong>GSI</strong> SCIENTIFIC REPORT 2009 INSTRUMENTS-METHODS-01<br />
Overview<br />
The <strong>GSI</strong> mass storage systems provide safe, reliable, and<br />
redundant long term storage of all user and experiment<br />
data. Fast and highly parallel access to the data is available<br />
24 hours a day and 7 days a week.<br />
Backup/Archive functionalities are provided with the<br />
commercial Tivoli Storage Manager (TSM).<br />
Experiment data storage is performed with gStore, the<br />
<strong>GSI</strong> made client server system. Design principles and<br />
functionality are described in more detail in several previous<br />
reports (e.g. [1]) and in a paper [2].<br />
gStore Status and Enhancements<br />
At the end of 2009 about 440 TB of experiment data were<br />
available with gStore. Thereof 330 TB were stored in the<br />
IBM 3592 Automatic Tape library (ATL). The remaining<br />
110 TB are raw data copies. They are stored in a new<br />
IBM 3584-L23 ATL installed in 2009 in the BG2 building,<br />
some 100 m remote from the computing center. This<br />
prevents from loss of valuable raw data not only in case<br />
of media damage but also in case of a larger disaster in<br />
the computing centre.<br />
Used and available storage capacities of gStore components<br />
and the high performance lustre data file system<br />
(see [3]) are summarized in table 1.<br />
storage resource used max<br />
IBM 3494 ATL<br />
IBM 3584 ATL (raw data copy)<br />
overall data mover disk cache<br />
lustre disk cache<br />
<strong>GSI</strong>Template2007<br />
The <strong>GSI</strong> Mass Storage<br />
H. Göringer, M. Feyerabend, S. Sedykh<br />
<strong>GSI</strong>, Darmstadt, Germany<br />
330 TB<br />
110 TB<br />
< 90%<br />
~80%<br />
1.6 PB<br />
160 TB<br />
50 TB<br />
1.0 PB<br />
Table 1: Status <strong>GSI</strong> Mass Storage December 2009<br />
The overall I/O bandwidth amounts to 800 MB/s between<br />
data mover disk cache and tape, and up to 900 MB/s between<br />
disk cache and lustre or other user storage. In total<br />
1.6 million files (390 TB) have been moved in 2009.<br />
Backup Enhancements<br />
The migration of backup/archive data from LTO tape<br />
media has been completed in 2009. All data are stored<br />
now on modern IBM 3592 tape media in the IBM 3494<br />
ATL. The two older L700 StorageTek ATLs handling<br />
LTO1 tape media (capacity 70 TB) and LTO2 tape media<br />
(capacity 140 TB) are now out of operation.<br />
We have started to store copies of all backup/archive data<br />
additionally in the remote 3584 ATL in BG2 for potential<br />
disaster recovery.<br />
Online Migration of Experiment Data<br />
During data taking by experiments the data from the event<br />
builders must be copied for long term storage as fast as<br />
possible to gStore write cache. In addition they must be<br />
available as soon as possible for monitoring. This is realized<br />
now by gStore utilizing the lustre file system available<br />
at <strong>GSI</strong> (see figure 1).<br />
Figure 1: Online Data Flow from DAQ to gStore<br />
For this purpose the gStore API client offers a new interface<br />
developed in close cooperation with the Hades DAQ<br />
group. It is available now in the Hades DAQ system (see<br />
[4]) and in MBS V6. The data buffers sent from the event<br />
builders to gStore data movers are written to gStore write<br />
cache and to lustre, either in parallel (buffers) or sequentially<br />
(files), depending on the selected operation mode.<br />
There are some more user options to control the data<br />
flow, e.g. the fraction of files to be copied to lustre, or the<br />
maximum number of files to be written to a lustre path<br />
before automatic creation of a new path.<br />
Migration to tape takes place automatically after the copy<br />
to lustre is finished. In any case the first data buffers of a<br />
file are available in lustre for monitoring and online<br />
analysis very quickly.<br />
The new functionalities have been tested successfully<br />
with several parallel test data streams from the Hades<br />
DAQ. The gStore hardware will be upgraded in the first<br />
half of 2010 to enable – in addition to the normal operation<br />
- the support of up to 10 parallel input data streams<br />
providing overall 250 MB/s over weeks. This will match<br />
the maximum capacity of the new Hades DAQ system<br />
which will be in operation at the next major Hades beam<br />
time expected in autumn 2010.<br />
References<br />
[1] H.Göringer et al: The <strong>GSI</strong> Mass Storage System, <strong>GSI</strong><br />
Report 2009-1, p. 262<br />
[2] Experiences with gStore, a scalable mass storage<br />
system with tape backend. J.Phys.: Conf. Ser. 119<br />
Volume 119 (2008) 052018 (7pp)<br />
see also: http://www-aix.gsi.de/computing/expdv/<br />
gStoreChep07JournalofPhysics.pdf<br />
[3] W. Schön et al: High Performance Computing, this<br />
Report<br />
[4] S. Yurevich et al: The Hades Event Building System,<br />
this Report<br />
279
INSTRUMENTS-METHODS-02 <strong>GSI</strong> SCIENTIFIC REPORT 2009<br />
Grid Activities at <strong>GSI</strong> ∗<br />
M. Al-Turany, M. Dahlinger, S. Daraszewicz, P. Malzacher, A. Manafov, A. Montiel Gonzalez,<br />
V. Penso, C. Preuss, K. Schwarz, F. Uhlig, and M. Zynovyev<br />
This article describes the work of the <strong>GSI</strong> Grid Group<br />
with the aim to enlarge and operate an ALICE tier2 centre<br />
within the global environment of the LHC Computing Grid<br />
and to prototype a possible FAIR grid environment.<br />
ALICE tier2 centre<br />
The deployment of the ALICE tier2 centre has been finished<br />
in time for the startup of the Large Hadron Collider<br />
at CERN. The focus of the work moved to operating and<br />
upgrading the new infrastructure.<br />
The available disk space is distributed among an xroot 1<br />
cluster (300 TB) and Lustre 1 (700 TB). The xroot cluster is<br />
configured as a Grid Storage element, while Lustre is used<br />
for local data storage.<br />
The CPU has been increased up to 2400 cores corresponding<br />
to about 3300 KSI2K. Throughout the whole year<br />
<strong>GSI</strong> participated in all centrally managed ALICE production<br />
and data analysis activities. The overall job share of<br />
<strong>GSI</strong> and Forschungszentrum Karlsruhe has been 13% of all<br />
ALICE Grid jobs worldwide. The contribution of <strong>GSI</strong>, including<br />
local activities, comprises about 20% of the global<br />
ALICE Tier2 capacity.<br />
By running local and Grid jobs, as well as interactive<br />
PoD sessions, the compute farm is well utilised all the time.<br />
For PROOF 1 analysis a transition of the <strong>GSI</strong> Analysis<br />
Facility <strong>GSI</strong>AF 1 from a static cluster with xroot processes<br />
being tightly integrated into the system to PROOF on Demand<br />
(PoD 1 ) has been done.<br />
The whole infrastructure of the ALICE tier2 centre is<br />
monitored in detail by using MonaLisa 1 .<br />
Due to the LHC startup in autumn 2009 the ALICE tier2<br />
centre met it’s first “real data” challenge. The main tasks<br />
of a tier2 centre are Monte Carlo simulations and individual<br />
data analysis. Additionally, during the startup period alignment<br />
and calibration runs have been processed for the detector<br />
components TPC and TRD. The raw data have been<br />
transferred in real time to <strong>GSI</strong>, while the results had been<br />
made available via the central calibration data base on the<br />
Grid.<br />
The EGEE project<br />
<strong>GSI</strong> is participating in EGEE III as partner of the distributed<br />
Swiss German Regional Operations Centre (ROC)<br />
∗ Work supported by BMBF - Förderkennzeichen 01AK802G (D-<br />
Grid), 06<strong>GSI</strong>0011I (ALICE-Tier2), and PHL08/001 (Integration philippinischer<br />
und südostasiatischer Rechenzentren in das FAIR-Projekt) - and<br />
European Commission - contract number INFOSO-RI-031688 (EGEE II)<br />
and INFSO-RI-222667 (EGEE III)<br />
1 a list of related links: http://wiki.gsi.de/cgi-bin/view/Grid/Links<br />
280<br />
<strong>GSI</strong>, Darmstadt, Germany<br />
and the German Joint Research Unit (JRU). Within EGEE 1<br />
the main tasks of <strong>GSI</strong> are to operate a functioning Grid<br />
site and to support users and applications from ALICE and<br />
FAIR. In this context <strong>GSI</strong> participated also courses in interactive<br />
data analysis in the GridKa School 2009 1 .<br />
D-Grid<br />
During this year the HEP Community Grid within the D-<br />
Grid project came to an end and the final report has been<br />
submitted. In work package 3 distributed analysis tools<br />
have been developed at <strong>GSI</strong>. Within this context the PoD<br />
utilities have been released.<br />
Also significant amounts of compute resources have<br />
been bought from D-Grid fundings to enlarge the local<br />
cluster (storage and cpu). To be able to use the resources<br />
with D-Grid methods also after the end of the project the<br />
machines have been equipped with supported middleware<br />
including Globus Toolkit 4 and added to the D-Grid information<br />
system.<br />
Preparation for FAIR tier0<br />
PANDA-Grid 1 has been extended to 19 sites. In a third<br />
data challenge the full chain of simulation, digitization, reconstruction,<br />
and data analysis has been exercised. The<br />
jobs have been computed on 12 sites with <strong>GSI</strong> and Dubna<br />
being the largest contributors. Currently 3 universities from<br />
the Philippines are participating in PandaGrid. During<br />
an international Grid conference in Bohol/Philippines, the<br />
contact between Philippine and European Grid experts has<br />
been established.<br />
The central Grid services for CBM have been set up at<br />
<strong>GSI</strong>. First small productions have been running successfully<br />
at <strong>GSI</strong> using the CBM Grid infrastructure.<br />
The collaboration between ALICE and the FAIR experiments<br />
intensified significantly. Since the common software<br />
stack used by all experiments is quite large there have been<br />
many areas identified, especially in software development,<br />
where synergy effects are being experienced. Successful<br />
collaborative work has been shown in the development of<br />
the Virtual Monte Carlo (VMC) 1 interface, the development<br />
of the experiment frameworks AliRoot and FAIR-<br />
Root 1 as well as in the context of Grid computing. Recent<br />
success stories are the fact that the cmake based build system<br />
has been taken over by the AliRoot/ROOT team, the<br />
development of the AliEn 1 - Oracle interface as well as the<br />
prototyping of an inter VO 1 Grid interface.
<strong>GSI</strong> SCIENTIFIC REPORT 2009 INSTRUMENTS-METHODS-03<br />
PROOF on Demand ∗<br />
P. Malzacher, A. Manafov, V. Penso, C. Preuss, and K. Schwarz<br />
The Parallel ROOT [1] Facility, PROOF [2], is an extension<br />
of ROOT enabling interactive analysis of large sets of<br />
ROOT files in parallel. PROOF on Demand, PoD [3], is<br />
a set of utilities, which allows starting a PROOF cluster at<br />
user request on any resource management system. Installation<br />
is simple and doesn’t require administrator privileges,<br />
and all the processes run in user space. PoD gives users,<br />
who don’t have a centrally-administrated static PROOF<br />
cluster at their institute, the possibility to enjoy the full<br />
power of interactive analysis with PROOF.<br />
Overview<br />
PoD is a set of utilities, scripts, and configuration files.<br />
It provides a possibility to set up a PROOF cluster dynamically<br />
on Grid and batch systems. It consists of the following<br />
main components:<br />
• pod-agent, a lightweight, standalone C++ daemon.<br />
Responsible to control the cluster of PROOF workers<br />
and optionally acts as package forwarder when there is<br />
a firewall between server and workers. Also pod-agent<br />
has a number of additional useful features which help<br />
to start, to process, and to control a PROOF interactive<br />
analysis.<br />
• pod-console, a standalone C++ application. It provides<br />
a GUI and aims to simplify the usage of podagent<br />
and PoD configuration files. It is a PoD management<br />
console.<br />
• PoDWorker script, a generic job script, executed on<br />
remote machines.<br />
• PoD utilities, these are default job scripts for plug-ins,<br />
a number of configuration files and helper utilities.<br />
Use Case<br />
The main use case of PoD is to set up a distributed<br />
PROOF cluster on the Grid and/or local resource management<br />
system. The first thing, a user has to do, is to start<br />
the server side processes on a central machine; in terms of<br />
PoD it is a user interface machine. The next step is to submit<br />
PoD jobs to worker nodes. As soon as a job arrives at<br />
a remote worker node, it automatically configures the environment<br />
and starts all needed client services including an<br />
xrootd worker and a pod-agent in client mode. In case the<br />
pod-console is used as session management tool, each new<br />
∗ Work supported by BMBF - Förderkennzeichen 01AK802G (D-<br />
Grid),<br />
<strong>GSI</strong>, Darmstadt, Germany<br />
connection is immediately reflected in the GUI. When the<br />
instantiated PROOF workers of all submitted PoD jobs are<br />
connected, or when the user is satisfied with the number of<br />
connected worker processes, the PROOF analysis can be<br />
processed as if on a native PROOF cluster. The user then<br />
starts a ROOT session, e.g. on the private laptop, and connects<br />
to the PROOF master, registers the data, and runs the<br />
analysis script. Since PROOFAgent can manage disconnects,<br />
the user can also disconnect from ROOT, restart the<br />
ROOT session, and reconnect to the same PROOF cluster<br />
without having to resubmit the PoD jobs.<br />
The main features of PoD:<br />
Summary<br />
• One click installation. The process of installation of<br />
PoD is fully automated and in user space.<br />
• Easy to use. PoD provides a simple graphics user interface<br />
in order to simplify access to its functionality.<br />
• It works out of the box. The PoD distribution contains<br />
everything users need to just immediately start using<br />
PoD right after the installation.<br />
• Supports different job submission front-ends. Podconsole<br />
supports job manager plug-ins, therefore it is<br />
very easy to extend PoD to support different kinds of<br />
resources. PoD currently supports gLite [4] and LSF<br />
[5]. In future versions more plug-ins will be implemented,<br />
such as SSH [6] and PBS [7].<br />
• PoD supports reconnections. This is an essential<br />
feature of PoD. Whatever happens with the<br />
ROOT/PROOF analysis sessions, even a crash, users<br />
don’t need to resubmit PoD jobs. PoD will automatically<br />
refresh the environment and reconnect its workers.<br />
References<br />
[1] An Object Oriented Data Analysis Framework (ROOT)<br />
http://root.cern.ch<br />
[2] The Parallel ROOT Facility (PROOF)<br />
http://root.cern.ch/drupal/content/proof<br />
[3] PROOF on Demand (PoD) http://pod.gsi.de<br />
[4] gLite http://glite.web.cern.ch/glite/<br />
[5] Load Sharing Facility (LSF) http://www.platform.com/<br />
[6] Secure Shell (SSH) http://www.openssh.com/<br />
[7] Portable Batch System (PBS) http://www.pbsgridworks.com<br />
281
INSTRUMENTS-METHODS-04 <strong>GSI</strong> SCIENTIFIC REPORT 2009<br />
282<br />
FairRoot framework: GPUs for event reconstruction<br />
In the last few years, the graphics processor units (GPUs)<br />
have moved away from the traditional fixed-function 3D<br />
graphics pipeline toward a flexible general-purpose computational<br />
engine. Moreover they are getting cheaper and<br />
more powerful [1]. The GPU is especially well-suited to<br />
address problems that can be expressed as data-parallel<br />
computations i.e. the same program is executed on many<br />
data elements in parallel. Because the same program is executed<br />
for each data element, there is a lower requirement<br />
for sophisticated flow control; and because it is executed<br />
on many data elements and has high arithmetic intensity,<br />
the memory access latency can be hidden with calculations<br />
instead of big data caches<br />
Hardware<br />
In this work a Tesla c1060 card is used (240 cores at 1.3<br />
GHz, 4 GBytes GDDR3 memory and PCIe x16 System Interface)<br />
[2] . This card was used inside a PC with 2.5 GHz<br />
Intel Xeon Quad-Core and 16 GB memory. The Tesla products<br />
are intended for the high performance computing, the<br />
main difference between Tesla products and ordinary video<br />
cards is the lack of ability to output images to a display. The<br />
primary function of Tesla products are to aid in large scale<br />
calculations for professional and scientific fields, with the<br />
use of CUDA.<br />
Track fitting with CUDA<br />
The track fitting was compared in four different modes:<br />
GPU Float: The algorithm is implemented for GPU in single<br />
precision accuracy. GPU Double: The algorithm is implemented<br />
for GPU in double precision accuracy. CPU :<br />
original algorithm. GPU Emulation: The GPU implementation<br />
runs on the CPU in GPU emulation mode. The results<br />
obtained from the different runs are summarized in<br />
table.1.<br />
Mode/(Track/event) 50 100 1000 2000<br />
GPU (Emu) 6.0 15.0 180 370<br />
CPU 3.0 5.0 120 220<br />
GPU (Double) 1.2 1.5 3.2 5.0<br />
GPU (Float) 1.0 1.2 1.8 3.2<br />
Table 1: Results: Time in ms needed to fit the corresponding<br />
number of tracks using the different algorithms and/or<br />
mode<br />
The comparison between GPU and CPU time is summarized<br />
in figure 1. from this figure one can see that one can<br />
gain almost a factor 70 in this example. However using the<br />
M. Al-Turany 1 and F. Uhlig 1<br />
1 <strong>GSI</strong>, Darmstadt, Germany<br />
Figure 1: Ratio between time needed on CPU to the time<br />
needed by GPU for track fitting<br />
”CUDA Occupancy Calculator” (i.e. a programmer tool<br />
that allows you to compute the multiprocessor occupancy<br />
of a GPU by a given CUDA kernel [3]) we found that in this<br />
example we are using only 25 % of the hardware, which explain<br />
the difference between double and float calculations.<br />
i.e. using the full capacity of the Tesla card one expect to<br />
have about a factor ten in performance between float and<br />
double (see Reference [2] ).<br />
Conclusion<br />
In contrary to GPGPU, which usually means, writing<br />
software for a GPU in the language of the GPU CUDA permits<br />
working with familiar programming concepts while<br />
developing software that can run on a GPU, Moreover<br />
CUDA compile the code directly to the hardware (GPU<br />
assembly language, for instance), thereby providing great<br />
performance. Using GPUs for track fitting one can win orders<br />
of magnitudes in performance compared to the CPUs,<br />
however one has to determine how to divide the data into<br />
smaller chunks for distribution among the thread processors<br />
(GPUs)<br />
References<br />
[1] CUDA, Supercomputing for the Masses,<br />
http://www.ddj.com/hpc-high-performance-computing/<br />
[2] Tesla C1060 Computing Processor,<br />
http://www.nvidia.com/object/product tesla c1060 us.html<br />
[3] NVIDIA http://developer.nvidia.com/object/cuda.html
<strong>GSI</strong> SCIENTIFIC REPORT 2009 INSTRUMENTS-METHODS-05<br />
Status of the HLT-RORC and the Fast Cluster Finder ∗<br />
T. Alt 1 and V. Lindenstruth 1<br />
1 Frankfurt Institute of Advanced Studies, Goethe-Universität Frankfurt, Germany<br />
The ALICE HLT-RORC is a FPGA based PCI-X<br />
card which receives the data via optical links from the<br />
ALICE detector and transfers it into the memory of<br />
the HLT computing farm. Furthermore the use of programmable<br />
logic allows to implement some of the detector<br />
specific analysis algorithms in hardware which gives<br />
a significant speedup in processing time. For the AL-<br />
ICE TPC the first step of the tracking, the Fast Cluster<br />
Finder, has been realized in the FPGA.<br />
H-RORC<br />
The HLT-Read Out Receiver Card (RORC) is a PCI-X<br />
card which receives the data from the detectors with dedicated<br />
optical interfaces (DIUs), formats and transmits it<br />
via DMA into the main memory of the hosting node. The<br />
card supports up to 2 DIU cards and provides 4 independent<br />
DMA channels. Two of the channels are used for the raw<br />
data, while the other two can be used for preprocessed data.<br />
The total maximum transfer rate is about 900 MByte/s. The<br />
framework inside the FPGA provides standardized interfaces<br />
for detector specific algorithms. In case of the ALICE<br />
TPC this algorithm is called Fast Cluster Finder, which is<br />
the first step in tracking. The Fast Cluster Finder is based<br />
on the software cluster finder.<br />
����<br />
�����<br />
�������<br />
�����<br />
�����<br />
�����<br />
�����<br />
���<br />
��������<br />
�������<br />
������<br />
���<br />
��������<br />
�������<br />
������<br />
������<br />
������<br />
Figure 1: H-RORC FPGA Framework<br />
Status of H-RORC<br />
• 250 H-RORCs installed in the HLT<br />
• Continuous operation since 2007<br />
• All cards operate stable<br />
Fast Cluster Finder<br />
The Fast Cluster Finder is the first step in the tracking<br />
of the TPC. It calculates the center of gravity of the charge<br />
distribution generated by a traversing, charged particle in<br />
the TPC. The clusters are then used as seeds for the tracker.<br />
∗ Work supported by BMBF.<br />
���<br />
���<br />
����<br />
��<br />
��<br />
��<br />
��<br />
��<br />
��<br />
��<br />
��<br />
��<br />
��<br />
�<br />
���<br />
����<br />
��<br />
��<br />
��<br />
��<br />
��<br />
��<br />
��<br />
��<br />
��<br />
��<br />
�<br />
���<br />
Figure 2: Example of clusterfinding for one cluster. First<br />
the cluster candidates are calculated (red dots) for each pad<br />
in time direction, then neighboring pads are searched for<br />
adjacent candidates, which are merged (red square)<br />
����<br />
��<br />
��<br />
��<br />
��<br />
��<br />
��<br />
��<br />
��<br />
��<br />
��<br />
�<br />
���<br />
����<br />
Implementation of the algorithm<br />
The algorithm consists of several modules ( Fig.3) which<br />
process the raw TPC data. The channel extractor extracts<br />
the channels from the data stream and applies the gain calibration<br />
for each channel. The channel processor handles<br />
the single channels (pads) and calculates the cluster candidates<br />
in time direction. This information is passed to the<br />
channel merger which searches for matching candidates on<br />
adjacent channels and merges them into a cluster. For the<br />
found clusters the FP division unit calculates then the center<br />
of gravity in pad and time direction and the deviation.<br />
��������<br />
�������<br />
�������<br />
�������<br />
���������<br />
��������������������������<br />
�����������������������������<br />
�������<br />
����<br />
����������<br />
�������<br />
���������<br />
����������������������<br />
����������������������������<br />
�����������������������<br />
�����������������������<br />
����������� ����������<br />
����<br />
������<br />
����<br />
�������<br />
������<br />
����������������������������<br />
�����������������<br />
��������������������������������<br />
��������������<br />
��<br />
��<br />
��<br />
��<br />
��<br />
��<br />
��<br />
��������<br />
���<br />
�����������<br />
��<br />
��<br />
��<br />
�<br />
������������������������<br />
������������������<br />
Figure 3: Block diagram of the Fast Cluster Finder<br />
Status of the Fast Cluster Finder<br />
• Algorithm fully implemented and integrated<br />
• 216 Fast Cluster Finder for the ALICE TPC<br />
• Tested and verified with generated and simulated data<br />
• Benchmarking and testing with real data ongoing<br />
• Processing time for 10 tracks in a TPC sector ∼65 us<br />
• Processing time for 200 tracks in a TPC sector ∼750<br />
us<br />
���<br />
283
INSTRUMENTS-METHODS-06 <strong>GSI</strong> SCIENTIFIC REPORT 2009<br />
Go4 Analysis Framework v4.4<br />
J. Adamczewski-Musch 1 , H.G. Essel 1 , and S. Linev 1<br />
Overview<br />
Go4 (<strong>GSI</strong> Object Oriented Online Offline) is established<br />
as standard <strong>GSI</strong> analysis framework for several experiments<br />
of atomic and nuclear structure physics, e.g.<br />
FRS, SHIP, TASCA, and RISING. Go4 is based on ROOT<br />
(root.cern.ch) and can be <strong>download</strong>ed under GPL from the<br />
Go4 homepage go4.gsi.de. At <strong>GSI</strong>, Go4 is installed and<br />
maintained on the public linux cluster.<br />
A new release Go4 v4.4 was published in 2009, which<br />
can be built either with Qt3 or native Qt4 (Nokia) graphics<br />
libraries, respectively.<br />
The new version runs on Linux and Solaris, and has been<br />
ported to Windows (XP and W7) with full GUI support.<br />
More than fifty modifications have been made compared<br />
to v4.0 enhancing performance and interactive operation,<br />
less than 10% concerning bug fixes. A standard analysis<br />
executable is provided which can replace the main programs<br />
of most of the applications. New functions to automatically<br />
restore or create analysis objects like histograms<br />
are available. The tools to install, build, and run Go4 are<br />
improved considerably. All modifications are downwards<br />
compatible. No application code needs to be changed.<br />
GUI improvements (Qt4)<br />
Because Qt3 will not be supported anymore in the near<br />
future, it was necessary to port the Go4 GUI to the current<br />
Qt version 4. Early Go4 versions 4.x were built on the<br />
Qt3 compatibility mode libraries of Qt4. Qt3 could only<br />
be used with Go4 v3.x. The new Go4 v.4.4 is adapted and<br />
linked to the native Qt4 libraries, but can also be built with<br />
old native Qt3 libraries.<br />
New standard executable<br />
Up to now a Go4 application had to provide a main program,<br />
commonly named MainUserAnalysis. Parts of this<br />
program had to be kept unchanged to be callable from the<br />
framework. Other parts were free to implement application<br />
specific code. This mixture made problems when the<br />
framework changed.<br />
Therefore there is now a standard executable go4analysis<br />
maintained as part of the framework. Application specific<br />
code for setup can be moved from existing main programs<br />
to the application analysis (subclass of TGo4Analysis).<br />
The main programs can then be discarded. User arguments<br />
from the command line are passed as argument vector to the<br />
application analysis constructor. Through this mechanism<br />
user argument lists can be used as before. A standard argument<br />
list is evaluated by go4analysis. Invoking go4analysis<br />
284<br />
1 <strong>GSI</strong>, Darmstadt, Germany<br />
from shell with optional arguments one can steer the analysis<br />
and manage the analysis steps.<br />
Restoring and creating objects<br />
Analysis objects like histograms can be stored in ROOT<br />
files and restored from these files on next startup. Up to<br />
now the application code had to check if a histogram or<br />
parameter had been restored by the framework or had to be<br />
created. Now there is a set of new API functions doing this<br />
implicitly: when the object cannot be restored from a file it<br />
is created. For histograms, arguments can be specified for<br />
the lettering saving some lines of codes needed previously.<br />
New applications<br />
Go4 has been used for on-line monitoring during a CBM<br />
test beam [1]. Connected to the data acquisition system<br />
(based on DABC [2][3]) the detector performance could be<br />
checked on-line. Figure 1 shows a screen shot from two<br />
detectors, RICH and STS.<br />
Figure 1: Go4 used as on-line monitor for the CBM test<br />
experiment. In front a quarter of a Cherenkov ring (RICH),<br />
in background the beam spot (STS).<br />
A new Go4 application for on-line and off-line analysis<br />
of the TASCA experiment 114 was written and used during<br />
the summer beam time (www-win.gsi.de/tasca09).<br />
References<br />
[1] P. Senger, “Successful beam test of prototype detectors for<br />
CBM and PANDA”, FAIR newsletter 14, page 5<br />
[2] J. Adamczewski, H.G. Essel, N. Kurz, S. Linev, “Data Acquisition<br />
Backbone Core DABC”, IEEE Trans.on Nucl. Science,<br />
Vol.55, No.1, pp. 251-255, February 2008.<br />
[3] J. Adamczewski, H.G. Essel, N. Kurz, S. Linev, “Data Acquisition<br />
Backbone Core DABC”, Journal of Physics: Conference<br />
Series 119 (2008) 022002
<strong>GSI</strong> SCIENTIFIC REPORT 2009 INSTRUMENTS-METHODS-07<br />
Go4 Analysis for TASCA<br />
H.G. Essel 1 , J. Dvorak 3,4 , J.M. Gates 1,2 , A. Gorshkov 2 , and A. Yakushev 2<br />
1 <strong>GSI</strong>, Darmstadt, Germany; 2 TU Munich, Germany; 3 LBNL Berkeley, CA, USA; 4 UC Berkeley, CA, USA<br />
Go4 [1] (go4.gsi.de) is established at <strong>GSI</strong> as standard<br />
analysis framework. It is based on ROOT (root.cern.ch)<br />
providing full access to ROOT functionality. Getting<br />
data on-line from the <strong>GSI</strong> standard DAQ system MBS<br />
[2] or processing data files produced by MBS is fully<br />
supported. At <strong>GSI</strong>, Go4 is installed and maintained on<br />
the public Linux cluster. In addition, it can be <strong>download</strong>ed<br />
and installed on any Linux or Windows machine.<br />
For the new TASCA [3] and COMPACT [4] experiments<br />
(www-win.gsi.de/tasca09) a new analysis package<br />
has been developed based on Go4. It can be used for calibration,<br />
on-line monitoring, and final analysis.<br />
The analysis is separated in four processing steps. This<br />
makes the analysis faster, and the data sets smaller. The<br />
processing of the first two steps, Unpack and Calibration,<br />
has to be done only once or at least rather seldom. The<br />
Checker step has to be processed eventually more often<br />
because here the events are tagged and discarded. The<br />
Analysis step does the detailed chain search and might<br />
be repeated very often. Each step optionally can store its<br />
output events to a ROOT file which can also be processed<br />
by standard ROOT macros without the Go4 analysis<br />
program. The analysis layout is shown in figure 1. The<br />
Figure 1: TASCA analysis layout<br />
left column shows the event data objects stored/retrieved<br />
to/from files. The middle column shows the processing<br />
functions of the event loop steps. The right column shows<br />
utility objects, macros and files used by the functions.<br />
In the setcontrol.C macro the execution of the steps, file<br />
writing, and histogramming can be switched on or off.<br />
Unpacker step unpacks raw events from LMD files<br />
or MBS. Function Unpack uses a Codec object to decode<br />
multiplexed detector channels and fills the data fields of<br />
UnpackedEvent. Codec also keeps the mapping tables.<br />
Unpacked events contain full data arrays, the time stamps,<br />
multiplicities and detector hit lists.<br />
Calibrator step calibrates all data fields. It gets<br />
UnpackedEvent from Unpack step or from file. CalibratedEvent<br />
contains the detector hit lists, but not the arrays.<br />
Checker step checks events. It gets CalibratedEvent from<br />
Calibrator step or from file. CheckedEvent is similar to<br />
CalibratedEvent but keeps in addition the event identification<br />
tag Evr, Alpha1, Alpha2, Alpha3, Fission1, Fission2,<br />
or Back. Events without tag are discarded.<br />
Analysis step gets CheckedEvent from Checker step or<br />
from file and builds event stack. If an analysis start condition<br />
is fullfilled, the event stack is analyzed backwards<br />
looking for possible decay chains. Chain candidates are<br />
stored in a plain ROOT tree from TascaEvent events tagged<br />
as chain members together with a chain number.<br />
Data Files Type GBytes Time<br />
Raw 956 LMD 400 25h<br />
Calibrated 167 ROOT 54 2h<br />
Checked 5 ROOT 3 10m<br />
The table shows the amount of data generations and time<br />
to produce the next generation. The unpacked data keep<br />
the full detector arrays, the calibrated data only hit indices<br />
and values. This reduces the event size considerably.<br />
A second independent off-line analysis code was developed<br />
to verify correctness of the data analysis. This code<br />
written in C and ROOT allowed for detailed event identification,<br />
for correlation search between the events, as well as<br />
for studying of statistical data properties. Results of the<br />
independent data analysis were found to be in complete<br />
agreement with the results obtained with GO4 analysis.<br />
Both analysis programs have been used for the TASCA<br />
element 114 run, results are in [5].<br />
References<br />
[1] J. Adamczewski, M. Al-Turany, D. Bertini, H.G. Essel,<br />
S. Linev, “Go4 online monitoring”, IEEE Trans.on Nucl. Science,<br />
Vol.51, No.3, June 2004, pp 565-570<br />
[2] H.G. Essel, J. Hoffmann, N. Kurz, W. Ott, “The general purpose<br />
data acquisition system MBS”, IEEE Trans.on Nucl.<br />
Science, Vol.47, No.2, April 2000, pp. 337-339<br />
[3] A. Gorshkov et al., “A new TASCA focal plane detector setup<br />
and DAQ system”, <strong>GSI</strong> Sci. Report 2009<br />
[4] A. Yakushev et al., “COMPACT Coupled to TASCA for Element<br />
114 Chemistry”, <strong>GSI</strong> Sci. Report 2009<br />
[5] Ch.E. Düllmann et al., “Production and decay of element 114:<br />
high cross sections and nucleus 277 Hs”, <strong>GSI</strong> Sci. Report 2009<br />
285
INSTRUMENTS-METHODS-08 <strong>GSI</strong> SCIENTIFIC REPORT 2009<br />
In the experiments involving the use of in-flight radioactive<br />
beams the selectivity and the detection of the rare<br />
products are very demanding. Using faster processing and<br />
data acquisition (DAQ) is also important and can be crucial<br />
for the realization of those experiments that otherwise<br />
may require a non realistic beam time.<br />
In particular, here we concern with experiments which<br />
can be performed at the <strong>GSI</strong> Fragment Separator (FRS)<br />
[1], where the count rate is limited to 10 6 pps due to an<br />
event-by-event basis detection. Depending on the reaction<br />
channel the number of parameters involved can change up<br />
to a factor 100. This is strictly connected to the used detectors<br />
and their electronics. Until now the FRS standard<br />
DAQ was working under the <strong>GSI</strong> Multi-Branch-System<br />
(MBS) [2] in the so called single event mode. The data<br />
sender is a RIO-3 CES (800MHz) processor which is located<br />
in the FRS VME crate. In this case, each event (i.e.<br />
VME ADC, TDC, QDC signals) is read out at each accepted<br />
trigger as 34 words. During this period, typically<br />
120 μs, the DAQ is busy and any other trigger is rejected.<br />
This fixes the dead time.<br />
Recently we have considered the use of a more efficient<br />
read out in BLock Transfer mode (BLT), which is supported<br />
by the VME Caen modules. A BLT read out of<br />
32x34 words takes place and allows to read all events<br />
stored in the buffer (multi event mode). Whenever the<br />
buffer is empty a Bus error is generated.<br />
Test results<br />
This mode was recently tested online at different particle<br />
rates and compared with the standard one. The test was<br />
performed in August 2009 during the FRS000 beam time.<br />
A 238 U 73+ beam at 750 MeV/u was delivered by the SIS18<br />
with a spill length of 2 s. A Cu target of 90 mg/cm2 thickness<br />
was used at the entrance of the FRS to produce fragments<br />
which are then separated at the FRS mid-focal<br />
plane (S2) according their magnetic rigidity. The FRS<br />
standard equipments, i.e. scintillators, Time Projection<br />
Chambers and MUSIC detectors, were used for getting<br />
the particle identification (PID) on an event-by-event basis.<br />
The trigger was provided by the signal released by the<br />
particles counted by the scintillator and sent to the two<br />
different DAQ. The same number of VME boards were<br />
adopted in each DAQ. In particular we used ADCV795,<br />
QDCV792 and TDCV775 for detecting signals. The latter<br />
were all equally split and sent to the same number of<br />
modules. The signals of both DAQ were digitalized and<br />
registered on disk. The trigger rate was increased up to 20<br />
kHz by varying the FRS acceptance opening the slits or<br />
increasing the intensity of the primary beam.<br />
The two DAQ were compared on the basis of their live<br />
time, defined as the ratio between the number of the accepted<br />
and free triggers. The result is shown in Fig. 1 as a<br />
286<br />
<strong>GSI</strong>Template2007<br />
A novel FRS Data Acquisition<br />
C. Nociforo 1 and N. Kurz 1<br />
1 <strong>GSI</strong>, Darmstadt, Germany<br />
function of the particle rate. The new DAQ is more effective<br />
compared to the standard one starting from around<br />
400 Hz. A gain factor equal to two was reached at about 4<br />
kHz. The measured dead time at 10 kHz was equal to<br />
48%.<br />
The multi-event DAQ was running in stable condition<br />
giving an adequate PID. The next step will be to include<br />
the scaler Caen V830 into the new read out. Preliminary<br />
tests have given promising results.<br />
gain factor<br />
3<br />
2<br />
1<br />
0<br />
10 100 1000 10000<br />
rate (Hz)<br />
Figure 1: Gain factor of the FRS multi-event DAQ mode<br />
in respect to the standard one as a function of the particle<br />
rate.<br />
Summary<br />
A novel FRS DAQ based on a BLM mode was tested at<br />
the FRS. Its use can be adopted alternatively in those experiments<br />
which require the use of standard FRS equipments<br />
and an higher rate. A gain factor up to two was<br />
experimentally achieved. We would like to emphasize<br />
that this value could be still improved by using a RIO-4<br />
CES processor. In fact another gain factor of two was<br />
already observed coupling this unit to the standard FRS<br />
single-mode DAQ. Thus in total a gain factor of approximately<br />
four may be achieved in future compared to the<br />
present situation.<br />
References<br />
[1] H. Geissel et al, Nucl. Inst. Meth. B 70 (1992) 286.<br />
[2]<strong>GSI</strong>-Multi Branch System http://www.w2k.gsi.de/daq/.
<strong>GSI</strong> SCIENTIFIC REPORT 2009 INSTRUMENTS-METHODS-09<br />
<strong>GSI</strong>Template2007<br />
Time Resolution of Diamond Detectors for Relativistic Ions and Protons*<br />
E. Berdermann 1 , M. Ciobanu 1 , M. Henske 1 , M. Kiš 1,2 , W. Koenig 1 , M. S. Rahman 1 , M. Träger 1<br />
1 <strong>GSI</strong>, Darmstadt, Germany, 2 IRB, Zagreb, Croatia<br />
The high pair production energy of diamond (εDia=<br />
12.84 eV) is a challenging material property in timing<br />
measurements of relativistic light ions and Minimum Ionizing<br />
Particles (MIPs). The low amount of generated<br />
charge (QG) predicts reduced detection efficiency of assemblies,<br />
readout with broadband Front End Electronics<br />
(FEE). Eqs. (1) and (2) describe the time resolution σt and<br />
the Signal-to-Noise ratio (S/N), respectively [1]:<br />
σ t = N<br />
dV /dt =<br />
k⋅T ⋅( F−1)⋅C<br />
D<br />
2.28⋅Q e,h C( )⋅BWA (1)<br />
S /N = QC( e,h)/<br />
k⋅T ⋅( F−1)⋅C<br />
(2)<br />
D<br />
with k, the Boltzmann constant; T the temperature; QC,<br />
the collected charge; CD the detector capacitance; F and<br />
BWA the noise factor and bandwidth of the FEE.<br />
Accordingly the task is to maximize QC and BWA and<br />
heights on the input impedance of a Diamond Broad band<br />
Amplifier (DBA: 50Ω, 2.5pF, 2.3GHz), generated from<br />
ions of same velocity 1GeV/A in diamond sensors of different<br />
Charge-Collection Efficiency (CCE = QC/QG) and<br />
thickness dD = 50–400 µm (indicated by the line colours).<br />
Dot electrodes of 3 mm in diameter were assumed, and a<br />
thickness and quality dependent FWHM of the signals.<br />
The horizontal lines indicate the (rms) noise amplitude of<br />
the DBA (solid line) and its 3σ deviation (dashed line),<br />
which is at least the amplitude required for good detection<br />
efficiency and time resolution with this FEE.<br />
Figure 1: Expected amplitudes on 50 Ω vs. the CCE of<br />
diamond sensors of different dD (line colours) (see text).<br />
The data show that for Z > 6, polycrystalline diamond<br />
plates of dD ≥ 50µm and CCE ≥ 0.2 are feasible, whereas<br />
MIP timing with DBA like FEE is prevented even for best<br />
single-crystal CVD Diamond sensors of CCE ~ 1.<br />
Extended simulations confirm the best time resolution<br />
for low-capacitance broadband assemblies where both<br />
CD and parasitic capacitances CP are ≤ 1pF; degradation<br />
up to a factor of three appears for CP ≥ 2pF.<br />
* Supported by EC Projects RII3-CT-2004-506078<br />
and MC-PAD<br />
Recent Results with 6 Li Ions of 1.8 AGeV<br />
We tested the intrinsic time resolution of scCVDD<br />
quadrant sensors for relativistic 6 Li ions with two setups<br />
each consisting of two dD = 400µm (Setup 1, top left) and<br />
100 µm thick samples (Setup 2, bottom left), respectively.<br />
The corresponding single-sector capacitances were CD-<br />
1S400 = 0.2 and CD-1S100 = 0.9 pF. The modular Setup 1 was<br />
readout via capacitive buffers for each sector followed by<br />
modified FEE-1 cards [2] implemented as a 2 nd stage analogue<br />
processing (MOS-follower; 1MΩ, 2.1pF, 1GHz). In<br />
Setup 2, the diamond sensors were mounted on the FEE<br />
boards with each sector wire bonded to an active impedance<br />
transformer of Ci = 0.2 pF. Subsequently, the signals<br />
were shaped with an external booster amplifier [3]. The<br />
best proton result with the former ‘low-Ci BBA’ used for<br />
the HADES Start Detector (SD) was σintr = 117 ps [3].<br />
The time-difference spectra obtained with both setups<br />
are shown on the corresponding right graphs of Fig. 2.<br />
Note that for Setup 1 the data analysis is preliminary and<br />
incomplete. Resolutions σt = 77 ps (σintr = 55 ps) achieved<br />
by selecting prompt time coincident events of high signal<br />
amplitudes. No walk correction is performed at present.<br />
In contrast, the Setup 2 data are walk corrected and processed<br />
under the condition that no neighbour sectors have<br />
fired. Due to the new transistor implemented (SiGe:C;<br />
BFR705L3RH) an excellent σintr = 32ps with a pure diamond<br />
contribution of 21ps was achieved. Further improvement<br />
is expected by readout micro-patterned SDs<br />
with broadband ASICs (PADI [1]) modified for higher<br />
sensitivity (to be tested in spring 2010).<br />
Figure 2: (left) The tested Setups, 1 (top) and 2 (bottom).<br />
(right) Time-difference spectra of two opposite sectors.<br />
References<br />
[1] E. Berdermann, M. Ciobanu* et al., Proc. IEEE NSS-<br />
MIC, Orlando, 2009, Conference Record.<br />
[2] M. Ciobanu et al, IEEE Trans. on NS, Volume 54,<br />
Issue 4, Pages:1201 – 1206, August 2007.<br />
[3] J. Pietraszko et al., subm. to NIM A, November 2009<br />
287
INSTRUMENTS-METHODS-10 <strong>GSI</strong> SCIENTIFIC REPORT 2009<br />
Some Numerical Investigation of High Energy Electron Cooling ∗<br />
G. Zwicknagel<br />
Institut <strong>für</strong> Theoretische Physik, Universität Erlangen, Germany<br />
The theoretical description of electron cooling is<br />
usually based on cooling force models which are derived<br />
assuming quasi-stationary conditions, i.e. a continuous<br />
flux of electrons colliding with the ions and<br />
a Debye-screened interaction [1, 2, 3]. But this assumption<br />
will become questionable in a high energy<br />
cooling scenario, as at the planed HESR. Here the interaction<br />
time during which ion and electron beams<br />
are merged in the cooler might be too short to reach<br />
this regime. The related lack of time to built up the<br />
screening will enlarge the interaction range and thus<br />
increases the cooling force logarithmically with the increasing<br />
screening length λ. Less obvious is the influence<br />
of now also occurring incomplete ion-electron<br />
collisions which we therefore investigated by Classical<br />
Trajectory Monte Carlo (CTMC) simulations (see [4]).<br />
Some first results are given in Fig.1 and 2, where we<br />
show the proton-electron velocity transfer ∆v r� parallel<br />
to the magnetic field (and beamline) which converts<br />
into the parallel cooling force after averaging over the<br />
- ∆ v r|| / v c x 10 5<br />
∆ v r|| / ∆ v r|| oo<br />
2.0<br />
1.5<br />
1.0<br />
0.5<br />
0.0<br />
1<br />
0.1<br />
0.01<br />
0.001<br />
5<br />
10<br />
15<br />
v r|| / v th||<br />
τ max ω p > 10 3<br />
τ max ω p = 2.2<br />
τ max ω p = 0.7<br />
τ max ω p = 0.02<br />
20<br />
v r|| / v th|| = 2.0<br />
v r|| / v th|| = 5.0<br />
v r|| / v th|| = 7.5<br />
v r|| / v th|| = 10.<br />
0.01 0.1 1 10 100 1000<br />
τ max ω p<br />
Figure 1: Velocity transfer ∆v r� of protons moving<br />
with vp⊥ = 0.5 v th� in a beam of monoenergetic electrons.<br />
Upper part: as function of the relative velocity<br />
v r� for different interaction times τmax. Lower part:<br />
as function of τmax for different v r� now normalized to<br />
∆v r�∞ for infinite τmax. Here vc = (e 2 /4πε0meλ) 1/2 .<br />
288<br />
∗ Work supported by the BMBF (06ER145)<br />
25<br />
electron distribution. It is shown here as a function<br />
of the proton-electron relative velocity v r� in units of<br />
the thermal parallel ion velocity v th� and the maximum<br />
interaction time τmax, i.e. the time the beams<br />
are merged, in units of the inverse plasma frequency<br />
(all quantities refer to the cm-frame of the ion<br />
ω−1 p<br />
beam). The parameters of the electron beam are close<br />
to the HESR design with Te⊥ = 0.1 eV, Te⊥ = 0.1<br />
meV, ne = 2 · 106 cm−3 , B = 0.48 T, and ωp ≈ 8 · 107 s−1 . For the CTMC simulations a Debye-screened interaction<br />
with λ = 5 · 10−4 m has been used.<br />
Considering only the effect of incomplete collisions<br />
we find that the velocity transfer and thus the cool-<br />
ing force starts to decrease as soon as the interaction<br />
time τmax gets smaller than about 10 ω−1 p and will go<br />
down to around 1% and less of its value in a stationary<br />
scenario for τmax ≪ ω−1 p .<br />
- ∆ v r|| / v c x 10 4<br />
∆ v r|| / ∆ v r|| oo<br />
0.8<br />
0.6<br />
0.4<br />
0.2<br />
0<br />
1<br />
0.1<br />
0.01<br />
0.001<br />
5<br />
10<br />
15<br />
v r|| / v th||<br />
τ max ω p > 10 3<br />
τ max ω p = 2.2<br />
τ max ω p = 0.7<br />
τ max ω p = 0.02<br />
20<br />
v r|| / v th|| = 2.0<br />
v r|| / v th|| = 5.0<br />
v r|| / v th|| = 7.5<br />
v r|| / v th|| = 10.<br />
0.01 0.1 1 10 100 1000<br />
τ max ω p<br />
Figure 2: Same as Fig.1, but now for vp⊥ = 5.0 v th�<br />
References<br />
[1] BETACOOL: http://lepta.jinr.ru/betacool/betacool.htm;<br />
A.O. Sidorin et al., NIMA 558, 325 (2006)<br />
[2] I.N. Meshkov: Phys. Part. Nuclei 25, 631 (1994)<br />
[3] H. Poth: Phys. Reports 196, 135 (1990)<br />
[4] H. Nersisyan, C. Toepffer, G. Zwicknagel, Interactions<br />
Between Charged Particles in a Magnetic Field<br />
(Springer, Berlin Heidelberg New York 2007)<br />
25
<strong>GSI</strong> SCIENTIFIC REPORT 2009 INSTRUMENTS-METHODS-11<br />
<strong>GSI</strong>Template2007<br />
Generation of shielding data for neutron radiation produced by heavy ions<br />
Introduction and Method<br />
The aim of this work is the provision of attenuation<br />
data for normal concrete on the basis of double differential<br />
source distributions (solid angle, energy) of released<br />
neutron radiation. For this purpose attenuation data for<br />
mono-energetic neutron radiation were computed using<br />
the radiation transport code FLUKA[1] employing a special<br />
shaped concrete shielding from 1.5 m to 8 m in an<br />
energy range from 100 keV to 3 GeV, see Fig. 1.<br />
Dose per primary neutron / pSv<br />
0.1<br />
0.01<br />
1E-3<br />
1E-4<br />
1E-5<br />
1E-6<br />
1E-7<br />
G. Fehrenbacher 1 , T. Radon 1<br />
1 <strong>GSI</strong>, Darmstadt, Germany<br />
3 GeV<br />
1 GeV<br />
300 MeV<br />
200 MeV<br />
150 MeV<br />
100 MeV<br />
1E-8<br />
1E-9<br />
60 MeV<br />
30 MeV<br />
monoenergetic<br />
10 MeV<br />
neutron-<br />
1E-10<br />
1E-11<br />
1E-12<br />
3 MeV<br />
1 MeV<br />
300 keV<br />
100 keV<br />
source<br />
0<br />
concrete 2 4 6 8m<br />
0 100 200 300 400 500<br />
Depth in concrete / cm<br />
600 700 800<br />
Figure 1: Attenuation curves of mono-energetic primary<br />
neutrons in the energy range from 100 keV to 3 GeV derived<br />
from MC-calculations with FLUKA. The neutrons<br />
were virtually transported through 8 m of concrete, see<br />
insert.<br />
Measured [2,3] or calculated double differential neutron<br />
yields, see Fig. 2 serve as source terms (Eq. 1). These<br />
are then being folded with the (interpolated) monoenergetic<br />
attenuation curves, see Eq. 2. In this way the<br />
total dose as a function of the shielding thickness for each<br />
angular range is provided.<br />
-1 -1<br />
Neutron yield / GeV sr<br />
10000<br />
1000<br />
100<br />
10<br />
1<br />
0.1<br />
0° BaF2<br />
0° LAND<br />
0° FLUKA<br />
90° BaF2<br />
90° FLUKA<br />
0.01<br />
1E-3 0.01 0.1<br />
Energy / GeV<br />
1<br />
Figure 2: Source distributions of neutron spectra (0° and<br />
90°) obtained by measurements and calculations.<br />
2<br />
∂ N(<br />
E,<br />
ϑ)<br />
N( E,<br />
ϑ , θ)<br />
= ∫∫ dΩdE<br />
(1)<br />
∂E∂Ω<br />
H<br />
tot<br />
( x,<br />
ϑ,<br />
θ ) = 2π<br />
( 1−<br />
cosθ<br />
) ⋅<br />
⋅<br />
3GeV<br />
∑<br />
⎛ H<br />
⎜<br />
⎝ N<br />
mono<br />
E = 100keV<br />
mono<br />
2<br />
( x,<br />
θ ) ∂ N(<br />
E,<br />
ϑ)<br />
⎞<br />
⋅<br />
⎟<br />
( E)<br />
∂E∂Ω<br />
⎠<br />
Results<br />
In Fig. 3 the resulting attenuation curves are shown,<br />
based on the source distributions from Fig. 2. Due to the<br />
strong forward production of the neutron radiation the<br />
dose values and the depth dose curves are significantly<br />
higher for the 0°. The LAND related attenuation curve<br />
(0°) gives the highest dose values. This can be explained<br />
by the largest portion of neutrons near the peak at 600<br />
MeV. Due to the lowest fraction of high energy neutrons<br />
(En > 300 MeV) from the BaF2 measurements the resulting<br />
attenuation curve comes to the lowest dose values. An<br />
analogous explanation can be applied for the 90° direction.<br />
In order to show how the method proposed works a<br />
complete MC calculation i.e. the creation of neutrons and<br />
their transport through the concrete was performed. The<br />
agreement of these "full FLUKA" curves with the separately<br />
performed yield and transportation FLUKA calculations<br />
is better than 30%.<br />
Dose per primary ion / pSv<br />
1<br />
0.1<br />
0.01<br />
1E-3<br />
1E-4<br />
1E-5<br />
1E-6<br />
1E-7<br />
1E-8<br />
1E-9<br />
1E-10<br />
90° full FLUKA<br />
0° LAND<br />
90° BAF 2<br />
0° FLUKA<br />
90° FLUKA<br />
U-238@1GeV/u on 20 cm Fe<br />
0° full FLUKA<br />
0° BaF2<br />
1E-11<br />
0 100 200 300 400 500 600<br />
Depth in concrete / cm<br />
700 800<br />
Figure 3: Resulting neutron dose attenuation data derived<br />
from the spectra of Fig. 2 and the mono-energetic neutron<br />
attenuations from Fig. 1.<br />
References<br />
[1] A. Ferrari, P.R. Sala, A. Fassò, and J. Ranft,<br />
"FLUKA: a multi-particle transport code", CERN<br />
2005-10 (2005), INFN/TC_05/11, SLAC-R-773.<br />
[2] K. Gunzert-Marx, T. Radon, G. Fehrenbacher, F.<br />
Gutermuth, D. Schardt, PoS, Internat. workshop on<br />
fast neutron detection (FNDA2006) 057, p 2, 2006.<br />
[3] O. Yordanov, K. Gunzert-Marx, P. Adrich, T.<br />
Aumann, K. Boretzky, H. Emling, G. Fehrenbacher,<br />
F. Gutermuth, H. Iwase, H. Johannson, K. L. Jones,<br />
A. Kovalov, T. Radon, D. Schardt, Nuclear Instruments<br />
and Methods B 240 (2005) 863.<br />
(2)<br />
289
INSTRUMENTS-METHODS-12 <strong>GSI</strong> SCIENTIFIC REPORT 2009<br />
<strong>GSI</strong>Template2007<br />
290<br />
Atomic and Accelerator Physics in the QUASAR Group*<br />
S.Artikova 2 , R. Boll 1,2 , J. Egberts 2 , J. Gerlach 1,2 , J. Harasimowicz 1,2,6,7 , M. Holzscheiter 2 ,<br />
A. Intermite 1,2,6,7 , A. Jeff 3,6,7 , T. Junginger 2,3 , K.-U. Kühnel 1,2 , A. Papash 1,2,4 , M. Putignano 1,2,6,7 ,<br />
C. Schömers 2,5 , M.R.F. Siggel-King 6,7 , M. Sapinski 3,6,7 , M. Schuh 2,3 , S. Sellner 1,2 , S. Tegami 1,2 ,<br />
G. Wall 6,7 , and C.P. Welsch 6,7,#<br />
1 <strong>GSI</strong>, Darmstadt, Germany; 2 Max Planck Institute for Nuclear Physics, Heidelberg, Germany;<br />
3 CERN, Geneva, Switzerland; 4 JINR, Dubna, Russia; 5 HIT, Heidelberg, Germany; 6 Cockcroft Institute,<br />
Warrington, UK; 7 University of Liverpool, Liverpool, UK<br />
The QUASAR group combines developments in accelerator<br />
sciences with measurements on quantum systems,<br />
with a particular interest in antimatter research. The group<br />
focuses on the development of the key elements of a future<br />
ultra-low energy storage ring at the facility for low<br />
energy antiproton and ion research.<br />
Since its start in 2008 the group substantially broadened<br />
its R&D program, has been collaborating with HIT<br />
and CERN on medical accelerators, is pursuing research<br />
into superconducting linacs, and is developing beam instrumentation<br />
for high energy accelerators.<br />
THE USR<br />
The Facility for Antiproton and Ion Research (FAIR) at<br />
<strong>GSI</strong> will include a dedicated facility for research with low<br />
energy antiprotons in the keV regime or even at rest,<br />
named FLAIR [1]. The deceleration of antiprotons to a<br />
final energy of 20 keV (and even down to 1 keV) will be<br />
realized in a dedicated electrostatic Ultra low energy<br />
Storage Ring (USR) [2].<br />
The use of electrostatic elements has the significant advantage<br />
that, as compared to their magnetic counterparts,<br />
high field homogeneity in combination with a fast ramping<br />
of the fields over a wide range is possible. In addition,<br />
remanence and hysteresis effects do not occur in electrostatic<br />
elements. As the ring aims to be a multi-user facility,<br />
high luminosity, low emittance and low momentum<br />
spread of the beam together with a flexible beam shape<br />
are required. External experiments for precision studies,<br />
for example trap experiments, will form an integral part<br />
of FLAIR and the USR will provide fast and slow extraction,<br />
for the first time in an electrostatic storage ring.<br />
In order to match the requirements from the envisaged<br />
experiments, different modes of operation are foreseen<br />
for the USR: deceleration and e-cooling, fast and<br />
slow extraction [3] and an ultra-short bunch mode for inring<br />
experiments as developed by the group in 2008 [4].<br />
This allows for an optimization of the beam shape, size<br />
and dispersion for the respective experiment.<br />
Split-Achromat Lattice<br />
The modified layout of the USR Lattice is based on a<br />
split–achromat geometry which gives the necessary flexibility<br />
to satisfy the wide range of experimental requirements.<br />
* Work supported by <strong>GSI</strong>/HGF under contract VH-NG-328, EU contracts<br />
PITN-GA-2008-215080, PIIF-GA-2009-234814, and the Gentner<br />
program.<br />
# carsten.welsch@quasar-group.org<br />
Fig.1 shows the new layout of the storage ring, which<br />
now has a circumference of 42.6 m, i.e. almost unaltered<br />
geometrical dimensions as compared to [2]. Four 4 m<br />
long straight sections are used to accommodate the socalled<br />
Reaction Microscope (ReMi), the different RF systems<br />
for the short bunch operation mode [4,5], the electron<br />
cooler, the decelerating drift tube, and the elements<br />
for fast/slow extraction [3]. One of the straight sections is<br />
kept free for a possible inclusion of a merged positron<br />
ring, see [1]. Five electrostatic quadrupoles, two 8 ο and<br />
two 37 ο electrostatic deflectors form an achromatic 90 ο<br />
bend. A drift space of 1 m between the 8 ο and the 37 ο deflectors<br />
is left to allow for the detection of neutral particles<br />
leaving the ring after the ReMi under an opening<br />
angle of ±0.7 ο .<br />
Figure 1: Overview of the USR layout.<br />
The quadrupole QF1 in the middle of each bending section<br />
is used to provide both a round beam mode for collision<br />
experiments as well as achromatic conditions<br />
D=D’=0, if required. The dispersion function can be<br />
modified in a wide range from +60 cm down to values of<br />
–50 cm. The geometrical parameters of the electrostatic<br />
deflectors (central radius and distance between electrodes)<br />
and electrostatic quadrupoles (effective length and<br />
inscribed aperture) were defined by taking into account<br />
the possibility to extract neutral particles after the ReMi,<br />
to operate with a beam with a normalized 4rms emittance
<strong>GSI</strong> SCIENTIFIC REPORT 2009 INSTRUMENTS-METHODS-12<br />
as large as 1–2π mm⋅mrad and an upper voltage limit of<br />
±20 kV on the deflectors and ±10 kV on the quadrupole<br />
electrodes.<br />
Fringe fields near the ends of electrostatic elements can<br />
have negative effects on the stored beam and even lead to<br />
unwanted coupling effects between different optical elements<br />
[6]. Therefore grounded shields are foreseen at the<br />
entrance and exit regions of all deflectors, the quadrupoles,<br />
and between two individual elements of a quadrupole<br />
doublet. The 8° cylinder deflectors have a central<br />
bending radius of 2 m, a plate distance of 120 mm, and<br />
maximum voltages of ±18 kV. The main 37° deflection is<br />
realized by a deflector with a central radius of 1 m, a gap<br />
of 60 mm, and maximum voltages of ±18 kV.<br />
The aperture radius of the electrostatic quadrupoles is<br />
100 mm and their effective length 200 mm. The voltages<br />
that are required on the three quadrupoles to focus a 300<br />
keV antiproton beam are U1=-6.1 kV, U2=+4.4 kV, and<br />
U3=+6.35 kV.<br />
Beam Extraction<br />
Extensive computer simulations of the extracted beam<br />
were undertaken using the codes MAD-X, OPERA3D<br />
and SIMION, based on preliminary studies [3]. All design<br />
parameters were reviewed during the optimization process.<br />
Elements for fast and slow extraction are co-located<br />
in one of the USR's straight sections. Two electrostatic<br />
sextupoles and an RF “knock out” cavity, which will excite<br />
radial beam oscillations, are located in another ring<br />
section. Four bump electrodes will be used to shift the<br />
orbit towards an electrostatic septum that is tilted to the<br />
axis by 6 ο . This combined extraction scheme will provide<br />
beams with most different time structures, through one<br />
common extraction line, to external low energy experiments.<br />
Presently, these results are being combined with studies<br />
on the effects of space charge and fringe fields on the<br />
dynamic aperture of the USR. This will give rise to an<br />
improved understanding of the beam dynamics of electrostatic<br />
rings and help optimizing their performance.<br />
Beam Instrumentation<br />
A wide range of diagnostic devices has been investigated<br />
for the USR. These will be used for different stages<br />
of machine development and most of them can be used<br />
for monitoring more than one beam parameter. A compact<br />
Faraday Cup was designed and built; it will be used for<br />
tests with low intensity beams early in 2010 [7]. An electrostatic<br />
pick-up for the non-destructive measurement of<br />
the beam position was developed and is presently being<br />
manufactured. And in close collaboration with INFN-<br />
LNF, measurements were carried out on the characteristics<br />
of scintillating screens at very low beam energies and<br />
intensities. These studies will not only provide the basis<br />
for beam profile measurements in the USR, but in all low<br />
energy beam lines at FLAIR.<br />
An alternative approach to measure the transverse beam<br />
profile in an almost non-destructive way is to use a neutral<br />
curtain-shaped supersonic gas jet target. This ap-<br />
proach is more sensitive than those based on residual gas<br />
because the higher gas density in the curtain increases the<br />
ionisation rate. The atoms or molecules in the supersonic<br />
jet can be efficiently evacuated, due to the high directionality<br />
of the particles in the jet, in order to keep the required<br />
ultra high vacuum elsewhere in the storage ring.<br />
Numerical studies were undertaken with GDT to improve<br />
on the understanding of the gas jet dynamics [8]. Based<br />
on these studies, the mechanical design of the monitor<br />
was finalized [9] and most components have been ordered.<br />
The system will be setup early in 2010 with first<br />
test anticipated in the summer.<br />
MEDICAL ACCELERATORS<br />
The use of particle accelerators for medical applications<br />
has become increasingly important with dedicated facilities<br />
being built up around the world. In close collaboration<br />
with the Heidelberg Ion Therapy centre (HIT), the<br />
group contributed to the design of a novel magnet-current<br />
based beam extraction system for medical synchrotrons<br />
[10]. This included the installation of a magnet test stand<br />
and detailed investigations into the characteristics of<br />
commercial hall probes [11].<br />
Since summer 2009 the group has been carrying out<br />
studies on the biological effects of antiprotons. Measurements<br />
were made at CERN in September and are being<br />
analyzed. Whilst this research is presently based at<br />
CERN, it is an integral part of the FLAIR experimental<br />
program and thus directly builds up on the group's USR<br />
activities.<br />
SUPERCONDUCTING LINACS<br />
The QUASAR group is contributing to an international<br />
effort in optimizing superconducting cavities for future<br />
high current accelerators. This technology has been successfully<br />
exploited in large scale accelerator projects,<br />
such as CERN-LEP, JLAB-CEBAF, and ONL-SNS. In<br />
addition, it was selected for future projects such as<br />
DESY-XFEL, HIE-ISOLDE and studies, such as the<br />
CERN-SPL, which will push the limits of this technology<br />
even further.<br />
In close collaboration with CERN, the effects of higher<br />
order modes (HOMs) on the SPL particle beam were studied<br />
and upper limits for the damping requirements were<br />
defined: Even when using ten times the design current,<br />
simulation results in the transverse plane showed that a<br />
Qex of 10 6 - 10 7 is acceptable [12]. Future studies will now<br />
concentrate on analysing the effects of chopping on the<br />
longitudinal plane and of alignment errors in both planes.<br />
To perform RF measurements on superconducting samples,<br />
a Quadrupole Resonator at CERN was successfully<br />
refurbished with the aim to characterize new materials for<br />
high gradient cavities. In first measurements at 400 MHz,<br />
the surface resistance for temperatures down to 5 K and<br />
the maximum RF field on the attached sample were determined.<br />
For a second series of measurements shielding<br />
of the ambient magnetic field and pumping of the helium<br />
bath was applied, allowing measurements at temperatures<br />
291
INSTRUMENTS-METHODS-12 <strong>GSI</strong> SCIENTIFIC REPORT 2009<br />
292<br />
down to 3.3 K. The penetration depth and the thermal<br />
conductivity of the attached sample were measured [13].<br />
BEAM INSTRUMENTATION FOR HIGH<br />
ENERGY ACCELERATORS<br />
The detection and possible control of the beam halo is<br />
of utmost importance for high energy accelerators, where<br />
unwanted particle losses lead to an activation or even<br />
damage of the surrounding vacuum chamber. Additionally,<br />
low energy machines such as the USR, are concerned<br />
in minimizing the number of particles in the tail region of<br />
the beam distribution. One option for monitoring the<br />
beam halo is to use light generated by the beam, either<br />
through synchrotron radiation, optical transition radiation,<br />
or luminescent screens. In this case, a special detection<br />
technique is required to allow for high dynamic range<br />
measurements. A CID camera, characterized in lab experiments,<br />
was shown to have a very high dynamic range<br />
of more than 10 7 [14]. In addition, a flexible "core masking<br />
technique" proved to be a reliable and comparably<br />
cheap method for measurements with a dynamic range of<br />
up to 10 6 [15]; this technique is presently being applied at<br />
UMER for studies with beam.<br />
In addition, the group carried out characterization studies<br />
of Si-PMTs for use as beam loss monitors in combination<br />
with optical fibres and started work on the design of a<br />
longitudinal beam profile monitor for the LHC.<br />
DITANET<br />
The Marie Curie Initial Training Network DITANET<br />
covers the development of advanced beam diagnostic<br />
methods for a wide range of existing or future accelerators,<br />
utilising electrons or ions. It is the largest-ever EU<br />
funded training network in this field and brings together<br />
research centres such as <strong>GSI</strong>, CERN and DESY, universities,<br />
and private companies. It was initiated and is coordinated<br />
by the QUASAR group leader. Most positions<br />
within the network were filled in 2009 and the respective<br />
research projects started successfully.<br />
An international school on Beam Diagnostics was organized<br />
at Royal Holloway, University of London between<br />
30/03/09-03/04/09. The School, combined with the<br />
first DITANET annual meeting, brought together over 70<br />
researchers. It started with an introduction to accelerator<br />
physics and the definition of particle beams, and then<br />
covered instrumentation for basic beam measurements,<br />
such as beam energy, beam current and transverse beam<br />
profile. Later in the week more advanced topics, e.g. the<br />
monitoring of the machine tune or electron cloud diagnostics<br />
were presented. A particular highlight of the school<br />
was a dedicated industry session where lecturers from<br />
associated partners Thermo Fisher Scientific, TMD,<br />
Thales, ViALUX, and Instrumentation Technologies gave<br />
insight into their cutting edge R&D activities.<br />
A topical workshop was held in<br />
Hirschberg/Großsachsen on November 23 rd - 25 th on Low<br />
Energy, low intensity diagnostics. A particular focus was<br />
the instrumentation requirements of FAIR with discussion<br />
of state-of-the-art beam diagnostics used at storage ring<br />
and cyclotron facilities around the world.<br />
ACKNOWLEDGEMENTS<br />
The QUASAR Group is grateful for the fruitful collaboration<br />
with our partners at CERN (E. Bravin, B.<br />
Dehning, F. Gerigk, T. Lefèvre, W. Weingarten), HIT<br />
(E. Feldmeier, A. Peters, R. Steiner), INFN-LNF<br />
(L. Cosentino, P. Finocchiaro, A. Pappalardo), Thermo<br />
Fisher (T. Chapman, M. Pilon), U Maryland (R. Fiorito,<br />
R. Kishek), and our colleagues at the Cockcroft Institute.<br />
The generous support of the Helmholtz Association of<br />
National Research Centres (HGF) under contract number<br />
VH-NG-328 and of the <strong>GSI</strong> Helmholtz Centre for Heavy<br />
Ion Research GmbH is acknowledged, as well as the support<br />
by the EU under contracts PITN-GA-2008-215080<br />
and PIIF-GA-2009-234814. Finally, the authors would<br />
like to thank the MPI-K for hosting the QUASAR group.<br />
REFERENCES<br />
[1] C.P. Welsch, et al., ”An ultra-low-energy storage ring at<br />
FLAIR”. Nucl. Instr. and Meth. A 546 (2005) 405–417<br />
[2] C.P. Welsch, et al., "Present status of the USR Project",<br />
Hyperfine Interact. 194 1-3 p. 137-143 (2009)<br />
[3] P. Schmid, et al., "Preliminary Design of an Extraction<br />
Scheme for the USR", Hyperfine Interact. 194 1-3 p. 183-<br />
187 (2009)<br />
[4] A.I. Papash, C.P. Welsch, “On the Possibility of Realizing<br />
Shortest Bunches in Low-Energy Storage Rings”. Physics<br />
of Particles and Nuclei Letters, Vol. 6, No. 3 (2009)<br />
[5] A. Papash, C.P. Welsch, "An Update of the USR Lattice:<br />
Towards a True Multi-User Experimental Facility", Proc.<br />
Part. Acc. Conf., Vancouver, Canada (2009)<br />
[6] C.P. Welsch et al., ”An Electrostatic Quadrupole Doublet<br />
with an Integrated Steerer”, Proc. EPAC, Lucerne, Switzerland<br />
(2004)<br />
[7] J. Harasimowicz, et al., "Beam Diagnostics for the USR",<br />
Proc. Part. Acc. Conf., Vancouver, Canada (2009)<br />
[8] M. Putignano, et al., "Design of a Nozzle-Skimmer System<br />
for a Low Perturbation Ionization Beam Profile Monitor",<br />
Proc. DIPAC Workshop, Basel, Switzerland (2009)<br />
[9] M. Putignano, et al., "A fast, low perturbation ionization<br />
beam profile monitor based on a gas-jet curtain for the ultra<br />
low energy storage ring ", Hyperfine Interact. 194 1-3 p.<br />
189-193 (2009)<br />
[10] A. Peters, et al., "Magnetic Field Control in Synchrotrons",<br />
Proc. Part. Acc. Conf., Vancouver, Canada (2009)<br />
[11] C. Schömers, "Investigations into the magnetic field control<br />
in normal-conducting synchrotrons", Diploma Thesis,<br />
Heidelberg (2009)<br />
[12] M. Schuh, et al., "Higher Order Mode beam break up limits<br />
in the Superconducting Cavities of the SPL", Proc. SRF<br />
Workshop, Berlin (2009)<br />
[13] T. Junginger, et al., "RF Characterization of Superconducting<br />
Samples", Proc. SRF Workshop, Berlin (2009)<br />
[14] J. Egberts, et al., "Flexible Core Masking Technique for<br />
Beam Halo Measurements with High Dynamic Range",<br />
Proc. DIPAC Workshop, Basel, Switzerland (2009)<br />
[15] J. Egberts, "Investigations on transverse beam profile<br />
measurements with high dynamic range", Diploma Thesis,<br />
Heidelberg (2009)
<strong>GSI</strong> SCIENTIFIC REPORT 2009 INSTRUMENTS-METHODS-13<br />
Single Event Effect Studies on the 180 nm UMC process<br />
with the <strong>GSI</strong> Heavy Ion Microprobe<br />
S. Löchner ∗1 , B.E. Fischer 2 , B. Merk 2 , and K.-O. Voss 2<br />
1 <strong>GSI</strong> Darmstadt, Experiment Electronics; 2 <strong>GSI</strong> Darmstadt, Material Research<br />
Introduction<br />
For the future experiments at the new FAIR accelerator<br />
facility radiation damages to electronic components are an<br />
important issue. In this regard, the ASIC design group of<br />
the <strong>GSI</strong> Experiment Electronics department has launched<br />
a research project for the characterisation of Single Event<br />
Effects (SEE) on the 180 nm UMC process, including the<br />
development of an ASIC called GRISU[1].<br />
SEE is the term for effects in semiconductor devices<br />
triggered by a single ionising particle in contrast to effects<br />
triggered by a damage accumulated by many particles.<br />
A good choice to test these effects is the irradiation with<br />
heavy ions. Several irradiation tests with different heavy<br />
ions were performed at the X6 testing site. The beam was<br />
widened so that the entire GRISU chip has been irradiated<br />
at the same time[1].<br />
First results showed that some digital storage cells were<br />
more sensitive to SEU than expected from simulation. To<br />
clarify and understand this unexpected high sensitivity the<br />
GRISU chip was irradiated with the sub-micron resolution<br />
beam of the heavy ion microprobe at the X0 testing site.<br />
Single Event Effect Studies with a Single<br />
Heavy Ion Hit Microprobe<br />
Briefly, the microbeam is situated at the end of the <strong>GSI</strong><br />
heavy ion linear accelerator. The ions entering the microbeam<br />
line through object slits are focused down to a focal<br />
spot of about 500 nm in diameter by means of magnetic<br />
quadrupole lenses. Deflecting magnets, situated in front of<br />
the focusing lenses, are used to move the beam spot in the<br />
focal plane[2].<br />
In May 2009 a GRISU chip was irradiated with a carbon<br />
microbeam with an energy of 4.8 MeV/u. This corresponds<br />
to a Linear Energy Transfer (LET) of approximately<br />
2.25 MeV cm 2 mg −1 . In total five different test structure<br />
areas were irradiated. The ASIC has been scanned over<br />
80 × 80 µm 2 for the first three SEE tests and 20 × 20 µm 2<br />
for the last two tests.<br />
As an example of these test results an inverter chain of<br />
different transistor sizes is depicted. The layout overlay<br />
picture of the irradiated area and the observed Single Event<br />
Transient (SET) events are shown in Fig. 1. Each red circle<br />
represents a SET event. The circle centre points to the<br />
measured origin by the microbeam DAQ system whereas<br />
the radius represents the 3σ position accuracy of 612 nm.<br />
For inverter chain no. 4 and 5 SET events were measured<br />
∗ s.loechner@gsi.de<br />
7:<br />
7:<br />
6:<br />
5:<br />
4:<br />
10um<br />
Figure 1: Overlay of inverter chain test structure layout and<br />
position of SET events. The radius of the circle is equivalent<br />
to 3σ position accuracy or approx. 600 nm.<br />
for NMOS transistors (lower layout part in each row) as<br />
well as for PMOS transistors (upper layout part). However<br />
for inverter chain no. 6 and 7 SET hits were only measured<br />
for NMOS transistors. The explanation for this is<br />
that the node capacitances of these PMOS transistors are<br />
larger compared to the smaller NMOS.<br />
Results<br />
The first measurement showed that the microbeam setup<br />
is a powerful tool for spatially resolving SEE investigations.<br />
However the number of events for a closer statistical<br />
analysis as well as the resolution must be increased for<br />
closer investigations of the 180 nm process, especially for<br />
the study of some special memory structures on the GRISU<br />
chip.<br />
References<br />
[1] S. Löchner, ”Radiation Studies on the UMC 180 nm CMOS<br />
Process”, <strong>GSI</strong> Scientific Report 2009<br />
[2] B.E. Fischer, ”The Scanning Heavy Ion Microscope at <strong>GSI</strong>”,<br />
Nuclear Instruments and Methods in Physics Research, Section<br />
B, 10-11, 693-696 (1985)<br />
293
<strong>GSI</strong>Template2007<br />
Diamondsurfacesinvestigatedbyatomicforcemicroscopy*<br />
S.Wetzel#,R.Lovrincic,andA.Pucci<br />
KirchhoffInstitut<strong>für</strong>Physik,UniversitätHeidelberg,Germany<br />
Thesurfaceroughnessofsinglecrystaldiamondspro�<br />
ducedbychemicalvapourdeposition(CVD)ondiamond�<br />
seedsubstratesandtreatedwithdifferentsurfacepolish�<br />
ingtechniques,suchasion�beampolishingandresin�<br />
wheel�polishingwasstudiedbyatomicforcemicroscopy<br />
(AFM).Knowledgeonsurfaceroughnessisimportantfor<br />
theproductionofsingle�crystaldiamonddetectors,since<br />
thequalityofmetalliccontactsonthediamonddepends<br />
onitsignificantly.Differenttosiliconwafers,theproduc�<br />
tionofdiamondwaferswiththesamecrystallinequality<br />
inthebulkandespeciallyonthesurfaceisstillimpossible<br />
becauseoftheveryspecialdiamond�growthprocessand<br />
thehighchallengesinpolishingdiamond.Theproduction<br />
processofsingle�crystalCVDdiamonds(scCVDD)and<br />
especiallydifferentsurfacefinishingtechniquesarestill<br />
underdevelopment[1].Thismakesitnecessarytocharac�<br />
terizethediamondsconcerningtheirsurfaceroughness<br />
beforeanylayerdepositionforresearchpurposes.AFM<br />
measurementsareparticularlysuitedtoprobethesurface<br />
morphologyofinsulatingsamples.Heresomeexamples<br />
areshown;forotherexamplesandvariousdetailsseeRef.<br />
[1,2].Inourpreviousstudiesonthegrowthofchromium<br />
andaluminumonscCVDD(C(100))[1,3,4,5]thedia�<br />
mond�surfacequalitywascarefullycheckedbeforefur�<br />
thercleaningsteps(tocontrolsurfacelayers)andmetal<br />
deposition.Wealwaysusedthebestavailablesubstrates.<br />
TheAFMmeasurementswereperformedwithaMulti�<br />
modescanningprobemicroscope(VeecoSPM)intap�<br />
ping�mode.Imageswererecordedwithasizeof(4�4)<br />
�m2andaresolutionof512�512pointsatdifferentposi�<br />
tionsoneachsideofthewafer.Forfurtherillustrationof<br />
obtaineddata,theselectionofdetails,androughness<br />
analysis,thefreesoftwareGwyddion[6]wasused.The<br />
samplesofthisarticlehadbeenproducedbyDiamond<br />
DetectorsLtd..<br />
TheAFMimagesofFig.1showthetypicaldefectsof<br />
polishedsurfaces.Thetwoimagesweretakenonthefront<br />
andonthebackside,respectively,ofascCVDdiamond<br />
slabwithathicknessof500�m.Incontrasttothefront<br />
sidethatshowsarathersmoothsurfacetypicalforion�<br />
beampolishing[2],onthebacksidemanydefectsand<br />
scratchescanbeseen.Itshouldbementionedthatthetwo<br />
sideshaveadifferenthistory.Onesideresultsfromlaser<br />
cuttingfromtheseed,theothersidefromtheas�grown<br />
surface.FromtheAFMdataaRMSroughnessof1.4nm<br />
and3.1nmforthefrontandforthebackside,respec�<br />
tively,follows,proofingtheclearlydifferentroughnessof<br />
thetwosurfaces,whichisamajorproblemindevicefab�<br />
ricationwithtwoequivalentmetalelectrodes.<br />
Theauthorsgratefullyacknowledgethefruitfulcoop�<br />
erationwithEleniBerdermannandthankElementSixand<br />
DiamondDetectorsLtd.fortheexcellentdiamondmate�<br />
rialstheyhaveprovided.<br />
Figure1:(3�3)�m2imagesfroma500�mthick<br />
scCVDDareshown,onefromthefrontside(top)anda<br />
secondonefromthebackside(bottom).Heightscaleis<br />
givenontherightofeachpicture.Scanninginhorizontal<br />
direction.<br />
*WorksupportedbyEU,projectRII3�CT�2004�<br />
506078andRII3�CT�653227431.<br />
#swetzel@kip.uni�heidelberg.de<br />
[1]R.Lovrincic,thesis,Ruprecht�Karls�UniversitätHei�<br />
delberg2009.<br />
[2]E.Berdermann,etal.,Diamond&RelatedMaterials<br />
(2009),inpress.<br />
[3]R.LovrincicandA.Pucci,Phys.Rev.B80(2009)<br />
205404.<br />
[4]R.LovrincicandA.Pucci,<strong>GSI</strong>ScientificReport<br />
2007,p.207.<br />
[5]R.Lovrincic,S.Noebel,andA.Pucci,<strong>GSI</strong>Scientific<br />
Report2008,p.248.<br />
[6]Gwyddion�FreeSPM dataanalysissoftware<br />
www.gwyddion.net<br />
INSTRUMENTS-METHODS-14 <strong>GSI</strong> SCIENTIFIC REPORT 2009<br />
294
<strong>GSI</strong> SCIENTIFIC REPORT 2009 INSTRUMENTS-METHODS-15<br />
<strong>GSI</strong>Template2007<br />
First Results of CVD-Diamond Detectors Grown on Large Iridium Substrates*<br />
E. Berdermann 1 , M. Ciobanu 1 , S. Dunst 2 , M. S. Rahman 1 , M. Schreck 2 , and M. Träger 1<br />
1 <strong>GSI</strong>, Darmstadt, Germany, 2 Universität Augsburg, Germany<br />
A promising course for large-area ‘quasi’ single-crystal<br />
CVD diamond (scCVDD) is the heteroepitaxial growth on<br />
the multilayer structure Ir/YSZ/Si(001) [1] - as developed<br />
at the University of Augsburg on 4inch wafers. Key issue<br />
is the similarity of the lattice constants of diamond (dDia =<br />
3.567 Å) and Iridium (dIr = 3.834 Å).<br />
Figure 1 shows characterization results of two Diamond-on-Iridium<br />
(DoI) samples compared to commercial<br />
scCVDD and polycrystalline CVD-diamond (pcCVDD)<br />
detectors [2]. DoI549a (top- and central-right data) is a<br />
polished freestanding film of 230μm thickness, where a<br />
30µm layer has been removed from the nucleation side.<br />
The thickness of DoI724b (bottom left and right data) was<br />
optimized for Transient-Current Technique (TCT) measurements<br />
with 241 Am-α-particles: an iridium mesh was<br />
added in the depth of the α-range providing dD ≈ 12μm.<br />
Figure 1: Characteristics of early DoI samples compared<br />
to scCVDD and pcCVDD: (top) Idark(ED) curves; (central)<br />
TCT for internal ED profile, charge-drift, and trapping;<br />
(bottom-left) Charge-Collection Efficiency (CCE) vs. ED;<br />
(bottom-right) Collected Charge distributions.<br />
The unexpected low dark current of DoI films is discussed<br />
in the next section. The triangular TCT signals<br />
(Fig. 1, central-right) demonstrate significant trapping of<br />
the excess charge in the vicinity of generation. The charge<br />
*Supported by EC: Projects HadronPhysics2 and MC-PAD.<br />
losses are due to the high dislocation density of present<br />
DoI CVDD [2]. In contrast, the trapezoidal signals of defect<br />
free scCVDD samples (Fig. 1, central-left) confirm a<br />
homogeneous internal field and full drift of the ionized<br />
charge to the opposite electrode. The CCE ≈ 0.4 measured<br />
for DoI724b (Fig.1 bottom-left) is presently as high as of<br />
‘as grown’ (AG) pcCVDD. However, the energy resolution<br />
(Fig.1, bottom right) is significantly better, even<br />
compared with ‘detector grade’ (DG) pcCVDD, confirming<br />
homogeneously distributed dislocations. The amplitudes<br />
of the TC signals are similar to those of best<br />
scCVDD sensors (Fig.1, central-right and left plots). Excellent<br />
heavy-ion timing at ion rates >> 10 9 ions/s is expected<br />
by minimizing detector and stray capacitances.<br />
Electrical Conduction<br />
We studied the dark current behaviour of DoI549a in<br />
the electric field range - 4.3 ≤ ED [V/μm] ≤ 4.3 at temperatures<br />
from 300 K to 673 K. Two types of sandwich<br />
electrodes were tested (in vacuum): a) both sides ohmic<br />
(i.e. Ti-Pt-Au metallization); b) one side <strong>block</strong>ing (pure<br />
Al), second one same as a). As in previous studies of<br />
scCVDD [3] we found the IV characteristics of DoI films<br />
up to T = 400 0 C independent of the contact metal. However,<br />
the high activation energy of 1.53 eV extracted from<br />
Arrhenius plots suggests minor contribution of the bulk<br />
defects to the dark current and points to an ‘interfacecontrolled’<br />
conduction mechanism. We applied dedicated<br />
fitting to the data, due to which eventually pure field<br />
emission (Fowler-Nordheim) or pure trapping-detrapping<br />
(Poole-Frenkel) conduction could be excluded, while a<br />
mixing of various processes appears most likely, with<br />
Schottky Emission the dominant mechanism at temperatures<br />
472 K - 672 K and fields ED >1 V/µm. Similar barrier<br />
heights Φb ≈ (1.72 ± 0.01) eV have been estimated for<br />
both electrode types. The studies are ongoing.<br />
Figure 2: ID(UD) at high temperatures. a) solid symbols:<br />
ohmic/ohmic b) open symbols: ohmic/<strong>block</strong>ing contacts.<br />
References<br />
[1] S. Gsell et al., Appl. Phys. Lett. 84 (2004) 4541<br />
[2] E. Berdermann et al, Diam. Relat. Mater. (2009),<br />
doi:10.1016/j.diamond.2009.11.019<br />
[3] M. Pomorski, PhD thesis, Univ. of Frankfurt (2008)<br />
295
INSTRUMENTS-METHODS-16 <strong>GSI</strong> SCIENTIFIC REPORT 2009<br />
An RFQ Cooler – Mass Filter – Buncher System for Experiments with<br />
Fusion-Evaporation Products ∗<br />
E. Haettner 1,2 , U. Czok 1 , T. Dickel 1 , H. Geissel 1,2 , W. Kinsel 1,2 , F. Lautenschläger 1 , M. Petrick 1 ,<br />
W. R. Plaß 1,2 , T. Schäfer 1 , C. Scheidenberger 1,2 , R. Thöt 1 , and J. Werner 1<br />
1 2 Justus-Liebig-Universität Gießen, Germany; <strong>GSI</strong>, Darmstadt, Germany �<br />
��� �����<br />
Figure 1: Photo of the RFQ cooler – mass filter – buncher<br />
system. The gas pressures (He) are chosen such that buffer<br />
gas cooling is effective in the RFQ cooler and the buncher,<br />
but that the performance of the mass filter is not compromised.<br />
At the Penning trap facility SHIPTRAP mass measurements<br />
of transfermium elements as well as nuclides in the<br />
vicinity of the proton drip-line have been performed [1, 2].<br />
Going towards even more exotic proton-rich elements, the<br />
SHIPTRAP experiment is hampered by the abundant unwanted<br />
reaction products. In order to quickly identify the<br />
ions produced, to select the nuclei of interest out of all fusion<br />
products and to increase the sensitivity of the experiment,<br />
an RFQ mass filter has been developed in a matched<br />
combination with an RFQ cooler and RFQ buncher.<br />
Instrumental developments. The RFQ cooler, mass filter<br />
and buncher have been designed [3, 4] and built, see<br />
figure 1. The mass filter is constructed out of round rods<br />
with a diameter of 18 mm and uses Brubaker lenses [5] at<br />
its entrance and exit. Special care has been taken to assure<br />
that the cooler and mass filter have the best possible<br />
alignment, in order to avoid a degradation in resolution and<br />
transmission. A control system for operation of the mass<br />
filter at a fixed working point (mass selection), in 1D scanning<br />
mode (acquisition of mass spectrum) or 2D scanning<br />
mode (mapping of stability diagram) has been developed.<br />
The RF voltages are generated by high-quality resonance<br />
circuits. Since the RF amplitude is easily affected by e.g.<br />
temperature changes and the stability of RF amplitude has<br />
a direct impact on the achievable resolution and transmission,<br />
an effort has been made to stabilize the RF voltages<br />
to the 0.1 % level. Electronic circuits for precise measurement<br />
of the RF amplitude has been developed, and a PID<br />
controller has been implemented to the control program.<br />
The RFQ buncher consists of a 40 cm cooling section,<br />
in which the axial field is created by additional DC rods<br />
[6], and a trapping section consisting of 5 segments. These<br />
allow the user to increase the efficiency by implementing a<br />
pretrap.<br />
296<br />
∗ Work supported by the BMBF under contract No. 06GI185I.<br />
������<br />
����<br />
���<br />
��<br />
�� �<br />
�<br />
�� �� �� �� ��<br />
��������<br />
�� �<br />
Figure 2: Separation of 39−41 K isotopes in the mass filter.<br />
The different intensities correspond to the natural abundances<br />
of the isotopes.<br />
Experimental results. The cooling properties of the<br />
RFQ cooler have been investigated and found to be in<br />
agreement with theory. An longitudinal energy spread of<br />
less than 0.2 eV can be obtained.<br />
The mass resolution of the mass filter as a function of<br />
transmission has been measured and the stability diagram<br />
of the mass filter has been mapped. A mass resolving<br />
power (FWHM) of 60 with 90 % transmission and a resolving<br />
power of 150 at a transmission of 65 % have been<br />
reached for the cooler – mass filter – combination. The separation<br />
and supression of neighboring masses was investigated<br />
using a potassium ion source. A supression of neighboring<br />
mass lines by a factor of 10 4 was demonstrated, see<br />
figure 2.<br />
Outlook. The commissioning of the complete RFQ system<br />
is scheduled for the first half of 2010. The system<br />
will extend the reach of SHIPTRAP to very proton-rich nuclides<br />
such as the N=Z nuclides 80 Zr and 84 Mo, which can<br />
be produced at SHIP with sufficient rates but so far cannot<br />
be separated effectively from other more abundant reaction<br />
products.<br />
References<br />
[1] C. Rauth et al., Phys. Rev. Lett., 100, 012501 (2008).<br />
[2] M. Block et al., Nature, in print (2010).<br />
�<br />
[3] E. Haettner et al., <strong>GSI</strong> Scientific Report 2007 (2008) 210.<br />
[4] J. Werner, Bachelor Thesis, JLU Gießen, 2008.<br />
[5] W.M. Brubaker, Adv. in Mass Spectrom., 4 (1968) 293.<br />
[6] A. Loboda et al., Eur. J. Mass Spectrom. 6 (2000) 531.
<strong>GSI</strong> SCIENTIFIC REPORT 2009 INSTRUMENTS-METHODS-17<br />
Ion-Optical Studies for an ESR In-Ring Spectrometer Mode<br />
C. Brandau ∗1,2 , Th. Faestermann 1 , R. Krücken 1 , P. Egelhof 2 , H. Geissel 2,3 , R. Gernhäuser 1 ,<br />
N. Kalantar-Nayestanaki 4 , S.A. Litvinov 2 , L. Maier 1 , Ch. Scheidenberger 2,3 , M. Steck 2 , H. Weick 2 ,<br />
and the EXL collaboration<br />
1 TU München; 2 <strong>GSI</strong> Darmstadt; 3 Universität Gießen; 4 KVI Groningen, Netherlands<br />
Complementary to classical single-pass arrangements<br />
the use of storage rings for nuclear reaction studies offers<br />
some decisive advantages [1]. The circulating ions<br />
repeatedly interact with the target atoms at a high frequency<br />
(1-3 MHz) and thus provide a reasonable luminosity<br />
even at small numbers of projectile ions and/or low<br />
target densities. The stored ion beam is electron cooled,<br />
possesses very small emittances and a well-defined sharp<br />
initial momentum,—ideal prerequisites for high-resolution<br />
particle spectroscopy. It is thus appealing to utilize the storage<br />
ring bending dipoles as a magnetic spectrometer in order<br />
to identify recoil nuclei and to measure their momentum<br />
distributions. An optimal momentum resolution can be<br />
achieved if either an ion optical image between the reaction<br />
volume (internal target) and the detector position behind<br />
the first dipole exists or if the reaction products are tracked<br />
one-by-one on their flight path. The two approaches can be<br />
used exclusively but ideally they are applied complementarily<br />
to each other. We have investigated both possibilities<br />
for the present ESR, i.e., development of a new ion<br />
optical setting (“spectrometer mode”) as well as the design<br />
of a tracking system that can be operated under the<br />
strict UHV vacuum conditions and that is non-destructive<br />
for the circulating primary beam. Ideally, such a detector<br />
consists of as little material as possible in order to minimize<br />
straggling. This excludes the use of standard vacuum<br />
pockets with entrance and exit windows. We therefore are<br />
considering a thin-foil detector, where secondary electrons<br />
are guided with the aid of a longitudinal magnetic field towards<br />
a micro channel plate. The arrangement is similar to<br />
the one described in [2] but with the B-field provided by a<br />
set of Helmholtz coils located outside the vacuum.<br />
In the following we discuss the possibility of a new ion<br />
optical setting for the ESR in more detail. The task to calculate<br />
such a new mode is challenging since the ESR has<br />
never been designed under the premise of the use as a momentum<br />
spectrometer. Type and position of the ion optical<br />
elements and detector pockets are pre-determined and<br />
cannot be changed. At the same time, a circular accelerator<br />
such as a storage ring requires a multitude of boundary conditions<br />
with respect to injection and stable orbiting of the<br />
beam to be fulfilled [3]. Figure 1 presents horizontal and<br />
vertical plane of one quarter of the ESR for a potential spectrometer<br />
mode candidate. Ion trajectories starting at the internal<br />
gas-jet target are displayed that indicate the image<br />
from jet to detector. Reaction products in a cone of ±15<br />
∗ C.B. acknowledges support by <strong>GSI</strong> Darmstadt (F&E) under contract<br />
number TM/KRUE.<br />
horizontal (x): δp/p = +/- 1 %; +/- 15mrad<br />
x-max 0.4 m<br />
vertical (y): +/- 2mrad<br />
y-max 0.1 m<br />
gas-jet<br />
target<br />
quadrupoles dipole quadrupoles<br />
& hexapoles<br />
image plane<br />
detector<br />
pocket<br />
Figure 1: Ion trajectories in the new ESR “spectrometer<br />
mode” for one quarter of the ring. The new setting features<br />
an image of the reaction volume at the internal jet target<br />
at the position of the particle detector. Due to chromatic<br />
aberration the image plane is tilted by 16.9 ◦ .<br />
mrad in horizontal and ±2 mrad in vertical direction can<br />
be guided to the detector whereas the small angle in vertical<br />
direction is mainly given due to the height of the dipole<br />
gap. The dispersion at the position of the particle detector<br />
∆x/∆(Bρ)/(Bρ) = 9.9cm/% is roughly 50 % higher<br />
than the one in the ESR standard setting. Accordingly, the<br />
momentum acceptance of the ring is reduced from ±1.5%<br />
to about ±1.0%. A tilt of the image plane by 16.9 ◦ due to<br />
chromatic abberation is inevitable and cannot be corrected<br />
for using the existing hexapole magnets. Albeit large at first<br />
sight this tilt does almost not hamper the momentum resolution.<br />
It can be fully avoided if detectors/detector pockets<br />
are mounted under the same angle. The main downside of<br />
the new setting is the large septum and kick angles during<br />
injection of the beam which are 1.5 times higher than for<br />
the present standard mode. This might limit the maximum<br />
magnetic rigidity of the injected particles and/or reduce<br />
their intensity. The present calculations are a very encouraging<br />
start to further fine-tune the settings, work towards<br />
ion-optical test experiments in 2010—and on success—to<br />
prepare a first proof-of-principle run soon afterwards.<br />
References<br />
[1] EXL Letter of intent/Technical Report on<br />
http://www.gsi.de/fair/experiments/NUSTAR/Proposals.htm<br />
[2] D. Shapira et al., NIM A 454 409 (2000).<br />
[3] H. Wiedemann, “Particle Accelerator Physics”, 3rd edition,<br />
2007, Springer Verlag, Berlin, Heidelberg, New York.<br />
297
INSTRUMENTS-METHODS-18 <strong>GSI</strong> SCIENTIFIC REPORT 2009<br />
Drift chambers for the HypHI project<br />
E. Kim ∗1,2 , D. Nakajima 1,3 , B. Özel-Tashenov 1,4 , S. Bianchin 1 , O. Borodina 1,5 , V. Bozkurt 1,4 ,<br />
B. Göküzüm 1,4 , S. Kim 1 , Y. Ma 5,6 , S. Minami 1 , C. Rappold 1,7 , and T.R. Saito 1,5<br />
1 <strong>GSI</strong>, Darmstadt, Germany; 2 Seoul National University, Seoul, Korea; 3 Tokyo University, Tokyo, Japan; 4 Nigde<br />
University, Nigde, Turkey; 5 Mainz University, Mainz, Germany; 6 Tohoku University, Sendai, Japan; 7 Strasbourg<br />
University, Strasbourg, France<br />
The HypHI project aims to perform the precise hypernuclear<br />
spectroscopy with stable heavy ion beams and rare<br />
isotope beams at <strong>GSI</strong> and FAIR in order to study hypernuclei<br />
at extreme isospin and measure hypernuclear magnetic<br />
moment directly [1]. As the first experiment of the HypHI<br />
project, the Phase 0 experiment was performed in August<br />
and October 2009 to demonstrate the feasibility of the experimental<br />
methods with 6 Li beams at 2 A GeV impinging<br />
on a 12 C target [2].<br />
In the experiment, two drift chambers from KEK were<br />
installed for tracking charged particles. The small drift<br />
chamber was placed between scintillating fiber detectors<br />
(TR1 and TR2) [3], and the big drift chamber was placed<br />
behind the ALADiN magnet. The component plane, active<br />
area and drift length of the chambers are listed in Table 1.<br />
Chamber Active area Plane Drift length<br />
[cm 2 ] [mm]<br />
xx’ (vertical) 2.5<br />
Small 24(W)×14(H) uu’ (-15 o ) 2.5<br />
vv’ (15 o ) 2.5<br />
XX’ (horizontal) 4.5<br />
Big 120(W)×90(H) YY’ (vertical) 4.5<br />
U (45 o ) 9.0<br />
Table 1: Specifications of drift chambers.<br />
The gas mixture for both chambers was Ar (70 %) + CO2<br />
(30 %) at atmospheric pressure. In the small chamber, the<br />
high voltages were 1.53 kV for potential wires and 1.42 kV<br />
for cathode planes. In the big chamber, 2.20 kV (XY) and<br />
2.43 kV (U) for potential wires and 1.48 kV (XY) and 1.59<br />
kV (U) for shields were applied.<br />
These chambers are designed to be operated up to 10 5<br />
particles per second per wire. However, since these drift<br />
chambers were located on the beam axis and 6 Li beams<br />
with an intensity of 10 7 particles per second were used in<br />
the experiment, an insensitive area for the beam particles<br />
was implemented for both drift chambers with different<br />
techniques.<br />
For the small chamber, the sense wires in the beam region<br />
(1.5 cm × 1.5 cm) were wrapped with teflon sheets<br />
(refer to Figure 1). Before the experiment, the insensitivity<br />
in that region was studied with 90 Sr β-source. It showed<br />
a total efficiency with all six planes of 2.2 × 10 −4 and an<br />
efficiency per plane of 0.25 ± 0.04. In addition, another<br />
298<br />
∗ e.kim@gsi.de<br />
method by attaching mylar tapes on the cathode planes was<br />
applied to improve the insensitivity.<br />
Figure 1: Taflon-wrapping to make the sense wire insensitive<br />
in the small chamber<br />
For the big chamber, the beam region was made insensitive<br />
by connecting the sense wires and the potential wires<br />
to remove the electric field around the sense wires. With<br />
these techniques, both of the drift chambers have been operated<br />
with an beam intensity of up to 5 × 10 6 per second.<br />
Logic signals from the discriminators of the drift chambers<br />
are to the newly developed universal logic modules<br />
VUPROM2 [4], and time information were recorded with<br />
a granularity of 2.5 ns.<br />
References<br />
[1] T.R. Saito et al., Letter Of Intent of HypHI.<br />
[2] T.R. Saito et al., Proposal of the HypHI Phase 0 experiment,<br />
submitted to G-PAC 33<br />
[3] D. Nakajima, B. Özel-Tashenov et al., in these reports.<br />
[4] S. Minami et al., <strong>GSI</strong> Scientific Report 2007, <strong>GSI</strong>, Darmstadt,<br />
2008, p223.
<strong>GSI</strong> SCIENTIFIC REPORT 2009 INSTRUMENTS-METHODS-19<br />
Scintillating fiber detectors for HypHI Phase 0 experiment£<br />
D. NakajimaÝ1,3 , B. Özel-TashenovÞ1 , S. Bianchin 1 , O. Borodina 1,2 , V. Bozkurt 1 , B. Göküzüm 1 , M.<br />
Kavatsyuk 4 , E. Kim 1,5 , S. Minami 1 , C. Rappold 1,6 , T.R. Saito 1,2 , P. Achenbach 2 , J. Hoffmann 1 , K.<br />
Koch 1 , N. Kurz 1 , F. Maas 1,2 , W. Trautmann 1 , and S. Voltz 1<br />
1 <strong>GSI</strong>, Darmstadt, Germany; 2 Mainz University, Mainz, Germany; 3 Tokyo University, Tokyo, Japan; 4 KVI, Groningen,<br />
The Netherlands; 5 Seoul National University, Seoul,Korea; 6 Strasbourg University, Strasbourg, France<br />
The first step of the HypHI project (Phase 0) has been<br />
performed in order to demonstrate the feasibility of precise<br />
hypernuclear spectroscopy with heavy ion induced reactions.<br />
In the experiment, light hypernuclei such as£H, �£H and�£He are produced by induced reaction of�Li at 2<br />
�GeV on a C target, and the hypernuclei events are reconstructed<br />
by observing� decay channels by means of<br />
the invariant mass spectroscopy [1, 2]. In the Phase 0 experiment,<br />
three sets of two dimensional Scintillating fiber<br />
(SciFi) detectors ,TR0ÜÝ, TR1ÜÝand TR2ÜÝ, are used to<br />
track charged particles behind the carbon target. They are<br />
also used to produce secondary vertex triggers to the data<br />
aquisition system [3]. Figure 1 shows the schematic layout<br />
TOF-Start<br />
y<br />
x<br />
Target<br />
z<br />
TR0x TR0y<br />
TR1x TR1y<br />
BDC<br />
40 cm 30 cm<br />
TR2x TR2y<br />
Figure 1: The schematic layout of the detector system in<br />
upstream of the spectrometer<br />
of the experimental setup in front of the ALADiN magnet.<br />
TR0 is mounted right behind the graphite target, and TR1<br />
and TR2 placed with distances of 40 cm and 70 cm, respectively,<br />
from the target. Each set consists ofÜandÝplane for<br />
the horizontal and vertical tracking. In between TR1 and<br />
TR2, a drift chamber with six layers (BDC) was mounted to<br />
solve a stereo ambiguity in track finding process. Readout<br />
of scintillating photons is performed with H7260KS MOD<br />
(Hamamatsu) 32 channel multi-anode photomultiplier tube<br />
(PMT), which is an improved version of the commercial<br />
PMT H72690. It has grids in the glass window in front of<br />
the photo-cathode to separate each channel in order to reduce<br />
cross talks, and has booster cables in the last three<br />
dynode stages to stabilize the voltage under high beam<br />
intensity[4]. Analog signals from PMT are processed by<br />
a double-threshold discriminators (DTDs) from the MAMI<br />
KaoS collaboration to create LVDS logic signals. The<br />
timing information of leading- and trailing- edge of the<br />
£The HypHI project is supported by the Helmholtz Association as<br />
Helmholtz University Young Investigators Group VH-NG-239 and by<br />
DFG with the research grant SA 1696/1-1.<br />
Ýd.nakajima@gsi.de<br />
Þb.oezel@gsi.de<br />
LVDS logic signals were recorded by VUPROM2 which<br />
is a newly developed VME logic module with a FPGA running<br />
at 400 MHz. In addition, charge information of TR0<br />
was stored by charge sensitive analog-to-digital converters<br />
(QDCs) to distinguish particles with different charges,�=<br />
1, 2 and 3, from their energy deposition in order to reduce<br />
background events [1].<br />
A group of neighboring fired channels are clustered and<br />
hit position is calculated from the center of gravity of the hit<br />
cluster. The position resolution is defined as a width of the<br />
residual distribution, which is the distribution of distance<br />
between measured hit positions and track position extrapolated<br />
by the other detector. Figure 2 shows the residual hit<br />
position distribution at TR1 for the tracks extrapolated by<br />
TR0, TR2 and BDC for particles with�= 1. Although further<br />
calibration has to be carried out, a position resolution<br />
of�0.47 mm in�for particles with�= 1 has been already<br />
achieved, which is close to the expected resolution[4]. For<br />
particles with�= 2 and 3, position resolutions of 0.56 mm<br />
and 0.28 mm in�have been achieved.<br />
160<br />
140<br />
120<br />
100<br />
80<br />
60<br />
40<br />
20<br />
0<br />
Z = 1<br />
σ = 0.465 [mm]<br />
-6 -4 -2 0 2 4 6<br />
Figure 2: The residual distribution of the hit position at<br />
TR1 from the track extrapolated by TR0 and TR2 for particles<br />
with�= 1.<br />
References<br />
[1] T.R. Saito et al., Letter Of Intent of HypHI.<br />
[2] T.R. Saito et al., in these reports.<br />
[3] S. Minami et al., in these reports.<br />
[4] D. Nakajima and B. Özel-Tashenov et al., Nucl. Inst. Meth.<br />
A 608 (2009) 287-290<br />
299
INSTRUMENTS-METHODS-20 <strong>GSI</strong> SCIENTIFIC REPORT 2009<br />
Performance of the trigger system at the HypHI Phase 0 experiment<br />
S. Minami ∗1 , C. Rappold 1,2 , S. Bianchin 1 , O. Borodina 1,3 , V. Bozkurt 1,4 , B. Göküzüm 1,4 ,<br />
J. Hoffmann 1 , M. Kavatsyuk 5 , E. Kim 1,6 , N. Kurz 1 , D. Nakajima 1,7 , W. Ott 1 , B. Özel-Tashenov 1,4 ,<br />
T. Saito 1,3 , and W. Trautmann 1<br />
1 <strong>GSI</strong>, Darmstadt, Germany; 2 IPHC, Université Louis Pasteur,Strasbourg, France; 3 Institut <strong>für</strong> Kernphysik, Johannes<br />
Gutenberg-Universität, Mainz, Germany; 4 Nigde University, Nigde Turkey; 5 KVI, Groningen, The Netherlands;<br />
6 Seoul National University, Seoul, Korea; 7 The University of Tokyo, Bunkyo, Japan<br />
The first experiment of HypHI project, phase 0, has been<br />
performed at October 2009 to detect hypernuclei produced<br />
by a 2.0 A GeV 6 Li beam impinging on a 12 C target, by<br />
identifying the mesonic decay modes, 3 Λ H →3 He + π − , 4 Λ H<br />
→ 4 He + π − and 5 Λ He →4 He + p + π − [1]. A high intensity<br />
beam of 10 6 ∼10 7 particles per second and a target<br />
with a thickness of 8 g/cm 2 were used to overcome small<br />
production cross sections expected to be of the order of 0.1<br />
µb. The challenge of the trigger system was to derive a<br />
fast trigger signal with a event rate up to 3 kHz under the<br />
experimental conditions.<br />
Table 1: The conditions for the each trigger, the minimumbias<br />
trigger (MBT), the reaction trigger (RT), the hypernuclear<br />
trigger(HT) and the He hypernuclear trigger (HeHT).<br />
Trigger MBT RT HT HeHT<br />
Vertex<br />
Mul.≥1<br />
Mul.≥2<br />
on on<br />
on<br />
TR012 Mul.≥1 on on on on<br />
TR1 Mul.≥2 on on on<br />
TOF+<br />
Mul.≥1<br />
Mul.≥1 for He<br />
on on<br />
on<br />
on<br />
on<br />
TOF- Mul.≥1 on on<br />
TOFs<br />
Mul.≥1<br />
Mul.≤2<br />
on on on<br />
on<br />
on<br />
on<br />
Scaling factor 1.5×10⁻⁵ 1<br />
Mixed Trigger 1 on on on<br />
Mixed Trigger 2 on on on<br />
The main feature of the trigger system is to select events<br />
with decay vertices located 20 cm in average behind the<br />
target (Vertex)[2]. It has been realized by applying sophisticated<br />
coincidence conditions to three layers of the fiber<br />
detector, TR0, TR1 and TR2 [3] using 38 VUPROMs [4].<br />
The all three decay modes are associated with a pion and<br />
a helium, which was also utilized by requesting larger energy<br />
deposit by a helium on positive side of the TOF wall<br />
(TOF+) and at least one hit at negative side (TOF-)[5]. Furthermore,<br />
the TOF start counter[5] participated in the trigger<br />
system to define the beam and to veto events with more<br />
than 2 particles due to high beam intensity (TOFs). The<br />
conditions applied for the each detector are summarized in<br />
Table 1. The data have been stored with 2 types of the<br />
mixed trigger. One is for all decay modes with some calibration<br />
data (Mixed Trigger 1) and the other is focused on<br />
the He hypernuclei with higher beam intensity requesting 2<br />
tracks from decay vertices (Mixed Trigger 2). The trigger<br />
300<br />
∗ s.minami@gsi.de<br />
rate by ’Mixed Trigger 1’ gave typically the rate of 2.6 kHz<br />
with the beam intensity of 3.2 × 10 6 per second and that by<br />
’Mixed Trigger 2’ gave 0.66 kHz with the beam intensity<br />
of 8.2 × 10 6 per second.<br />
The figure 1 shows the hit position distribution along the<br />
y-axis on TR2. The trigger system judged the hits plotted in<br />
the dashed histogram as ones by particles from the target,<br />
while the hits in the filled histogram as ones from decay<br />
vertices. It is appropriate that the peak by the Li beam is<br />
counted as the particles from the target. The decisions by<br />
the trigger have been compared with offline analysis applying<br />
the same coincidence matrix used for trigger. The results<br />
show that 79 % of trigger decision are consistent and<br />
0.75 % are inconsistent. There are 20 % cases difficult to<br />
judge because of lacking information at intermediate stage<br />
of coincidence, however it is enough to conclude that there<br />
were no mistakes one might expect, i.e. the order of channels,<br />
the coincidence matrix, cabling and timing. The trigger<br />
system has achieved the experimental request and been<br />
successfully operated during the Phase 0 experiment.<br />
Counts<br />
25000<br />
20000<br />
15000<br />
10000<br />
5000<br />
0 10 20 30 40 50 60 70 80 90<br />
y position distribution measured by TR2y (channels/2)<br />
Figure 1: The hit position distribution along the y-axis on<br />
TR2, all hits (the solid histogram), particles scattered from<br />
the target (the dashed histogram), particles from the decay<br />
vertices (the filled histogram ).<br />
References<br />
[1] T.R. Saito et al. in these reports.<br />
[2] S. Minami et al. <strong>GSI</strong> Scientific report 2008 p51<br />
[3] D. Nakajima, B.Özel-Tashenov et al. Nucl. Inst. Meth. A 608<br />
(2009) p287<br />
[4] J. Hoffmann et al. <strong>GSI</strong> Scientific report 2007 p256<br />
[5] C. Rappold et al. <strong>GSI</strong> Scientific report 2007 p221<br />
[6] S. Bianchin et al. <strong>GSI</strong> Scientific report 2008 p233
<strong>GSI</strong> SCIENTIFIC REPORT 2009 INSTRUMENTS-METHODS-21<br />
Performance of the time-of-flight detectors for the HypHI Phase 0 experiment<br />
S. Bianchin 1 , O. Borodina 1,2 , V. Bozkurt 1,3 , B. Göküzüm 1,3 , M. Kavatsyuk 4 , E. Kim 1,5 , S. Minami 1 ,<br />
D. Nakajima 1,6 , B. Özel-Tashenov 1,3 , C. Rappold 1,7 , T.R. Saito 1,2 , and W. Trautmann 1<br />
1 <strong>GSI</strong>, Helmholtz Center for Heavy Ion Research, Darmstadt, Germany; 2 Johannes Gutenberg Universität Mainz, Mainz,<br />
Germany; 3 Nigde University, Nigde, Turkey; 4 KVI, Groningen, The Netherlands; 5 Seoul National University, Seoul,<br />
Korea; 6 The University of Tokyo, Tokyo, Japan; 7 Université Louis Pasteur, Strasbourg, France<br />
The HypHI phase 0 experiment of the HypHI project<br />
[1], performed in October 2009 at <strong>GSI</strong>, is devoted to<br />
demonstrating the feasibility of a precise hypernuclear<br />
spectroscopy by using heavy ion reactions.<br />
In the Phase 0 experiment, we concentrate on studying<br />
light hypernuclei such as 3 Λ H, 4 Λ H, 4 Λ<br />
He produced by<br />
collisions of a 6 Li beam at 2 AGeV with an intensity of<br />
10 7 particles per second on a thick carbon target (8g/cm 2 ).<br />
The experimental setup of the phase 0 experiment consists<br />
of the large acceptance dipole magnet ALADiN, the start<br />
detector in front of the target, three arrays of scintillating<br />
fiber tracking detectors [2], the ALADiN and the LAND<br />
time-of-flight walls used for the detection of π − and the<br />
TOF+ wall devoted to the detection of positively charged<br />
particles. In addition, two drift chambers from KEK<br />
are placed in front of and behind the magnet in order to<br />
increase the tracking redundancy [3].<br />
For the purpose of this report, only the results obtained<br />
for the time-of-flight detectors designed and built by the<br />
HypHI collaboration , namely the TOF+ wall and the start<br />
detector, are discussed.<br />
1200<br />
1000<br />
800<br />
600<br />
400<br />
200<br />
Entries 21382<br />
Mean 22.94<br />
RMS 35.59<br />
χ 2 / ndf 597 / 133<br />
p0 1105 ± 12.2<br />
p1 23.25 ± 0.17<br />
p2 18.93 ± 0.31<br />
p3 59.6 ± 8.6<br />
p4 27.03 ± 1.28<br />
p5 64.37 ± 4.15<br />
0<br />
-200 -150 -100 -50 0 50 100 150 200<br />
∆ Y [mm]<br />
Figure 1: Y position difference between two overlapping<br />
bars of the TOF+ wall. The shift of the peaks from zero is<br />
due to a lack of absolute position calibration.<br />
The TOF+ wall [4] consists of two layers of 16 plastic scintillator<br />
bars read on both sides by photomultiplier tubes.<br />
The active area of this detector is about 1 m 2 . A hole (7.5<br />
x 6.5 cm 2 ) has been arranged to allow the passage of the<br />
beam through the detector.<br />
Due to the overlap between the two layers of scintillating<br />
plastic detectors, the X position resolution (perpendicular<br />
to the beam direction in the bending plane) is 15 mm. The<br />
Y position resolution deduced from coincidences between<br />
two overlapping bars (Fig. 1) is about 31 mm (FWHM) for<br />
one bar.<br />
The time resolution for each bar is determined by measuring<br />
the time of flight between two overlapping bars. The<br />
time resolution after walk corrections is ∼ 300 ps (FWHM)<br />
(Fig. 2).<br />
The start detector allowing a precise measurement of the<br />
time of flight of the particles produced by the decay of hypernuclei<br />
consists of 10 scintillating plastic fingers read on<br />
both sides by photomultiplier tubes [5]. The observed time<br />
resolution of the start counter for 6 Li is ∼ 300 ps (FWHM).<br />
10000<br />
8000<br />
6000<br />
4000<br />
2000<br />
Entries 168222<br />
χ 2 / ndf 709.4 / 277<br />
p0 6211 ± 91.4<br />
p1 18.19 ± 0.04<br />
p2 4.129 ± 0.048<br />
p3 3188 ± 80.5<br />
p4 15.19 ± 0.08<br />
p5 9.221 ± 0.144<br />
p6 546.7 ± 31.0<br />
p7 16.64 ± 0.16<br />
p8 20.93 ± 0.31<br />
0<br />
-100 -50 0 50 100 150<br />
TOF [ch]<br />
Figure 2: Time of flight measured between the two overlapping<br />
bars. The histogram is fitted by a function which is<br />
the sum of three gaussians.<br />
References<br />
[1] T.R. Saito et al., Proposal of the HypHI Phase 0 experiment,<br />
submitted to the G-PAC 33 with a realization as S319.<br />
[2] D. Nakajima, B. Özel-Tashenov et al., in these reports.<br />
[3] E. Kim et al., in these reports.<br />
[4] C. Rappold et al., <strong>GSI</strong> Scientific Report 2006, p. 222.<br />
[5] S. Bianchin, O. Borodina et al., <strong>GSI</strong> Scientific Report 2008,<br />
p. 233.<br />
301
INSTRUMENTS-METHODS-22 <strong>GSI</strong> SCIENTIFIC REPORT 2009<br />
<strong>GSI</strong>Template2007<br />
Recent detector developments at the FRS<br />
A. Ay 1 , K.-H. Behr 1 , A. Brünle 1 , F. Farinon 1 , H. Geissel 1 , R. Janik 2 , C. Karagiannis 1 ,<br />
A. Kelić-Heil 1 , A. Kratz 1 , J. Kurcewicz 1 , I. Mukha 1 , C. Nociforo 1 , S. Pietri 1 , A. Prochazka 1 ,<br />
M. V. Ricciardi 1 , C. Scheidenberger 1 , B. Sitar 2 , P. Strmen 2 , I. Szarka 2 , S. Terashima 1 ,<br />
H. Weick 1 , J.S. Winfield 1 , M. Winkler 1 , and I. Wischert 1<br />
1 <strong>GSI</strong>, Darmstadt, Germany; 2 Comenius University, Bratislava, Slovakia<br />
The <strong>GSI</strong> projectile Fragment Separator (FRS) [1] has<br />
proved to be a versatile and powerful tool for production<br />
of exotic isotopes. Several crucial experiments have been<br />
performed and many milestones of the nuclear physics<br />
have been reached over the last 20 years FRS is running.<br />
Nevertheless operation of such facility requires continuous<br />
improvement and development. In this contribution<br />
we report on recently performed test experiments focused<br />
on detectors development. Three such test were performed<br />
in 2009 namely in March ( 96 Ru 42+ + 9 Be@500<br />
MeV/u), August ( 56 Fe 25+ + 9 Be @350 MeV/u) and October<br />
( 238 U 92+ + 9 Be @750 MeV/u). In parallel to the detector<br />
development explained below, other NUSTAR detector<br />
systems were either tested or commissioned during<br />
those runs [2].<br />
MUSIC<br />
The multiple sampling ionisation chamber (MUSIC)<br />
[3] is a standard detector used for almost all experiments<br />
performed at the FRS. The energy loss signal of the fragments<br />
is used for the reconstruction of their atomic number.<br />
In the recently performed experiment the energy loss<br />
signal of the Uranium fragments registered at the last focal<br />
plane (S4) of the FRS was detected using MUSIC<br />
filled with CF4 or P10 gases. The data were recorded applying<br />
the Bρ setting of the FRS optimised for yielding<br />
high beam intensity of 205 Pb. In case of P10 filling gas the<br />
width of the energy loss signal distribution decreases for<br />
the heaviest species by a factor of 0.6 comparing to the<br />
standard CF4. Thus one of two different running modes<br />
can be chosen for measurement involving the heaviest<br />
Uranium fragments depending if good signal resolution or<br />
high loads handling is of greater importance.<br />
Several improvement to the standard velocity calibration<br />
has been made yielding a more reliable charge reconstruction.<br />
Scintillators<br />
Together with the information used from the ionisation<br />
chambers, to achieve full fragment identification in<br />
mass and atomic number the velocity of the fragment<br />
needs to be measured through the FRS. This is done by a<br />
time-of-flight (ToF) measurement between the second<br />
(S2) and fourth focal plane (S4). The normal system composed<br />
of two plastics (BC420) with fast PMT cannot assure<br />
a perfectly clean identification for the higher masses<br />
(see identification spectrum of Uranium fragments [4]).<br />
To improve this several tests were performed during the<br />
FRS000 beam time <strong>block</strong>s. As a first step the ToF was<br />
duplicated in order to increase the resolution by the in-<br />
302<br />
verse of the square root of two. In addition BC422Q plastics<br />
were tested. They exhibit a faster time signal albeit<br />
suffer from larger light attenuation. No improvement<br />
were seen with this type of material. The faster timing<br />
were cancelled by the smaller light yield due to the larger<br />
detector size needed to cover the focal plane, and the high<br />
light attenuation of those materials. A linear REPIC photo<br />
transmitter/receiver, allowing the transfer of PMT signals<br />
from the focal planes to the Messhütte, through optical<br />
fibers was tested as well.<br />
TPC<br />
The Time Projection Chamber (TPC) became a standard<br />
tracking detector for the FRS. Up to now TPCs were used<br />
only in air but it is foreseen for a vacuum use as well. We<br />
have developed and successfully tested a TPC modified<br />
version for vacuum together with a new calibration scintillator<br />
for vacuum. We have developed a new calibration<br />
procedure with a software coincidence between calibration<br />
scintillators and the master trigger, which allows a<br />
faster TPC online calibration.<br />
DAQ<br />
A novel FRS DAQ based on a multi-event DAQ mode<br />
was tested at the FRS. A gain in data flow processing up<br />
to the factor of 2 was experimentally achieved for a count<br />
rate reaching about 3000 events/s. This result can be still<br />
improved after the upgrade of the VME send processor to<br />
the newer RIO-4 release version. For a more detailed description<br />
of the recent developments of the FRS DAQ<br />
system see Ref. [5].<br />
Summary<br />
Several improvements of the standard FRS detectors,<br />
operation modes, calibration procedures and data acquisition<br />
system have been achieved in the lately performed<br />
test experiments. The recent developments are first of all<br />
a basic step towards the studies of the most exotic nuclei<br />
being a more and more challenging experimental task [4].<br />
They can also be considered important preparatory work<br />
for the Super-FRS at FAIR.<br />
References<br />
[1] H. Geissel et al. NIM B 70, (1992) 286.<br />
[2] R. Hoischer et al., this report.<br />
[3] R, Schneider, A. Stolz http://www-w2k.gsi.de/frs/<br />
technical/FRSsetup/detectors/music.asp<br />
[4] J. Kurcewicz et al., this report.<br />
[5] C. Nociforo et al., this report.
<strong>GSI</strong> SCIENTIFIC REPORT 2009 INSTRUMENTS-METHODS-23<br />
Development and test of Isomer TAGging detector<br />
F. Farinon 1,2 , I. Kojouharov 2 , C. Nociforo 2 , S. Pietri 2 , K-H. Behr 2 , A. Brünle 2 , H. Geissel 1,2 ,<br />
C. Karagiannis 2 , J. Kurcewicz 2 , A. Prochazka 1,2 , M.V. Ricciardi 2 , C. Scheidenberger 1,2 , H. Weick 2 ,<br />
J.S. Winfield 2 , and M. Winkler 2<br />
1 Justus-Liebig-Universität Giessen, Germany; 2 <strong>GSI</strong>, Darmstadt, Germany<br />
ITAG (Isomer TAGging detector) is a composite detector<br />
developed for isotope identification by isomer tagging<br />
at the FRagment Separator (FRS) facility [1]. It is placed at<br />
the final focal point of FRS and detects γ-rays emitted from<br />
isomeric decay of fragments implanted into its stopper. The<br />
on-line analysis recognizes the γ-lines pattern, allowing to<br />
identify the isomers and later all the secondary fragments.<br />
ITAG consists of two movable Germanium (Ge) detectors<br />
mechanically cooled, two plastic scintillators and an exchangeable<br />
passive stopper (Fig. 1). The whole system can<br />
be lift up from the beam line to protect the detectors from<br />
radiation damage. As further protection, the Ge crystals<br />
are shielded by a 50 mm thick lead layer. The Ge crystals<br />
are mounted on moving tables to get as close as possible<br />
to the stopper maximizing the photopeak efficiency, that<br />
ranges from 0.4% at 90 mm to 0.2% at 150 mm for γ-rays<br />
of 1.3 MeV. Each Ge-crystal was installed in a specially<br />
developed cryostat [2] based on electromechanical cooling<br />
engine X-Cooler II produced by ORTEC [3]. The cooling<br />
system was tested by scanning the whole volume of the<br />
crystal with collimated γ-sources. The energy resolution<br />
(FWHM ≈1.2 keV at 60 keV) was found to be constant<br />
and in good agreement with the expectation, proving the<br />
uniformity of temperature and sufficient cooling.<br />
The plastic scintillators (BC400, 1 mm thickness) are used<br />
to count the particles and to control their implantation in<br />
the stopper. The second scintillator acts as veto detector.<br />
Figure 1: Schematic drawing of ITAG detector.<br />
During an FRS000 experiment, a primary 96 Ru 42+ beam<br />
at an energy of 500 MeV/u and a maximum intensity of<br />
∼ 10 5 ions/s impinged on a 2.5 g/cm 2 Be target. The FRS<br />
was used in achromatic mode and optimised for the transmission<br />
of 94 Ru ions. The ions were slowed down and<br />
implanted into the 3 mm thick Al stopper of ITAG. The<br />
identication of the reaction products was performed using<br />
the standard time of flight and energy loss techniques [4]<br />
and the ITAG. The time difference between an ion passing<br />
the first scintillator and its γ decay was measured using<br />
a T ime-to-Analog Converter (TAC). Figure 2 shows the<br />
on-line analysis steps: the selection of a fragment in the<br />
identification matrix (A); a selected fragment γ-energy and<br />
time correlation matrix (B); the energy (C) and time (D)<br />
projection of this matrix after removing of the prompt flash<br />
(x-rays emitted during the implantation phase) and comparison<br />
of eventually gamma lines and half-lifes obtained<br />
with the known ones. Two isomers ( 90 Mo and 92 Tc) were<br />
identified using this procedure and the results are listed in<br />
the table below. After its commisioning the ITAG is now<br />
available as a standard FRS detector for future experiments.<br />
Production γ-counts γ-lines (MeV) T1/2 (µs)<br />
92<br />
Tc<br />
5<br />
1.3 × 10 95 214.2 ± 2.9<br />
809.9 ± 3.0<br />
1.04 ± 0.3<br />
90<br />
Mo<br />
4<br />
8.6 × 10 180 947.7 ± 3.0<br />
1053.9 ± 3.1<br />
1.13 ± 0.16<br />
Figure 2: On-line analysis steps: identification matrix<br />
(A); 90 Mo γ-energy and time correlation matrix (B); 90 Mo<br />
gamma lines (C) and 90 Mo half-life (D).<br />
[1] H. Geissel et al., NIM B70, 286-297 (1992).<br />
[2] I. Kojouharov et al., <strong>GSI</strong> Scientific Report 2008, 235.<br />
[3] ORTEC X-Cooler II. http://www.ortec-online.com.<br />
[4] B. Voss et al., Nucl. Inst. Meth. A364 (1995) 150.<br />
303
INSTRUMENTS-METHODS-24 <strong>GSI</strong> SCIENTIFIC REPORT 2009<br />
304<br />
<strong>GSI</strong>Template2007<br />
Scanner for gamma-ray detectors<br />
N.Goel, C.Domingo-Pardo, T.Engert, J.Gerl, I.Kojouharov and H.Schaffner<br />
<strong>GSI</strong>, Darmstadt, Germany<br />
The core principle of segmented detectors like<br />
AGATA [1], GRETA [2], that will be used in future for<br />
4π gamma detection arrays, is the application of the concept<br />
of pulse shape analysis (PSA). The key ingredient for<br />
this analysis is a data base containing pulses for all the<br />
interaction points inside the segmented detector. A full<br />
3D scanning of the detectors, which experimentally determines<br />
pulse shapes for every given position inside the<br />
active volume, is therefore needed.<br />
Novel Scanner Principle<br />
We proposed and implemented a first detector scanner<br />
based on the principles of pulse shape comparison (PSC)<br />
[3] and positron annihilation correlation (PAC) [4].<br />
Description of the PSC technique:<br />
A 1MBq 22 Na source is placed between the position<br />
sensitive detector (PSD) and the Germanium detector<br />
which we want to scan. The PSD system is built with a<br />
LYSO crystal and a large area position sensitive photomultiplier<br />
tube (PSPMT) from Hamamatsu. The performance<br />
of PSPMT was studied in detail [5]. The trajectories<br />
of γ-rays entering the germanium volume are defined<br />
by the 2D PSD. This allows creating a "collimationfree"<br />
scanner, where many lines across the detector or<br />
even the whole detector can be scanned simultaneously.<br />
For the position a) in figure 1, a data base containing<br />
pulse shapes for all the trajectories coming inside the coincidence<br />
cone of the Ge and the PSD is recorded. The<br />
(x,y) coordinates measured in the PSD provide the trajectories<br />
of γ-rays. Now for the second set of measurement<br />
corresponding to the position b) in figure 1, the PSD and<br />
22 Na are rotated together along the axis of the Ge detector.<br />
In figure 1, it is shown that they are rotated by 90 o . Again<br />
a data set containing the pulse shapes and the (x,y) coordinates<br />
given by the PSD for this configuration is recorded.<br />
Now if we compare these two data sets, the only<br />
case in which a signal of one set is identical to the signal<br />
of the other set is when the two signals correspond to the<br />
crossing point of two lines inside the coincidence cone. In<br />
this way, it is possible to obtain a data base containing the<br />
pulse shape for each crossing point. The (x,y,z) coordinates<br />
of the crossing point are determined from the two γray<br />
trajectories measured via the PSD with an accuracy of<br />
1mm [5]. The main feature of the PSCS is that it allows to<br />
obtain the pulse shape database for a HPGe detector much<br />
faster as compared to other conventional scanning methods<br />
[6].<br />
The pulses for a particular interaction point are selected<br />
on the basis of a χ 2 comparison test. The pulses<br />
along one selected trajectory are compared to the pulses<br />
in perpendicular trajectory. Only those pair of pulses are<br />
selected which are below a sufficiently small χ 2 value.<br />
The pulse which is associated to a particular point is then<br />
the average of ~ 200 pulses, which are below the stringent<br />
χ 2 threshold value.<br />
Position sensitive<br />
Detector<br />
a)<br />
Na-22<br />
90 o<br />
Na-22<br />
b)<br />
Rotated<br />
by 90 0<br />
Figure 1: Pulse shape comparison scan of germanium (a)<br />
Pulse shapes recorded for the collimation lines coming<br />
inside the coincidence cone of PSD and germanium, (b)<br />
Source and PSD moved together by an angle of 90 0 and<br />
again a data set of pulse shapes is measured.<br />
References<br />
[1] J.Gerl and W.Korten, AGATA Technical Proposal<br />
for an Advanced Gamma Tracking Array for the<br />
European Gamma Spectroscopy community, (2001).<br />
[2] I.Y. Lee et.al, "GRETINA: A gamma ray energy<br />
tracking array", Nuclear Physics A, vol. 520, pp. 255-<br />
259, Nov 2004.<br />
[3] F.C.L. Crespi et.al, "A novel technique for the charac<br />
terisation of a HPGE detector response based on pulse<br />
shape comparison", Nuclear Instruments and Methods<br />
in Physics Research A, vol. 593, pp. 440-447, Aug<br />
2008.<br />
[4] J.Gerl et.al "High-resolution gamma back scatter im-<br />
aging for technical applications", Nuclear Instruments<br />
and Methods in Physics Research A, vol. 525,<br />
pp. 328-331, 2004.<br />
[5] C. Domingo-Pardo, N. Goel, J. Gerl, T. Engert, I. Ko<br />
jouharov, H. Schaffner, I. Masahiro, "A position sen<br />
sitive γ- ray scintillator detector with enhanced spatial<br />
resolution, linearity and field of view", IEEE Transac<br />
tions on Medical ImagingVolume 28, Issue 12, Dec.<br />
2009.<br />
[6] M. Descovich et.al, "The position response of a large<br />
volume segmented germanium detector", Nuclear In<br />
struments and Methods in Physics Research A, vol.<br />
553, pp. 512-521, 2005.
<strong>GSI</strong> SCIENTIFIC REPORT 2009 INSTRUMENTS-METHODS-25<br />
Surface characterisation and treatment evaluation of HPGe- detectors<br />
T. Engert 1,2 , I.Kojouharov 1 , M. Krause 1 , O.Picht 1 , K.O. Voss 1 ,<br />
M. Rauber 1 , J.Gerl 1 , P.Nolan 2 , Th. Krings 3<br />
1 <strong>GSI</strong>, <strong>Helmholtzzentrum</strong> <strong>für</strong> <strong>Schwerionenforschung</strong> GmbH, Germany;<br />
2 University of Liverpool, UK; 3 SEMIKON Detector GmbH, 52428 Juelich, Germany<br />
Germanium-detectors are the most sensitive<br />
high-resolution γ detectors available and are the<br />
instrument in nuclear structure physics which<br />
allows important information about the structure of<br />
atomic nuclei to be obtained. The development of<br />
HPGe detectors often requires sophisticated crystal<br />
shapes in order to achieve optimal performance.<br />
The HPGe crystal treatment technology is mature<br />
[1], however is more suited to standard commercial<br />
type of detectors rather then research type one. The<br />
reported work is motivated by the needs for a new<br />
mechanical treatment procedure within the<br />
manufacturing methods in order to obtain better<br />
quality of the Germanium surfaces and increased<br />
cost-efficiency enabling complicated shapes to be<br />
produced.<br />
Seven conservative produced germanium crystals<br />
with different surface qualities due to varying<br />
mechanical treatment were employed for the<br />
characterisation of their surfaces in the treatment<br />
technology. However, the characterisations have<br />
been carried out with a Atomic Force Microscope, a<br />
Profilometer, a Field Emission Scanning<br />
Microscope and a Electron Probe Micro Analyser.<br />
Germanium treatment and shaping tests with a new<br />
ultrasonic grinding machine have been carried out<br />
and the results have shown very fine surface<br />
structures with tight tolerances of 2 μm.<br />
Qualitatively the degree of roughness achieved is a<br />
factor of 3.9 times better than with standard<br />
grinding techniques, while being a factor of 1.8<br />
times better compared to standard lapping<br />
processes. This kind of sophisticated mechanical<br />
treatment allows also complicated shapes to be<br />
achieved. On the basis of these characterisation and<br />
ultrasonic treatment results a novel type of planar<br />
Ge-detector have been developed and are shown in<br />
Figure 1.<br />
After ultrasonic<br />
After plasma<br />
treatment<br />
etching<br />
Figure 1: High-purity germanium crystal<br />
For the first leakage current and spectroscopic test<br />
in this development stage, the detector was mounted<br />
in a multifunction cryostat and tested.<br />
Current [nA]<br />
10<br />
9<br />
8<br />
7<br />
6<br />
5<br />
4<br />
3<br />
2<br />
1<br />
0<br />
Leakage current<br />
0 100 200 300 400 500 600 700 800 900 1000<br />
Voltage [V]<br />
Figure 2: Leakage current characteristic<br />
The current-voltage line shows that the depletion<br />
voltage of this detector is at 500 V. The plateau of<br />
the detector is located between 200V and 500V.<br />
Based on this configuration of crystal and cryostat,<br />
a spectroscopic test was performed, although not<br />
following the IEEE-standards.<br />
Figure 3: Spectroscopic test<br />
The first test of the detector shows good<br />
spectroscopic results with a 241 Am source and a<br />
pulser, for a bias voltage of 400V. This test was<br />
enough to demonstrate that ultrasonic-grinding as a<br />
mechanical treatment can be used in the detector<br />
development process for further novel types of<br />
HPGe detectors.<br />
References<br />
[1] GeLab at <strong>GSI</strong>, I.Kojouharov, T.Engert, J.Gerl,<br />
Gamma Net, Padova, 10-11.05.2007<br />
305
INSTRUMENTS-METHODS-26 <strong>GSI</strong> SCIENTIFIC REPORT 2009<br />
306<br />
Surface projection of HPGe- detectors<br />
T. Engert 1,2 , I.Kojouharov 1 , J.Gerl 1 , D. Lehmann 1 , P.Nolan 2<br />
1 <strong>GSI</strong>, <strong>Helmholtzzentrum</strong> <strong>für</strong> <strong>Schwerionenforschung</strong> GmbH, Germany;<br />
2 University of Liverpool, UK<br />
Several encapsulated single Germanium<br />
detectors have been mounted in one unit and<br />
integrated in a cryostat, in order to build efficient<br />
spectrometers to detect γ radiation emitted by nuclei<br />
excited in nuclear reactions. This kind of crystal<br />
encapsulation offer advantages compared to<br />
standard set-up of HPGe- detectors.<br />
The basic aim of the following work is to develop a<br />
new capsule technology, in particular concerning<br />
the high-vacuum tightness and the temperature<br />
influence during the CO2 welding procedure. The<br />
difficulty is the complexity of the detector and the<br />
germanium crystal respectively which reacts very<br />
sensitive to external influences. Consequently there<br />
is a risk that the germanium is no longer suitable for<br />
a detector because of an incorrectly employed<br />
manufacturing process. Another difficulty is the<br />
wall thickness and the material of the capsule as<br />
well as the complicated geometric shape of the<br />
detectors. To be able to understand all the<br />
circumstances of this partially complicated<br />
production, physical and economic aspects must be<br />
taken into account.<br />
Figure 1: Encapsulated Ge-Detector<br />
After the successful capsule/lid sealing follows the<br />
next step in the capsule development: the creation<br />
of the vacuum. The idea of the evacuation device<br />
consists of an aluminium pipe which is introduced<br />
in the lid of the capsule unit by a traditional welding<br />
method. At the other end of the pipe the evacuation<br />
of the air can take place by using a vacuum pump.<br />
After arriving the desired vacuum ultrasonic<br />
welding is used for crimping this aluminium pipe at<br />
a certain point in order to reach high vacuum<br />
tightness. For this purpose, 15 aluminium pipes<br />
were used with a special inside diameter and a<br />
special wall thickness. With the help of ultrasonic<br />
welding was closed the aluminium pipes, which was<br />
filled with helium gas inside. The result of the<br />
subsequent tests with a leak detector presented a<br />
100% tightness of the sample.<br />
Figure 2: Ultrasonic welded copper and aluminium<br />
capillary pipes.<br />
Further experiments were conducted with the<br />
welded pipes two hardness tests:<br />
- The vacuum pipes were dipped in liquid nitrogen<br />
periodically (x20).<br />
- The vacuum pipes were heated also periodically<br />
(x20) in a blast furnace.<br />
After this experiment, were the pipes again by<br />
vacuum tested, and these tests were also<br />
successfully completed.<br />
Another significant characteristic of the<br />
encapsulation technology is the use of an internal<br />
getter element to have a high vacuum over a longer<br />
period. The task of a getter in this closed high<br />
vacuum system is the bonding of the rest gas<br />
particles. For this purpose, gas particles are<br />
connected a chemical bond with the atoms of the<br />
getter surface or the gas particles be retained by<br />
sorption. The integration of such getter element in a<br />
detector system has proven with the previously<br />
encapsulated semiconductor detectors in the past<br />
[1]. Therefore, to fix such getter element in this<br />
system, a constructive, economic and physically<br />
meaningful solution has been searched. In this case,<br />
the problems were the lid material aluminium, the<br />
activation of the getter with current, the capacity of<br />
the getter element and the specific place in the<br />
capsule unit. A getter element are selected with this<br />
specification and integrated into the lid of the<br />
capsule unit.<br />
On the basis of these results a novel type of<br />
encapsulated Ge-detector are planned.<br />
References<br />
[1] CTT, Entwicklung eines Germanium-Cluster-<br />
Detektors <strong>für</strong> das Gamma-Spektrometer<br />
EUROBALL, Dr. Köster Verlag Berlin, Diss. 1995,<br />
ISBN 3-89574-113-2
<strong>GSI</strong> SCIENTIFIC REPORT 2009 INSTRUMENTS-METHODS-27<br />
Performance tests of the AGATA Real time PSA ∗<br />
M. Schlarb 1 , R. Gernhäuser 1 , R. Krücken 1 , and the AGATA collaboration<br />
The Advanced Gamma Tracking Array (AGATA) is a<br />
4 π-detector of 36-fold segmented germanium crystals. Detailed<br />
simulations of a typical reaction and the associated<br />
detector pulse shapes [1] were performed to investigate<br />
its capabilities using a recently developed real time pulse<br />
shape analysis (PSA) method.<br />
The test environment<br />
We selected a 48 T i(d, p) 49 T i reaction in inverse kinematic<br />
as a typical experiment. The beam energy was<br />
100 MeV (β ∼ 0.06)[2]. In order to maximize the<br />
Doppler-shift of the emitted γ-rays, one AGATA triple<br />
cluster was mounted at 90 ◦ to the beam axis and at a distance<br />
of 11 cm to the target. This requires a precise reconstruction<br />
of the interaction locations for an accurate<br />
Doppler correction. For this purpose a PSA is performed,<br />
using a direct comparison between the simulated experimental<br />
pulse shapes and basis signals for the detectors.<br />
PSA can be implemented either by an extensive search doing<br />
a full χ 2 -comparison to all data sets in the signal basis<br />
(XGS) or by using an intelligent and much faster algorithm<br />
like the fully informed particle swarm (FIPS) described below.<br />
The fully informed particle swarm<br />
FIPS is an iterative algorithm mimicking the behavior<br />
of a flock of birds looking for food [3]. It consists of a<br />
swarm of abstract particles with each one representing a<br />
potential solution, i.e. the γ-rays interaction location(s).<br />
Each particle moves with a velocity �v at iteration q + 1<br />
given by:<br />
−−→<br />
v q+1 = χ ·<br />
�<br />
Ni<br />
−→ �<br />
q<br />
v +<br />
n=1<br />
1 Physik-Department E12, TU München<br />
�<br />
−→P q<br />
ϕ · r · i − −→ X q�<br />
�<br />
· 1/Ni . (1)<br />
Here χ < 1 prevents an exponential growth of �v, ϕ is a tuning<br />
parameter for convergence and r ∈ {0, 1} is a random<br />
number. The particles current position is given by −→ X q and<br />
−→<br />
P q<br />
i is the best position found by neighbor i so far. The sum<br />
runs over all members of the particles static neighborhood<br />
defined before the algorithm starts.<br />
Results<br />
The simulated experimental data was time aligned with<br />
the basis signals using a neural network [1] and a PSA was<br />
performed using both XGS and FIPS. Since XGS searches<br />
∗ The work was funded by BMBF(06MT238),EURONS(T-J02-3),<br />
DFG (Exz-Clust 153-Universe).<br />
the complete signal basis only events with one hit segment<br />
can be analyzed in real time. FIPS, by comparison, is capable<br />
of reconstructing events with up to three hit segments.<br />
For these events no γ-tracking was conducted but the interaction<br />
with the highest energy was deemed to be the first<br />
interaction. The obtained energy resolution of the line at<br />
1382 keV will be used as a measure for the performance.<br />
Figure 1 shows the obtained spectra together with the un-<br />
Counts per 0.5 keV<br />
14000<br />
12000<br />
10000<br />
8000<br />
6000<br />
4000<br />
2000<br />
Uncorrected<br />
FIPS<br />
XGS<br />
0<br />
1200 1250 1300 1350 1400 1450 1500<br />
Energy [keV]<br />
Figure 1: γ-ray spectrum of the simulated experiment. The<br />
uncorrected spectrum is given by the dash-dotted line, the<br />
Doppler-corrected spectra after PSA with XGS and FIPS<br />
are shown in dashed and solid lines respectively.<br />
corrected spectrum. XGS achieves a very good energy resolution<br />
of 2.8 keV but takes too long (25 ms). This is a<br />
factor of 2.5 above the limit of 10 ms for AGATA. FIPS,<br />
by contrast, is not just a lot faster (2.2 ms on average) but<br />
also significantly improves AGATA’s sensitivity. The latter<br />
is due to the more complex events which can be included<br />
in the analysis without adversely affecting the energy resolution<br />
(3.4 keV ).<br />
We have shown that it is possible to perform a real time<br />
PSA for AGATA and to obtain a very good energy resolution<br />
when using the FIPS algorithm. Its performance is<br />
independent of the γ hit multiplicity and it offers a higher<br />
sensitivity than XGS due to the larger portion of events<br />
which can be analyzed.<br />
References<br />
[1] M. Schlarb, PhD Thesis, 2009, Technische Universität<br />
München.<br />
[2] F. Recchia et al., Nucl. Instr. and Meth. A, 604, 2009, p. 555-<br />
562.<br />
[3] R. Mendes, J. Kennedy and J. Neves, IEEE Trans. on Evolutionary<br />
Computation, 8, 2004, p. 204-210.<br />
307
INSTRUMENTS-METHODS-28 <strong>GSI</strong> SCIENTIFIC REPORT 2009<br />
Ultra-Fast Timing with Plastic Scintillators<br />
R. Hoischen 1,2 , S. Pietri 1 , W. Prokopowicz 1 , H. Schaffner 1 , J. Gerl 1 , H.J. Wollersheim 1 , N. Kurz 1 , P.<br />
Golubev 2 , and D. Rudolph 2<br />
1 <strong>Helmholtzzentrum</strong> <strong>für</strong> <strong>Schwerionenforschung</strong> GmbH, D-64291 Darmstadt, Germany; 2 Department of Physics, Lund<br />
University, S-22100 Lund, Sweden<br />
As precursor to HISPEC, the upcoming PreSPEC<br />
campaign incorporates the commissioning of the first<br />
version of the LYCCA (Lund-York-Cologne-CAlorimeter)<br />
detector system called LYCCA-0. The LYCCA detector<br />
is a Time-of-Flight (ToF), ∆E, E set-up designed to<br />
unambigiously identify nuclear reaction products by their<br />
mass A, and charge Z. To achive this goal up to masses<br />
around A = 100, the total time resolution of the ToF<br />
measurement should be on the order of 100 ps FWHM<br />
or better [2]; comprised of 50 ps and 80 ps FWHM for<br />
the start and stop detctor, respectively. Mainly two timing<br />
options are deemed viable; polycrystaline CVD diamond<br />
detectors and fast plastic scintillators. In the LYCCA-0<br />
set-up the diamond detectors will be tested as ToF-start<br />
detector, while a large-area fast plastic scintillator will give<br />
the ToF-stop signal.<br />
This report is an update of last year’s article [1], and<br />
as such outlines the continued development of a prototype<br />
scintillation detector for the LYCCA-0 system, and<br />
the tests performed to establish its performance - both<br />
via simulations and in-beam tests at the FRS [3]. The<br />
LYCCA-0 ToF-stop detector will have to cover an area<br />
of about 25x25cm 2 . The most convenient way to achieve<br />
this coverage is to use a large plastic membrane read-out<br />
from four or more sides. Early tests performed on such a<br />
system with four large active-area photomultiplier tubes<br />
(PMT) indicated a good performance of around 80 ps<br />
FWHM. Further tests and simulations, shown in Fig. 1a,<br />
established that increasing the number of PMTs reading<br />
out the scintillator membrane improves time resolution, as<br />
expected from a purely statistical viewpoint. At the forseen<br />
membrane size, a BC-420 membrane would outperform<br />
a BC-422Q (quenched) plastic membrane, see Fig. 1b,<br />
although the latter has a significantly faster rise-time and<br />
thus, a better intrinsic time resolution. In all laboratory<br />
tests and the test experiment mentioned below, the raw<br />
signals were processed by Phillips Scientific constant<br />
fraction discriminators before being fed into a 21-bit<br />
CAEN V1290A Multihit TDC with 25 ps per step via <strong>GSI</strong><br />
NIM-ECL converters.<br />
To prove the system’s performance under realistic<br />
circumstances, an in-beam test was conducted with a 238 U<br />
beam during the FRS000 [4] experiment in the S2 area of<br />
the FRS. The prototype detector shown in Fig. 1c features<br />
a round 27 cm in diameter and 1 mm thick BC-420<br />
308<br />
Figure 1: a) The addition of more identical PMTs for readout<br />
of the scintillator membrane increases the possible time<br />
resolution by a factor √ N, this trend is here shown as the<br />
solid line. A saturation effect might be visible beyond 32<br />
PMTs. b) Comparing scintillator performance of two different<br />
plastics as a function of the distance to the site of<br />
photon production. c) The LYCCA-0 ToF-stop scintillation<br />
detector prototype.<br />
membrane, read out by 32 small and fast Hamamatsu<br />
R7400U PMTs mounted perpendicular to beam direction.<br />
The experimental data is still being analysed, while first<br />
rough approximations indicate a time resolution of well<br />
below 50 ps FWHM. In a previous in-beam experiment another<br />
R7400U system was tested at higher beam intensities<br />
and showed no signs of signal deterioration at particle rates<br />
of up to 100 kHz. An updated prototype version of the<br />
current detector will be tested at the FRS in an upcoming<br />
LYCCA-0 commissioning experiment in early summer<br />
2010 at <strong>GSI</strong>.<br />
References<br />
[1] R. Hoischen et al., <strong>GSI</strong> Scientific Report 2008.<br />
[2] The LYCCA Technical Design Report. Can be found at:<br />
http://wwwnsg.nuclear.lu.se/lycca/lycca-TDR.pdf<br />
[3] H. Geissel et al., Nucl. Instr. Meth. B70, 286 (1992).<br />
[4] K.H. Behr et al., <strong>GSI</strong> Scientific Report 2009.
<strong>GSI</strong> SCIENTIFIC REPORT 2009 INSTRUMENTS-METHODS-29<br />
Development and tests of a new low-energy neutron detector for the R 3 B-setup ∗<br />
C. Langer † 1,2 , A. Couture 3 , M. Csatlós 4 , M. Heil 1 , A. Krasznahorkay 4 , R. Plag 1,2 , R. Reifarth 1,2 ,<br />
F. Tovesson 3 , and the R 3 B-Collaboration<br />
1 <strong>GSI</strong> <strong>Helmholtzzentrum</strong> <strong>für</strong> <strong>Schwerionenforschung</strong> GmbH, 64291 Darmstadt, Germany; 2 J.W. Goethe Universität,<br />
60438 Frankfurt a.M., Germany; 3 Los Alamos National Laboratory, Los Alamos, New Mexico 87545, USA; 4 Institute<br />
of Nuclear Research of the Hungarian Academy of Sciences, H-4001 Debrecen, P.O. Box 51, Hungary<br />
Introduction<br />
Studies of (p,n)-reactions in inverse kinematics are a<br />
powerful tool for nuclear physics. Collective phenomena,<br />
like spin-flip and isospin-flip giant resonances, as well as<br />
the so-called neutron-skin of exotic nuclei can be studied.<br />
β-decay half lifes and Gamow-Teller strength for nuclei far<br />
off stability are rarely measured yet, but are needed for astrophysical<br />
network calculations for the different nucleosynthesis<br />
processes.<br />
(p,n)-reactions in the R 3 B-target allow to extract these<br />
information for exotic nuclei. Therefore a detector system<br />
with high angular granularity and a good time resolution is<br />
needed to resolve the time of flight from the target to the<br />
detector and the angle of the emitted neutrons sufficiently.<br />
Development and Tests<br />
The detector consists of plastic scintillator material with<br />
a size of 10x45x1000 mm. The detector bar is wrapped<br />
with a special VM2000 multilayer reflector foil. At both<br />
ends a fast PM-tube with an active divider is attached. Sillicon<br />
grease of high viscosity is used for the light coupling.<br />
Two different PM-tubes are tested in order to reach the<br />
lowest possible detection threshold: Hamatsu R2059 and<br />
Photonis XP2262.<br />
The response of the detector to γ-rays was studied in<br />
Debrecen and Frankfurt. Several γ-sources were used as<br />
well as an α-source for charged particles. A measurement<br />
performed with a 60 Co source shows a time resolution of<br />
0.8 ns and hence a position resolution of around 6 cm for<br />
a single detector. At Debrecen, a very weak 252 Cf source<br />
was used to perform a first test of the neutron detection<br />
efficiency. The source was mounted at a distance of 1 m to<br />
the detector. A PM-tube, attached to the source, produced a<br />
start trigger by detecting the spontanous fission fragments<br />
emerged from the source.<br />
Another efficiency study was performed at the Los<br />
Alamos Neutron Scattering Center (LANSCE) in New<br />
Mexico, USA. A white neutron spectrum is produced by<br />
a spallation process. Protons of 800 MeV and with a high<br />
current of up to 135µA are impinging on a water-cooled<br />
tungsten target and are creating a neutron beam with high<br />
flux at energies from the thermal region up to several hundreds<br />
of MeV.<br />
∗ This project is supported by the HGF Young Investigators Project<br />
VH-NG-327.<br />
† c.langer@gsi.de<br />
In order to avoid the strong interaction of our detector<br />
with high energy primary neutrons and γ’s, originating<br />
from the protons hitting the tungsten target, the detector<br />
was placed at a distance of 1 m outside the primary neutron<br />
beam. Instead, a fission chamber with a thin 235 U foil was<br />
situated at flight path 5 at a distance of 9 m viewing a lower<br />
tier moderator. Primary neutrons triggered fission events in<br />
the 235 U foil and the secondary fission neutrons were then<br />
used to calibrate the neutron efficiency of the plastic bars.<br />
Since the fission cross-section of 235 U is high at low incident<br />
neutron energies a huge amount of fission neutrons<br />
were produced. The fission chamber started the time-offlight<br />
measurement for the secondary fission neutrons to<br />
reach the detector. The read-out gate was opened in a time<br />
window from 2 ms to 5 ms after the primary neutrons were<br />
produced in the spallation target.<br />
First results<br />
The measurements with the γ-sources prove that the<br />
detector is working according to our expectations and the<br />
results could be reproduced with GEANT3 and GEANT4<br />
simulations (see Figure 1).<br />
The comparison between the two different PM-tubes<br />
used in these testruns shows no significant difference in the<br />
detection threshold. The efficiency studies and the analysis<br />
of the experiment at LANSCE are still ongoing.<br />
Figure 1: 22 Na simulation (blue solid line) compared to a<br />
measurement (black) taken with one detector bar.<br />
309
INSTRUMENTS-METHODS-30 <strong>GSI</strong> SCIENTIFIC REPORT 2009<br />
<strong>GSI</strong>Template2007<br />
Heading towards FAIR: upgrades on the R³B-CaveC electronics.<br />
C. Caesar, J. Frühauf, J. Hoffmann, H. Johansson*, K. Koch, N. Kurz, C. Langer, W. Ott, H. Simon,<br />
for the R³B collaboration.<br />
<strong>GSI</strong>, Darmstadt, Germany, *Chalmers Technical University, Göteborg, Sweden.<br />
The FAIR/R 3 B experiment will require global time<br />
resolutions with a r.m.s. of about 50ps. The precursor<br />
setup R³B-CaveC provides an ideal testing ground for<br />
novel electronics systems, used under realistic<br />
experimental conditions. The Tacquila system,<br />
originally developed for the FOPI experiment, exhibits<br />
both an excellent time and suitable energy resolution,<br />
which shall be used to replace the outdated FASTBUS<br />
readout system for the current LAND detector.<br />
A newly developed R 3 B-specific version of the<br />
Tacquila board provides in addition to the original<br />
version a 17th channel and a clock counter. This<br />
enables time measurements in excess of the 25ns<br />
provided by the original system. Furthermore, a new<br />
LAND front-end card (LANDFEE2, see Figure 1) has<br />
been developed, providing an amplification stage, and<br />
a splitter and discriminator. The full system consists in<br />
addition of a piggy-back QDC and the Triplex LAND<br />
control and trigger board, which is currently under<br />
design. This card will be controlled via I 2 C from the<br />
Tacquila main board and provide individual thresholds,<br />
a multiplexer chain for monitoring individual channels,<br />
and the necessary facilities to build triggers from a<br />
multiplicity signal, an analog sum over the channels<br />
and a common or, respectively. The Tacquila board is<br />
connected to a SAM5 module [1] via GTB and read out<br />
using the MBS [2] data acquisition system. The data is<br />
analyzed online and offline using CERNs Root<br />
package coupled to the UCESB [3] unpacker.<br />
Figure 1: Novel Tacquila Frontend Card (FEC) for<br />
LAND including discriminators with individual<br />
thresholds, provided via an interface connector.<br />
310<br />
The time on the Tacquila board is measured with<br />
respect to a 40 MHz clock. A campus wide clock<br />
distribution system, using precision oscillators with<br />
laser fibres, called BuTiS [4] will be used for bunch<br />
timing purposes in the FAIR accelerator complex. In<br />
the course of its development this system will be<br />
utilized as source for clock signals for our experiments,<br />
providing phase-controlled clock signals between the<br />
FRS and CaveC. A test system, consisting of two<br />
copper-coupled BuTiS oscillators, two discriminators,<br />
and a modified CLOck SYnchronization board,<br />
developed for the CBM experiment, has been used as<br />
clock input for two independent Tacquila systems in<br />
order to derive the uncertainty in the relative timing<br />
introduced by the distribution system. The CLOSY<br />
board is acting as clock divider from 100 MHz to 40<br />
MHz for this application. The relative uncertainty,<br />
using a single signal source as input on a channel on<br />
each board through the clock was determined to<br />
contribute with 17ps r.m.s. only. The advantage of such<br />
a scheme is that only a clock signal has to be<br />
transferred between different experimental facilities<br />
located far from each other (see Figure 2), and that the<br />
precision of the analogue time measurement via a timeto-amplitude<br />
converter ASIC is independent of the<br />
covered range for the time measurement.<br />
t0<br />
time<br />
-<br />
0 1 2 3 4 5 6 7 8 9<br />
several 100 m<br />
ch. i det ch. j det<br />
Figure 2: Distributed time measurement vs. clock.<br />
The trigger decision, dead time <strong>block</strong>ing and priority<br />
encoding, which is currently done hardware wise via<br />
NIM modules is currently implemented in software<br />
using the VULOM [1] module. The on-board Xilinx<br />
FPGA features in its current programming [5] scalers,<br />
dead-time locking and priority encoding, logic matrices<br />
for coincidences and configurable downscale for the<br />
individual triggers, together with a pulser output used<br />
for calibration purposes.<br />
[1] http://www.gsi.de/informationen/wti/ee/<br />
elekt_entwicklung/VME.html.<br />
[2] http://www-win.gsi.de/daq/.<br />
[3] http://fy.chalmers.se/~f96hajo/ucesb/.<br />
[4] P. Moritz, <strong>GSI</strong> scientific report 2006, FAIR-<br />
ACCELERATORS-20, and Physical Review Special<br />
Topics - Accelerators and Beams 12 (2009), 042801.<br />
[5] http://www.gsi.de/onTEAM/source/informationen/<br />
wti/ee/elekt_entwicklung/trigger_LAND.pdf
<strong>GSI</strong> SCIENTIFIC REPORT 2009 INSTRUMENTS-METHODS-31<br />
R3BRoot: a ROOT based Simulation and Analysis framework for R3B<br />
Introduction<br />
R3BRoot is a versatile and fully ROOT based framework<br />
aiming for the simulation and analysis of the R3B experiment<br />
[1]. In particular for the simulation part it uses Fair-<br />
Root [2] base class library as a layer upon ROOT and the<br />
Virtual Monte Carlo [3].<br />
The R3B experiment<br />
The aim of the R3B international collaboration is to develop<br />
and construct a versatile reaction setup with high efficiency,<br />
acceptance, and resolution for kinematically complete<br />
measurements of reactions with high-energy radioactive<br />
beams. The setup will be located at the focal plane of<br />
the high-energy branch of the Super-FRS [4].<br />
Structure of the Framework<br />
The structure of the framework is presented schematically<br />
in Fig. 1. The main class FairRunManger handles<br />
the overall program flow and the communication between<br />
different modules, namely Geometry Interface, RunTime<br />
DataBase , Event Generators, IO Manager and the Virtual<br />
Monte Carlo. The latter is an interface to differents Monte<br />
Carlo engine (Geant3, Geant4 and Fluka) allowing the user<br />
to choose at runtime which of these engine to use for the<br />
simulation.<br />
Figure 1: The R3BRoot Framework<br />
R3B Simulation<br />
R3BRoot uses the ROOT Geometry Modeller to<br />
uniquely describe the R3B detector geometry for all Monte<br />
Denis Bertini for the R3B Collaboration 1<br />
1 <strong>GSI</strong>, Darmstadt, Germany<br />
Carlo engine. Currently all detectors of the R3B experiment<br />
are described in R3BROOT. Common Event Generators<br />
like UrQMD, EvtGen and dedicated ones can be used<br />
as an input to the Run Manager class.<br />
Figure 2: Inner Tracker and Calorimeter in R3BRoot.<br />
Figure 3: Inner Tracker and Calorimeter with tracks visualisation.<br />
Conclusion<br />
The R3BRoot is a versatile and portable framework for<br />
the R3B experiment. The description of detector components<br />
and the tools for the reconstruction is in progress.<br />
References<br />
[1] http://root.cern.ch<br />
[2] The Fair Simulation and Analysis Framework, Journal of<br />
Physics: Conference Series 119 (2008) 032011<br />
[3] The Virtual Monte Carlo, I. Hrivnacova , Computing in High<br />
Energy and Nuclear Physics, 24-28 March 2003, La Jolla<br />
California.<br />
[4] http://www.gsi.de/forschung/kp/kp2/collaborations/R3B/<br />
311
INSTRUMENTS-METHODS-32 <strong>GSI</strong> SCIENTIFIC REPORT 2009<br />
Large Area High Rate Diamond Tracking Detectors for R 3 B ∗<br />
S. Schwertel † 1 , R. Gernhäuser 1 , R. Krücken 1 , O. Lepyoshkina 1 , and S. Winkler 1<br />
Introduction<br />
Diamond is radiation hard and shows fast signal collection.<br />
This makes it an ideal material for in beam tracking<br />
detectors as they are required for the R 3 B experiment.<br />
In several tests using highly ionizing heavy ions the radiation<br />
hardness was verified up to a dose of 2.5 × 10 13<br />
ions/cm 2 and a time resolution of στ ≈ 60 ps [1] was measured<br />
on small sample detectors made of 100 µm PC (polycrystalline)<br />
CVD (chemical vapour deposition) diamond.<br />
Highly Segmented Diamond Detectors<br />
Beam detectors for the R 3 B experiment have to be thin<br />
in order to minimize multiple scattering and secondary reactions<br />
and have to cover quite large areas of 50 × 50 mm 2 .<br />
This size only can be realized by using PC CVD diamond,<br />
which is available in thin layers (d > 50 µm) and areas up<br />
to 6”.<br />
A detector of thickness of d = 100 µm and a position<br />
resolution of 200 µm would fulfill the requirements for the<br />
R 3 B tracking. The final detector will have 200 µm pitch in<br />
x and 1 to 2 mm in y direction.<br />
The disadvantage of PC diamond is the reduced and nonisotropic<br />
charge collection efficiency, which is typically 10<br />
to 30 %. Due to the large energy loss this is not a limiting<br />
factor in case of heavy ions. But the internal structure<br />
of the PC CVD material, which grows in narrow columns<br />
of a typical size of a few 10 µm might reduce the charge<br />
collection to zero between the metallized segments.<br />
To test this, SNAKE [2], the superconducting nanoscope<br />
for applied nuclear physics at the Munich Tandem accelerator<br />
was used. The samples were 10 × 10 mm 2 diamonds,<br />
which were segmented in 64 metallized strips with Al of<br />
width 110 µm and a pitch of 140 µm. These samples were<br />
scanned point by point in steps of 2 µm in x- and 3 µm<br />
in y-direction and the signal amplitudes were recorded for<br />
each position.<br />
y position [µm]<br />
250<br />
200<br />
150<br />
100<br />
50<br />
Entries<br />
Mean x<br />
x position [µm]<br />
2000<br />
1800<br />
1600<br />
1400<br />
1200<br />
1000<br />
800<br />
600<br />
400<br />
200<br />
0<br />
0 20 40 60 80 100 120 140 160 180 200<br />
1 TU München, Physik-Department E12, Garching<br />
Aluminum strip<br />
Gap<br />
Aluminum strip<br />
30 µm<br />
110 µm<br />
Figure 1: Left: Amplitude map of two highly segmented<br />
strips. Right: Schematic of segmentation.<br />
The lefthand side of Fig. 1 shows the amplitude map of<br />
this measurement. Nicely the different grain sizes inside<br />
∗ Work supported by <strong>GSI</strong>, BMBF (06MT9156), DFG (Exc. Clust. 153-<br />
Universe)<br />
† sabine.schwertel@ph.tum.de<br />
312<br />
the material could be seen. Also a significant signal drop is<br />
located between two strips which is only 15 to 20 µm wide,<br />
whereas the gap is 30 µm as shown on the righthand side<br />
of Fig. 1. This means a smaller gap of about 15 to 20 µm<br />
(according to the crystallite size) should result in full efficiency.<br />
This highly segmented metallization is possible by<br />
using the same lithographic technics and was already applied<br />
for a medium-size prototype (25.4 × 25.4 mm 2 ) used<br />
in the beam test performed at the ALADIN/LAND setup.<br />
A 300 µm thick, medium-size prototype with a segmentation<br />
of 128 microstrips (190 µm pitch, 30 µm gap) on<br />
the frontside (x-direction) for position measurement and<br />
16 strips (1.5 mm pitch, 50 µm gap), on the backside (ydirection)<br />
has been produced. This prototype was tested<br />
in the S327 test experiment using a 600 AMeV 12 C beam<br />
with a diameter of about 5 mm. The detector was mounted<br />
in the beamline between the scintillator for the start signal<br />
for TOF measurement and the position sensitive diode in<br />
front of the target.<br />
To provide self triggering and a maximum efficiency, the<br />
backside signals were read by charge-integrating preamplifiers,<br />
followed by shapers.Timing filter amplifiers and a<br />
constant fraction discriminator were used for triggering.<br />
The frontside strips were read-out by two APV25 chips<br />
[3]. Both chips are connected to the <strong>GSI</strong> MBS readout via<br />
a GTB bridgeboard [4], on which four ADCs are located.<br />
The measured signal of the beam is clearly separated<br />
from the noise. A correlation with existing beam tracking<br />
detectors shows an efficiency of 93 % as expected from the<br />
measurements described before and a nice position resolution<br />
of 200 µm, which fulfills the requirements of the R 3 B<br />
experiment.<br />
Summary and Outlook<br />
The APV25 chip readout shows good performance. For<br />
parallel measurement of position and time, further development<br />
of new electronics is required. This is one of the<br />
next steps. Large area detector material (50 × 50 mm 2 )<br />
was delivered and is ready for production. Still the material<br />
treatment before metallization is an important issue for<br />
detectors of good performance and low leakage current under<br />
irradiation. Beside the standard cleaning methods we<br />
are currently investigating a precoating with a thin layer of<br />
carbon from a laser plasma. First tests showed very promising<br />
results of this method.<br />
References<br />
[1] S. Schwertel, PhD thesis TU München, 2009<br />
[2] G. Datzmann, NIM B 210(2003)<br />
[3] M. Raymond et. al., Proceedings of 4th workshop on electronics<br />
for LHC experiments,2000<br />
[4] M. Böhmer, PhD thesis TU München, 2006
<strong>GSI</strong> SCIENTIFIC REPORT 2009 INSTRUMENTS-METHODS-33<br />
Geiger APDs as possible Photon Counter for Cherenkov Detectors ∗<br />
B. J. Roy 1,2 , H. Orth 1 , C. Schwarz 1 , A. Wilms 1 , J. Schwiening 1 , and K. Peters 1<br />
1 HAD-1, <strong>GSI</strong>, PlanckStr.1, Darmstadt - 64291, Germany; 2 Also at NPD, BARC, Mumbai -400 085 India<br />
Geiger APDs, also called Silicon photomultiplier<br />
(SiPM), are very new type of photon counting devices<br />
that show great promise to be used as detection device in<br />
combination with scintillators/Cherenkov radiators. SiPM<br />
is an avalanche photo-diode operated in limited Geiger<br />
mode. They have been considered as potential readout<br />
devices for DIRC counter of the PANDA detector which is<br />
one of the large experiment at FAIR- the new international<br />
facility to be built at <strong>GSI</strong>, Darmstadt. It is essentially<br />
an opto-semiconductor device with excellent photon<br />
counting capability and possesses great advantages over<br />
the conventional PMTs because of low voltage operation<br />
and insensitivity to magnetic fields. A SiPM consists of<br />
a matrix of micro cells, typically between 100 and 10000<br />
per mm 2 . Each micro cell acts as digital device where<br />
the output signal is independent of the number of photons<br />
absorbed. When all the cells are connected in parallel,<br />
the SiPM becomes an analog device thereby allowing the<br />
number of incident photons to be counted.<br />
Different types of SiPM manufactured by Hamamatsu<br />
and Zecotek with different sizes of pixels and active area<br />
have been tested by us using the set-up at <strong>GSI</strong> and Goethe<br />
University, Frankfurt. A list is provided in Table 1.<br />
Table 1: SiPM details: MPPC1 and MPPC2 are from<br />
Hamamatsu and MAPD3N is from Zecotek.<br />
Device Active Area Pixel size Pixel Density<br />
[mm 2 ] [µm] [1/mm 2 ]<br />
MPPC1 (1x1) 100 100<br />
MPPC2 (1x1) 25 1600<br />
MAPD3N (3x3) 7 15000<br />
In fig.1 and Fig.2, we plot the photon detection efficieny<br />
(PDE) distribution as a function of the wavelength λ for<br />
Zecotek make MAPD3N and Hamamatsu make MPPC. It<br />
is to be noted that the present data for MPPC shows much<br />
broader distribution extended over larger wavelength range<br />
as compared to the report of Hamamatsu. Temperature dependence<br />
of dark current and radiation hardness study are<br />
being planned. For radiation hardness study we may use<br />
the APSARA reactor at Mumbai and for temperature dependence<br />
study, a Peltier cooling device is being developed<br />
at <strong>GSI</strong>.<br />
∗ Work supported by HIC4FAIR.<br />
Figure 1: Photon detection efficiency distribution of<br />
MAPD3N as a function of wave length normalized with<br />
data from ref.[1] at λ = 450 nm.<br />
Figure 2: Photon detection efficiency distribution of MPPC<br />
normalized with data from ref.[2] at λ=450 nm.<br />
References<br />
[1] D. Renker, PSI (private communication).<br />
[2] N. Anfimov, Dubna (private communication).<br />
313
INSTRUMENTS-METHODS-34 <strong>GSI</strong> SCIENTIFIC REPORT 2009<br />
Development of a GEM-TPC prototype and its integration in FOPI ∗<br />
M. Berger 1 , F. Cusanno 1 , L. Fabbietti 1 , and the GEM-TPC Collaboration<br />
1 TU München - Excellence Cluster Universe, 85748 Garching<br />
The use of GEM foils for the amplification stage of a<br />
TPC instead of a conventional MWPC allows one to bypass<br />
the necessity of gating, as the back drift is suppressed<br />
thanks to the asymmetric field configuration. This way, a<br />
novel continuously running TPC, which represents one option<br />
for the PANDA [1] central tracker, can be realized.<br />
The continuous readout of the central tracker is necessary<br />
due to the feature of the beam. In 2009 the design and the<br />
assembling for the readout plane (see Fig. 1) of a GEM-<br />
TPC prototype has been finished. The 702 mm long drift<br />
cages are under construction. The drift volume will have<br />
an internal diameter of 105 mm and an external diameter<br />
of 300 mm. The readout plane consists of a four layer PCB<br />
with 10296 pads. To obtain a more uniform charge distribution<br />
on the pads, it has been decided to use hexagonal<br />
pads, where the distance to the neighboring pads is equal<br />
in every direction. Furthermore the readout plane will be<br />
Figure 1: The readout plane, seen from the side of the connectors.<br />
equipped with 6 uniform distributed temperature sensors.<br />
For the uniformity of the field lines ending at the readout<br />
plane, grounded copper areas were added at the edges of<br />
the active area. The design and testing of the front-end<br />
cards, which will be equipped with the AFTER [2] chip,<br />
is completed, the cards mass-production is currently ongoing.<br />
The GEM-TPC prototype will be commissioned in the<br />
FOPI apparatus at <strong>GSI</strong>, therefore the TPC data acquisition<br />
system has to be integrated in the MBS framework used for<br />
the FOPI DAQ. The diagram of the integration is shown in<br />
Fig. 2. The Trigger Control System module (TCS) of the<br />
314<br />
∗ Work supported by HGF and DFG-Excellence Cluster Universe<br />
Figure 2: The scheme of the integration of the GEM-TPC<br />
DAQ in FOPI.<br />
GEM-TPC [4] is installed in a FOPI crate. It gets control<br />
signals from FOPI and sends out triggers to the GEM-TPC<br />
readout modules (GeSiCA) accordingly. TCS also sends<br />
out to the FOPI system its deadtime signal. An additional<br />
GeSiCA (GeSiCA1) has been installed in the FOPI crate,<br />
in order to read the “time-stamps” from the event headers<br />
via the MBS CPU (RIO3). Dedicated VME scripts have<br />
been adapted for the RIO CPU in order to operate TCS and<br />
GeSiCA in the FOPI crate.<br />
The readout of the signals from the GEM-TPC has been operated<br />
in a separate VME crate, managed for the first time<br />
by a MEN A20 CPU [5]. The proper VME drivers for the<br />
MEN A20 module were selected, tested and installed and<br />
the mySQL-based config server [4] was adapted as well.<br />
A data-sender code has been implemented in the spillbuffer<br />
computer (ROB) operating the readout via HOLA<br />
S-Link [3]. The data-sender, based on TCP protocol, sorts<br />
out the data from the GEM-TPC event buffer to a datareceiver<br />
computer in MBS. Then the data-receiver merges<br />
the events with the data from the other detector in the FOPI<br />
event builder. The synchronization of the events is based<br />
on event number and spill number “time-stamp”.<br />
References<br />
[1] The PANDA Collaboration, Technical Progress Report for<br />
PANDA, <strong>GSI</strong> 2005.<br />
[2] P. Baron et al., IEEE Trans. Nucl. Sci. 55 (2008) 1744.<br />
[3] O. Bozle et al, The S-LINK Interface Specification, ECP-<br />
Division CERN, Geneva, Switzerland, 27 March 1997, also<br />
at http://hsi.web.cern.ch/HS/s-link/<br />
[4] B. Grube, A Trigger Control System for COMPASS and a<br />
Measurement of the Transverse Polarization of Λ and Ξ Hyperons<br />
from Quasi-Real Photo-Production, PhD thesis, Technische<br />
Universität München, January 2006.<br />
[5] http://www.men.de/products/vmebus.html
<strong>GSI</strong> SCIENTIFIC REPORT 2009 INSTRUMENTS-METHODS-35<br />
A Generic Monitoring System for HADES and FAIR Experiments ∗<br />
B. Milanovic 1 , U. Brinkschulte 1 , I. Fröhlich 1 , J. Michel 1 , J. Stroth 1,2 , and M. Traxler 2<br />
1 Goethe University Frankfurt, Germany; 2 <strong>GSI</strong>, Darmstadt, Germany<br />
The running DAQ upgrade for the HADES detector is<br />
nearly finished. In order to supply the new electronics with<br />
a suitable monitoring facility and to prepare for the upcoming<br />
FAIR experiments, a versatile monitoring network has<br />
been designed [1]. The HADES detector comprises a large<br />
variety of different sub-systems. However, a unification of<br />
the system bus using General-Purpose Trigger and Readout<br />
Boards (TRBs) and/or the TRBnet protocol has been successfully<br />
implemented [2]. The readout electronics, some<br />
front-ends, network hubs, as well as some data processing<br />
nodes now rely on FPGA chips [3]. Due to its generic<br />
nature, the monitoring system can be implemented on any<br />
FPGA chip. Therefore, internal hardware states of nearly<br />
every DAQ component can be monitored, reaching in some<br />
cases even into the front-end electronics (FEE), as shown<br />
in figure 1.<br />
The monitoring system supports all currently used subdetectors.<br />
It has been designed resource friendly and highly<br />
customizable in order to suit upcoming FAIR detectors as<br />
well. Since all detector data needs to pass readout nodes<br />
and network hubs before getting used for trigger analysis<br />
and event reconstruction, the monitoring system integrated<br />
on these chips gains direct access to all digitized detector<br />
data. After defining the monitoring signals, which are a<br />
subset of all data packs, they are forwarded to the monitoring<br />
system over an internal interface. The system then<br />
buffers the signals directly on the FPGA chips using either<br />
simple register cells or adaptable FIFOs. The buffering process,<br />
which additionally timestamps the data allows three<br />
different timer domains for appropriate signal synchronization.<br />
Each FIFO gathers the data automatically with a preset<br />
frequency until it gets full. Furthermore, a ringbuffer<br />
mode is supported preventing the FIFO from getting full<br />
at the cost of storing only the newest data signals. It is<br />
possible to change FIFO properties in order to store any<br />
desired monitoring signal by choosing the correct depth,<br />
width, frequency, timer and data splitting method. Data<br />
packs stored inside are actually composed of three parts:<br />
raw data, timestamp and the current event number.<br />
The readout of the monitoring signals is performed over<br />
a designated TRB residing anywhere in the optical network.<br />
The TRB runs a monitoring server application on<br />
its Linux system. The server can send instructions through<br />
the entire TRBnet using the optical link and command every<br />
monitoring chip to send its FIFO and register contents.<br />
Moreover, the server is connected to one or more monitoring<br />
clients over Ethernet and thus represents the bridge<br />
between the user and the monitoring facility. Any user that<br />
∗ Work supported by EU (CNI contact No. 506065), BMBF and HIC-<br />
for-FAIR<br />
gains access to the clients can in this way send instructions<br />
to the server obtaining appropriate monitoring signals and<br />
visualizing them locally using EPICS [4]. The compatibility<br />
with the EPICS API has been demonstrated.<br />
One huge advantage of the presented system is that every<br />
client automatically reconstructs the entire monitoring<br />
setup. Besides the system itself, the FPGA chips additionally<br />
contain a simple ROM module which stores the entire<br />
monitoring setup on that particular chip. Whenever a client<br />
connects to the server, all ROMs are read out in advance<br />
providing the client with all the necessary data regarding<br />
FIFO properties, register numbers and addresses. Such approach<br />
allows changes in one system without affecting the<br />
entire monitoring network.<br />
Figure 1: An exemplary monitoring scheme. The monitoring<br />
system can be integrated either on front-ends, TRBs or<br />
TRB add-on boards (e.g. readout boards and hubs).<br />
References<br />
[1] B. Milanovic, Development of a Real-Time General Purpose<br />
Online Monitoring System for HADES and FAIR Experiments,<br />
diploma thesis, Goethe University, Frankfurt 2009.<br />
[2] J. Michel, Development of a Realtime Network Protocol for<br />
HADES and FAIR Experiments, diploma thesis, Goethe University,<br />
Frankfurt 2008.<br />
[3] M. Palka et al, ”The new data acquisition system for the<br />
HADES experiment”, Nuclear Science Symposium Conference<br />
Record, NSS 08. IEEE, pages 1398 –1404, 2008.<br />
[4] Experimental Physics and Industrial Control System,<br />
”http://www.aps.anl.gov/epics/”.<br />
315
INSTRUMENTS-METHODS-36 <strong>GSI</strong> SCIENTIFIC REPORT 2009<br />
��������������������������������������������<br />
��������������������������������������������������������<br />
��������� � ��� � ��� � ��� ����� � �������� � ���� � ����������<br />
�������������<br />
�����������������������������������������������������<br />
��� � ���� � ��� � �������� � ��� � ��� � ��� � ���� � ����������<br />
����������������������������������������������������������<br />
�����������������������������������������������������<br />
����� � ������������� � �� � ��� � ������ � ��������������� � �����<br />
�������������������������������������������������������<br />
��������������������������������������������������������<br />
��������������������������������������������������������<br />
�� � ������ � ����� � ��� � �������� � ����� � ��� � ��� � �����<br />
���������������������������������������������������<br />
���������������������<br />
������������������������������������������������������<br />
����������������������������������������������������������<br />
���� � ����� � ������ � ����� � ������������ � �� � ��� � ��������� � ���<br />
�������<br />
������ � ���� � ����� � ��� � ���� � ���������� � ��� � ��� � �������<br />
��������������������������������������������������������<br />
����� � ������������������������� � ���������������������<br />
�������������������<br />
������ � ��� � ��� � ���� � ����������� � ���� � ������ � ���� � ����<br />
������������������������������������������������������������<br />
���������������������������������������������������������<br />
����������������������������������������������������������<br />
���� � �������� � � � ��������� � �� � ��� � ��� � � � ����� � ����<br />
���������������������������������������������������������<br />
������������������������������������������������������<br />
������������������������������������������������������������<br />
�������������<br />
�������������������������������������������������������<br />
������������������������������������������������������<br />
�����������������������������������������������������<br />
����������<br />
��� ��������������������������������������������������<br />
��������<br />
��� ��������������������������������������������������<br />
��������<br />
��� �� � ��� � �� � ��� � ���� ������� � ����� � ���� � �� � ���������<br />
�����<br />
���������������������������������������������������������������������������������������������������������������������������<br />
��������������������������������������������������������������������������������������������������������������������������<br />
������������������������������������<br />
�� ���� � ���� � ��� � ��������� ��� � ��� ����� � ��������<br />
����������� � ��� � ��� � ������ � ������������� � ����<br />
���������������������<br />
316<br />
<strong>GSI</strong>Template2007
<strong>GSI</strong> SCIENTIFIC REPORT 2009 INSTRUMENTS-METHODS-37<br />
The HADES Event Building System ∗<br />
S. Yurevich 1 , M. Böhmer 2 , G. Korcyl 6 , J. Michel 3 , J. Stroth 3,1 , and M. Traxler 1<br />
1 <strong>GSI</strong> <strong>Helmholtzzentrum</strong> <strong>für</strong> <strong>Schwerionenforschung</strong> GmbH, 64291 Darmstadt, Germany; 2 Technische Universität,<br />
80333 München, Germany; 3 Institut <strong>für</strong> Kernphysik Goethe-Universität, 60486 Frankfurt, Germany; 6 Jagiellonian<br />
University, 30-059 Krakow, Poland<br />
The upgraded HADES experiment will perform the measurements<br />
with heavy collision systems (up to Au+Au)<br />
at SIS18 and then will move to the upcoming FAIR accelerator<br />
complex. The HADES Data Acquisition System<br />
combines readout electronics and TRB-Net [1] with<br />
off-the-shelf computers in a parallel architecture interconnected<br />
with Ethernet. The complete data-flow breaks down<br />
into the following elements: from the Front-Ends the data<br />
is transported over TRB-Net via optical 2 Gb/s links to<br />
HUB2-AddOn boards where the data is packed in a special<br />
HADES data format and sent to the Event Builders<br />
(EB) over Gigabit Ethernet (GbE). Event Builders merge<br />
subevents from the different detector subsystems to a complete<br />
event and write the event to a mass storage system.<br />
Detailed description of the HADES DAQ is given in [2]<br />
and the HADES upgrade report can be found in [3].<br />
The major task of the DAQ is to read the data from the<br />
detectors with rates up to 250 MB/s sustained and to cope<br />
with the trigger rates up to 100 kHz. The FPGA-based implementation<br />
of GbE in the HUB2-AddOn board provides<br />
the ability to send the data gathered from the Front-Ends<br />
much faster taking use of the standard GbE infrastructure.<br />
The GbE VHDL entity creates the transport queues consisting<br />
of subevents and sends the queues in UDP packets via<br />
optical fibers to the EBs. The maximum size of the queue<br />
can be set by the user. The logic will buffer the incoming<br />
data until the size is met. A connection between the<br />
HUB and the GbE-switch is established by an autonegotiation<br />
feature. GbE together with TRB-Net logic uses about<br />
20 % of resources of Lattice FPGA (LFE2M100) and 34 %<br />
of available memory <strong>block</strong>s, being a lightweight add-on to<br />
the existing functionality and therefore can be integrated in<br />
all subsystems.<br />
To accumulate large amount of the data a parallel event<br />
building concept is used. In the Front-End Electronics<br />
(FEE) the data are packed in queues and sent to a number of<br />
EBs using a round robin approach. Because the subevent<br />
sizes differ among detector subsystems by a factor of 10,<br />
the EB stores subevents in the buffers of variable size improving<br />
the efficient use of memory. The advantage offered<br />
by parallel event building is that it can adapt to any data rate<br />
by adding more event builders (load sharing). When using<br />
10 EBs at 20 kHz LVL1 trigger rate, the data rate will decrease<br />
down to some 25 MB/s per EB resulting in an event<br />
rate of 2 kHz per EB. The parallel event building scheme<br />
has been tested with 90 data sources and 2 event builders.<br />
∗ Work supported by EU grant 515876 and 227431<br />
It has shown a stable operation even with the data rates<br />
exceeding the expected by a factor of three. Furthermore,<br />
several schemes of mass storage can be used in parallel: direct<br />
recording of the data stream to the tape via the RFIO<br />
mechanism [4], writing the data to the local hard disks on<br />
the EB (160 TB available), transmitting the data via a high<br />
speed link to the Lustre distributed files system [5]. To<br />
manage parallel data streams to the mass storage systems<br />
the fast 10 Gb/s connection is used. Several event building<br />
processes will run on one server equipped with 12 cores,<br />
44 TB hard disk space, 64 GB memory, 10 Gbps PCI Express<br />
NIC. Four servers will be connected to a 10 Gbps<br />
switch (see Fig. 1).<br />
Figure 1: The event building system.<br />
The distributed event building requires a central monitoring<br />
system. A slow control interface based on the<br />
EPICS software and graphical user interface for the monitoring<br />
of a number of EBs have been implemented and<br />
tested. To achieve synchronization of the event building<br />
processes and to provide communication between them a<br />
master/slave model has been implemented where a master<br />
EB controls all slave EBs. All the important information<br />
will be saved in the Oracle data base via a client application<br />
running on each EB server.<br />
References<br />
[1] J. Michel et al, “The New HADES Data Acquisition Network”,<br />
this volume<br />
[2] M. Palka et al, Proceedings of IEEE NSS, October 2008,<br />
Dresden, Conference Record N06-6<br />
[3] S. Yurevich et al, “Upgrade of the HADES Experiment”, this<br />
volume<br />
[4] H. Göringer et al, this volume<br />
[5] W. Schön et al, this volume<br />
317
INSTRUMENTS-METHODS-38 <strong>GSI</strong> SCIENTIFIC REPORT 2009<br />
The New HADES Data Acquisition Network ∗<br />
J. Michel 1 , M. Böhmer 3 , I. Fröhlich 1 , G. Korcyl 4 , M. Palka 4 , J. Stroth 1,2 , A. Tarantola 1 , and<br />
M. Traxler 2<br />
1 Institut <strong>für</strong> Kernphysik, Goethe-Universität Frankfurt, Germany; 2 <strong>GSI</strong>, Darmstadt, Germany; 3 Technische Universität<br />
München, Germany; 4 Jagiellonian University, Krakow, Poland<br />
In the framework of the current upgrade of the HADES<br />
DAQ and Trigger System the complete data acquisition network<br />
and read-out scheme has been redesigned. As described<br />
in [1], the hardware is based on front end boards<br />
equipped with FPGAs and optical transceivers. In total, the<br />
complete network will contain over 530 FPGAs and about<br />
the same number of optical transceivers. On this optical<br />
network, data is transported using a dedicated network protocol.<br />
Details about this Trigger and Readout Board Network<br />
(TrbNet) can be found in [2]. A unified front-end has<br />
been designed to simplify accessing the network, including<br />
features for distributing trigger information, data read-out<br />
and monitoring.<br />
In the new DAQ network, distributing triggers is a threestep<br />
process. First, the central trigger system (CTS) sends a<br />
timing trigger pulse over dedicated PECL or LVDS connections<br />
to all subsystems. This pulse is followed by a LVL1<br />
trigger being sent over the optical network. Here, all information<br />
like trigger number and trigger type as well as reliability<br />
features to check data integrity are included. The last<br />
step is the response of each front-end board to notify the<br />
CTS that the event has been successfully stored in internal<br />
memories.<br />
The user-interface is kept very simple: All information<br />
is given to the user on separate ports along with a trigger<br />
strobe. The reply to the CTS is then generated automatically,<br />
hidden from the user. All the user has to do is setting<br />
one signal to start sending the answer.<br />
The data read-out is done independently from the trigger<br />
logic using the same optical links. Here, the CTS sends a<br />
request to all front-ends requiring data of a specific event.<br />
The data is then equipped with a fixed data header (DHDR)<br />
containing the event information and data length as well as<br />
the network address of the front-end. In the network hubs,<br />
data from several front-ends are merged to a single data<br />
stream based on the information given in the DHDR.<br />
Afterwards, data has to be forwarded to the Event<br />
Builders (PCs) collecting data from all subsystems and<br />
writing them to storage memory. Due to the huge amount<br />
of data (250 MByte/s), data has to be distributed to several<br />
PCs. In [3] the HADES event building system is described<br />
in detail.<br />
The interface between DAQ electronics and the Eventbuilder<br />
system is done using optical Gigabit Ethernet links<br />
[1]. In the FPGAs on TrbNet hubs data is converted to UDP<br />
packets using the standard HADES event data format.<br />
Our standardized interface for all subsystems also con-<br />
318<br />
∗ Work supported by EU grant 515876 and BMBF<br />
Figure 1: A schematic view of the HADES DAQ network<br />
including the central trigger system (CTS), Eventbuilders<br />
(EB) and Frontends (FEE).<br />
tains extensive features for status monitoring and controlling<br />
of all data acquisition hardware. Basic functions like<br />
various read/write - registers are provided by the interface.<br />
More elaborate functions like memories and fifos,<br />
can be connected using a data bus and a 16bit wide address<br />
space. Environmental status information like temperature<br />
and voltages can be easily monitored and settings for the<br />
front-end electronics can be altered dynamically. Network<br />
management features like a DHCP-like assignment of addresses<br />
are also included.<br />
For this interface a complete monitoring system with<br />
many different options has been developed [4]. With<br />
this system, each sub-detector has its own custom-made<br />
monitoring features but the interface is kept standardized<br />
throughout all detectors.<br />
So far, the network protocol has been implemented on<br />
all subsystems of the HADES detector. Commissioning of<br />
the new read-out hardware of the RICH detector has been<br />
completely based on this network setup and has been finished<br />
successfully. The newly installed MDC electronics<br />
has also been commissioned using the TrbNet design.<br />
The CBM-MVD collaboration plans to use TrbNet for<br />
the read-out of the micro vertex detector of the CBM experiment<br />
at FAIR. The adaption of the protocol to a tokenring-like<br />
network structure is being considered as well.<br />
References<br />
[1] S. Yurevich et al., this volume.<br />
[2] J. Michel, “Development of a Realtime Network Protocol<br />
for HADES and FAIR Experiments”, diploma thesis, Univ.<br />
Frankfurt 2008. [<strong>GSI</strong>-Doc: DOC-2008-Oct-34-1.pdf]<br />
[3] S. Yurevich et al., The HADES Event Building System, this<br />
volume.<br />
[4] B. Milanovic et al., this volume.
<strong>GSI</strong> SCIENTIFIC REPORT 2009 INSTRUMENTS-METHODS-39<br />
Development of a large-scale VUPROM system<br />
as tracking trigger for the KAOS spectrometer<br />
A. Esser ∗1 , S. Sánchez Majos 1 , P. Achenbach 1 , S. Minami 2 , J. Pochodzalla 1 , and T. R. Saito 1,2<br />
1 Inst. <strong>für</strong> Kernphysik, Joh. Gutenberg-Universität, Mainz, Germany; 2 <strong>GSI</strong>, Darmstadt, Germany<br />
The VME Universal Logic Modules VULOM and<br />
VUPROM were developed at the Experiment Electronics<br />
Department of <strong>GSI</strong> for general purpose logic operations.<br />
During the last 2 years, first modules were applied as tracking<br />
triggers in experiments at <strong>GSI</strong> and at the Mainz Microtron<br />
MAMI [1]. A large-scale VUPROM system with<br />
several thousand input channels is now in operation for the<br />
triggering of the hadron arm as well as the electron arm of<br />
the KAOS spectrometer at MAMI.<br />
The KAOS spectrometer is maintained by the A1 collaboration<br />
with a focus on the study of (e, e ′ K + ) coincidence<br />
reactions. For its electron arm tracking system two vertical<br />
planes of fibre arrays (x- and θ-plane), each covering an active<br />
area of 1600 × 300 mm 2 with 2 304 read-out channels,<br />
are operated close to zero degrees scattering angle and in<br />
close proximity to the electron beam.<br />
A sophisticated trigger logic implemented in VUPROM<br />
modules was developed in order to to minimize accidental<br />
trigger rates in the electron arm instrumentation.<br />
The trigger must satisfy the following requirements:<br />
(i) detection of signal clusters in each detector plane;<br />
(ii) reconstruction of particle tracks through both planes;<br />
(iii) acceptance test for all reconstructed particle tracks;<br />
(iv) expandability to build a missing-mass trigger by combination<br />
with the hadron arm trigger;<br />
(v) on-line access and control of trigger parameters.<br />
The hardware set-up comprises 37 VUPROM modules<br />
with 256 I/O channels each. Each 6U VME module is<br />
equipped with a Virtex-4 FPGA chip, capable of operating<br />
at 400 MHz. This set-up allows easy reprogramming via<br />
VMEbus. Furthermore, output and control information is<br />
accessible during trigger operation.<br />
The modules are arranged in 4 stages. In the first stage<br />
signal clusters are detected, and the position information is<br />
passed on to the next stage. The signals from both planes<br />
are processed separately in the first and the second stage,<br />
which consists of 6 modules with the purpose of reducing<br />
the number of channels, and providing the same position<br />
information on several outputs.<br />
In the third stage the position information from the first<br />
stage of the x-plane and the second stage of the θ-plane are<br />
checked for temporal coincidences and used to perform an<br />
acceptance test for the reconstructed tracks.<br />
The last stage consisting of a single module receives the<br />
information of accepted trajectories from the third stage<br />
and produces the trigger output signal.<br />
Due to the geometrical arrangement of the fibres, a particle<br />
hit always causes a cluster of correlated signal in neigh-<br />
∗ aesser@kph.uni-mainz.de<br />
Table 1: Measured trigger rates in the electron arm of the<br />
KAOS spectrometer during beam-tests at MAMI in 2009.<br />
trigger rate (kHz)<br />
raw signal rate 1120 ± 30<br />
clusters in x 47.0 ± 0.2<br />
clusters in θ 37.3 ± 0.2<br />
x OR θ 83.9 ± 0.3<br />
x AND θ 0.49 ± 0.02<br />
random coincidences 0.140 ± 0.001<br />
bouring channels [2]. Signal clusters are identified by requesting<br />
a signal in n neighbouring channels within a given<br />
time period. By requesting the absence of a signal in the<br />
next higher and lower channel, it is guaranteed that the<br />
found cluster is exactly of the size n. Short pulses which<br />
are the result of different delays in the input signals are<br />
suppressed by a pulse-width discriminator. An upper and<br />
lower boundary for the accepted cluster sizes is specified.<br />
Clusters with a size above the given upper boundary are vetoed<br />
to reduce background from scattered particles, hitting<br />
the detector planes under large angles with respect to the<br />
normal on the detector plane. The position of each cluster<br />
is transmitted to the next stage by setting one bit in an<br />
32-bit wide output bus.<br />
For performing the acceptance test, the allowed combinations<br />
of hit positions in both planes are stored in a binary<br />
matrix. This matrix is externally computed. An output signal<br />
is produced when a cluster is found on both detector<br />
planes and the corresponding matrix element is non-zero.<br />
Each VUPROM in the third stage evaluates a range of 384<br />
channels of the x-plane and up to 1 536 channels of the<br />
θ-plane. This set-up was chosen to cover the angular acceptance<br />
known from simulations with the highest possible<br />
granularity. The position resolution for the acceptance test<br />
is 6 channels in the x-plane (4.98 mm) and 12 channels in<br />
the θ-plane (9.96 mm).<br />
The trigger for the electron arm was successfully tested<br />
during two beam-times in July and August 2009. Raw signal<br />
rates of several MHz were observed, measured trigger<br />
rates are shown in Table 1.<br />
References<br />
[1] S. Minami et al., <strong>GSI</strong> Scientific Report (2007) p. 223; S. Minami<br />
et al., <strong>GSI</strong> Scientific Report (2008) p. 52; S. Sánchez<br />
Majos et al., <strong>GSI</strong> Scientific Report (2007) p. 170.<br />
[2] P. Achenbach, L. Nungesser, J. Pochodzalla, Nucl. Inst.<br />
Meth. in Phys. Res. A 591, (2008) 406.<br />
319
INSTRUMENTS-METHODS-40 <strong>GSI</strong> SCIENTIFIC REPORT 2009<br />
Counts<br />
Prototype aerogel Čerenkov counter for kaon/pion separation ∗<br />
L. Debenjak 1,2 , P. Achenbach † 2 , J. Pochodzalla 2 , T. R. Saito 2,3 , and S. ˇSirca 1<br />
1 JSI, Ljubljana, Slovenia; 2 KPH, Joh. Gutenberg-Universität, Mainz, Germany; 3 <strong>GSI</strong>, Darmstadt, Germany<br />
10 5<br />
10 4<br />
10 3<br />
10 2<br />
10<br />
1<br />
1000 1500 2000<br />
Analogue sum (ADC cnts)<br />
Figure 1: The analogue sum spectrum of both PMTs for<br />
events identified by the detector package of the spectrometer<br />
as pions (green) and protons (blue). The unshaded<br />
spectrum corresponds to all particles entering the Čerenkov<br />
counter. Protons were below the Čerenkov light emission<br />
threshold.<br />
Simulated Counts<br />
1000<br />
900<br />
800<br />
700<br />
600<br />
500<br />
400<br />
300<br />
200<br />
100<br />
electrons<br />
pions<br />
0<br />
0 2 4 6 8 10 12 14 16 18 20<br />
No of Photoelectrons Npe<br />
Figure 2: Simulated distribution of photoelectrons for the<br />
set-ups discussed in Table 2.<br />
For hypernuclear experiments, which are currently performed<br />
at <strong>GSI</strong> (HypHI) or proposed for FAIR (PANDA)<br />
and for MAMI (A1), an unambiguous kaon identification<br />
is essential. An aerogel Čerenkov counter was designed for<br />
the KAOS spectrometer at the Mainz Microtron MAMI for<br />
the discrimination between kaons and pions of momenta<br />
p ≥ 1GeV/c.<br />
Before the construction of the final detector a smaller<br />
prototype has been built, mounted inside the KAOS spectrometer,<br />
and tested. The prototype consisted of a 20×10×<br />
10 cm 3 light collection box with a single layer of aerogel<br />
of active area 20 × 10 cm 2 . The inner walls were covered<br />
by Millipore paper and the photons were detected by two<br />
2” PMTs, attached on opposite sides. Different refractive<br />
320<br />
∗ Financed partly by the European Union, European Social Fund<br />
† patrick@kph.uni-mainz.de<br />
Table 1: Measured detection efficiencies, ǫ, for electrons<br />
and pions at various momenta, p. In one set-up the light<br />
collection box included mirrors.<br />
p (MeV/c) particles mirrors ǫ (%)<br />
380–530 electrons no 88<br />
620 pions no 90<br />
480 pions yes 65<br />
Table 2: Mean number of photoelectrons measured with<br />
different set-ups and compared to simulations.<br />
p (MeV/c) particles mirrors N exp<br />
pe<br />
N simul<br />
pe<br />
380-530 electrons no 4.2 4.8<br />
480 pions yes 3.6 3.4<br />
indices and thicknesses of the aerogel, geometries of the<br />
light collection box (e.g. including or excluding mirrors)<br />
and momenta of the incoming particles were studied.<br />
We used aerogel with n = 1.07 made by Chiba U.,<br />
Japan, which provides separation of pions and kaons in the<br />
momentum range p ≈ 365–1300 MeV/c [1]. The detector<br />
was exposed to various particle types, such as electrons,<br />
pions and protons. In Fig. 1 a representative spectrum is<br />
shown for events identified by the detector package of the<br />
spectrometer as pions and protons.<br />
The detection efficiency was determined by the ratio<br />
of events with a Čerenkov signal above a given detection<br />
threshold to the number of events reconstructed to be passing<br />
the volume of the counter. Results for different setups<br />
tested during several beam-times are shown in Table 1.<br />
When testing with pions, the prototype was rotated towards<br />
the incoming particle direction.<br />
The performance of the prototype detector was also studied<br />
with the simulation package Litrani. The number of<br />
photoelectrons, Npe, predicted by the simulation was compared<br />
to number of photoelectrons seen in the actual experiments<br />
as shown in Table 2. The simulated distribution of<br />
photoelectrons for these set-ups is shown in Fig. 2.<br />
Since the results from the experiments and the simulations<br />
are in fairly good agreement we can trust our simulations<br />
to predict and optimize the light yield of aerogel<br />
Čerenkov counters to be used in future hypernuclear experiments.<br />
References<br />
[1] L. Debenjak et al., <strong>GSI</strong> Scientific Report 2008, (2009) p. 253.
<strong>GSI</strong> SCIENTIFIC REPORT 2009 INSTRUMENTS-METHODS-41<br />
Preparation for the n-XYTER engineering run.<br />
During 2009 a comprehensive study and extensive simulation<br />
of the n-XYTER prototype ASIC have taken place at<br />
Physikalisches Institut in Heidelberg. The n-XYTER chip<br />
is realized in 0.35 µm CMOS technology. It has a 50 µm<br />
inter-channel pitch and it is capable of both time and amplitude<br />
measurement of arbitrary polarity charge pulses delivered<br />
by the detector. As a 128-channel, data-driven readout<br />
chip it is now being used as a prototype readout chip for<br />
several experiments at the Facility for Antiproton and Ion<br />
research (FAIR) and neutron scattering. An explanation of<br />
the chip architecture can be found in [1].<br />
From the test results and simulation studies, it became<br />
apparent that the n-XYTER chip needed some improvements<br />
to ease its operation in FAIR detector prototypes.<br />
The main problems seen in the tests and simulation that<br />
make the circuit tedious to operate, are the relatively high<br />
temperature sensitivity, the recently seen large voltage drop<br />
of the baseline over the chip and the large adjacent channel<br />
to channel variation, also of the baseline, of up to 400<br />
mV [2]. The voltage drop over the chip consist of two contributions.<br />
The first contribution is a uniform voltage shift<br />
(increase) over the chip from channel 0 to channel 63 of<br />
about 300 mV, and nearly the same decrease in the DC<br />
level from channel 64 to channel 127. A decrease in the<br />
DC-level with an increase in the number of active channels<br />
is also seen in test. The reasons are here the IR-drop<br />
and non-matched layout. The second contribution is the<br />
difference in the DC-level of about 400 mV seen between<br />
adjacent channels. Possible reasons for this difference are<br />
currently under investigation.<br />
The n-XYTERs temperature sensitivity has been found<br />
to be a combination of several sources. The main source<br />
is the tracking circuit, a scaled version of the preamplifier,<br />
implemented to bias the resistor Rd in the Pole-Zero network<br />
with the same DC-level as the input of the preamplifier.<br />
The drawback is that the tracking circuit is also seen<br />
by the fast and the first slow shaper inputs, both with different<br />
gain and PMOS as input transistors. The consequence<br />
is that the tracking circuit provides a temperature sensitive<br />
offset voltage at the shaper input, that is amplified by the<br />
shaper closed loop gain, contributing significantly to the<br />
voltage shift at the output of the shaper. To eliminate this<br />
effect, the tracking circuit is removed and the bias voltage<br />
will be externally supplied. Otherwise a redesign would<br />
have been necessary.<br />
A second source were the bias voltage generators for the<br />
shapers used to set their appropriate output DC-level. They<br />
are not matched to the shapers they should supply, causing<br />
a further increase in the temperature sensitivity. The<br />
temperature sensitivity of the channels has been reduced<br />
from about 30 mV/ o C and 50 mV/ o C for a typical process<br />
H.K. Soltveit 1<br />
1 Physikalisches Institut, Universität Heidelberg, Germany<br />
parameter simulation in the timing and energy channels,<br />
respectively, to a few mV/ o C for the worst case process<br />
simulation.<br />
The Peak-Detector and Hold (PDH) circuit has also gone<br />
through some design changes due to its high sensitivity to<br />
input offset voltage, giving different peak amplitudes for<br />
equal input signals.<br />
Most of the problems seen in the test should already have<br />
been noticed by the designers responsible of the full chip<br />
integration and of the implementation of the new features<br />
in the n-XYTER when doing simulations.<br />
Moreover, the Opto-process C35B4C01 employed in<br />
the previous submission is not the optimum process for<br />
a mixed-mode circuit as the n-XYTER. This can make<br />
the n-XYTER circuit vulnerable to substrate noise and to<br />
crosstalk generated in the digital part of the chip. Normally<br />
used protection techniques, as for example guard rings and<br />
the use of distance between components to shield the analog<br />
part from the digital substrate have barely an effect in<br />
CMOS technology with a low ohmic substrate. Such problems<br />
are expected to be much reduced with the use of the<br />
high ohmic substrate in the C35B4M3 process target in the<br />
engineering run.<br />
The circuit was originally designed to handle an input<br />
charge of maximum 20 fC and with a gain of about 55<br />
mV/fC and 27 mV/fC for the timing and energy channel,<br />
respectively. In the engineering run of the n-XYTER a second<br />
gain is implemented, having the possibility to set the<br />
gain to 47 mV/fC and to 8 mV/fC for both signal polarities<br />
to expand the dynamic range. This required some design<br />
modifications of the first shaper in the energy channel. Minor<br />
changes are also done on the fast-shaper (monitoring<br />
channel) to improve the driving capabilities.<br />
Status<br />
The n-XYTER, both in its previous and modified version<br />
has gone through an extensive simulation with process<br />
parameters to make the engineering run of the n-XYTER<br />
more robust. Many design and layout related problems<br />
have shown up, been understood and fixed. At the moment<br />
of writing this report, the large adjacent channel to channel<br />
DC-level variation is not fully understood. To ease the<br />
bonding of the n-XYTER, a re-structuring of some of the<br />
pads is also in progress. The submission of the improved<br />
version of the n-XYTER is foreseen when all tests and simulations<br />
are done and understood.<br />
References<br />
[1] A.Brogna, et al., Nucl.Instr. and Meth. A 568 (2006) 301.<br />
[2] C.J. Schmidt,. Private communication<br />
321
INSTRUMENTS-METHODS-42 <strong>GSI</strong> SCIENTIFIC REPORT 2009<br />
Enhancements of the Front-End-Electronics Communication Software ∗<br />
R. Keidel † 1 , S. Bablok 1,2 , and E.S. Conner 1<br />
1 ZTT, University of Applied Sciences, Germany; 2 Institutt for Fysikk og Teknologi, Universitetet i Bergen<br />
The InterComLayer (ICL) of the Front-End-<br />
Electronics communication (FeeCom) chain has been<br />
redeveloped and enhanced to adapt to the requirements<br />
which have arisen during daily usage by the pertinent<br />
detectors in ALICE. A major focus has been set on<br />
transfer performance and priority hierarchy imposed<br />
by the data transported. Transparency of the redesign<br />
to the underlying detectors has been achieved.<br />
Software Architecture<br />
The FeeCom chain consists of three layers: the Fed-<br />
Client as dedicated DIM module in the PVSS on the supervisory<br />
layer, the ICL located on the control layer and the<br />
FeeServers connected to the Front-End-Electronics (FEE)<br />
operating on the field devices.<br />
The ICL acts as distributor and collector for the system.<br />
It distributes commands issued from the supervisory<br />
layer to the FeeServers running on the field layer and<br />
collects their data and answers before relaying them further<br />
to the PVSS. Preparation of command data inside the<br />
ICL is achieved via access to the Configuration Database<br />
and detector-specific CommandCoders (CoCo) of the respective<br />
detectors. Data exchange is performed over welldefined<br />
APIs (Application Programmers Interface; FED-<br />
API (Front-End-Device - API), FEE-API, CoCo-API) [1]<br />
[2]. Data transport between the different layers employs<br />
Distributed Information Management (DIM) as the underlying<br />
protocol [3].<br />
Redesign of the InterCom Layer - ICL 2.0<br />
The implementation of the ICL 2.0 has been written in<br />
Java thereby allowing for a higher degree of platform independence.<br />
Modules and frameworks, which are still written<br />
in C++, (i.e. CoCo and DIM) are attached to the ICL via<br />
JNI (Java Native Interface) [4], thereby making the Java<br />
implementation transparent to the other parts of the setup.<br />
With the redesign of the ICL 2.0 a greater granularity of the<br />
application has been achieved. Separate agents take care of<br />
their assigned tasks:<br />
• Control Agent (CA): Relays commands to the underlying<br />
field devices and keeps track of pending acknowledgements<br />
(including ICL configuration commands<br />
as well).<br />
• Monitoring Agent (MA): Collects values published<br />
by the FeeServers and delivers them to the PVSS.<br />
∗ Work supported by <strong>GSI</strong>; Vorhaben: ALICE Softwareanwendung zur<br />
Modellierung von Prozesssteuerungsschnittstellen / EPICS; WOKEI<br />
† keidel@fh-worms.de<br />
322<br />
• Messenger: Handles the delivery and persistence (local<br />
storage) of FeeServer and ICL log messages.<br />
A sketch of the assembly with the agent redesign of<br />
the ICL 2.0 is shown in figure 1. All afore defined interfaces<br />
are reused in the implementation to ensure7 downward<br />
compatibility of the software. With the new design<br />
the differentiation between detector-specific and detectorindependent<br />
tasks is maintained.<br />
Figure 1: Three layers of the FeeCom chain with the agent<br />
redesign in the ICL 2.0. The agents (Messenger, Monitoring<br />
Agent (MA) and Control Agent (CA)) take care of their<br />
specific tasks.<br />
Summary and Outlook<br />
The reimplemented ICL will fit smoothly in the existing<br />
setup of the FeeCom chain allowing transparent use of the<br />
ICL 2.0 for the involved detectors. With the usage of Java<br />
a port of the system to different platforms can be easily<br />
achieved. The higher granularity of the ICL grants more<br />
fail safety and system stability, as well as allows for clearer<br />
separation of the involved tasks.<br />
References<br />
[1] R. Keidel, et al: Front-End-Device Application Programming<br />
Interface, <strong>GSI</strong> Scientific Report 2008 (Instruments-<br />
Methods-39), <strong>GSI</strong> Report 2009-1, May 2009, Editor: K. Groe<br />
[2] S. Bablok: Heterogeneous Distributed Calibration Framework<br />
for the High Level Trigger in ALICE, PhD Thesis, University<br />
of Bergen (Norway), printed by Allkopi, February<br />
2009, ISBN: 978-82-308-0740-8<br />
[3] C. Gaspar, M. Doenszelmann, Ph. Charpentier: DIM, a<br />
Portable, Light Weight Package for Information Publishing,<br />
Data Transfer and Inter-process Communication, Presented<br />
at: International Conference on Computing in High Energy<br />
and Nuclear Physics 2000, Padova (Italy), February 2000<br />
[4] http://java.sun.com/docs/books/jni/
<strong>GSI</strong> SCIENTIFIC REPORT 2009 INSTRUMENTS-METHODS-43<br />
Design and Implementation of an Universal Read Out Controller<br />
N. Abel 1 , S. Manz 1 , and U. Kebschull 1<br />
1 Kirchhoff Institute of Physics, Heidelberg University, Heidelberg, Germany<br />
Introduction<br />
Since 2007 our contribution focused the Silicon<br />
Tracker’s FEE (Front End Electronic), consisting of the<br />
nXYTER, an ADC (Analog Digital Converter) and a ROC<br />
(Read Out Controller) [1]. The implementation of the<br />
nXYTER specific ROC has been done very successfully,<br />
as the beam tests in September 2008 [3] and September<br />
2009 [2, 4] proved. Our first ROC setup consisted of the<br />
nXYTER readout logic and a PPC based Ethernet transport<br />
logic. This setup is called the nXYTER Starter Kit, which<br />
turned out to be very helpful in small laboratory setups,<br />
where physicists need quick access to the nXYTER and its<br />
measured data. The Ethernet interface keeps the communication<br />
effort as simple as possible, since every common PC<br />
supports it.<br />
However, in the final experiment thousands of ROCs will<br />
be used. In this setup Ethernet will not be an option any<br />
longer. This is primarily caused by the galvanic isolation<br />
coming with fiber optics and by the fact that the certain<br />
ROCs are synchronized via Deterministic Latency Messages<br />
(DLMs), which by definition depend on optical fiber<br />
[5]. Thus, a second transport logic, the Optical Transport,<br />
has been implemented. In our first concept, the Optical<br />
Transport was planned to fully replace the Ethernet transport.<br />
Due to the usefulness of the Starter Kit this plan has<br />
been altered. Today, we fully support both, Ethernet and<br />
Optical Fiber, as two equal solutions.<br />
The Universal ROC<br />
While our first setup solely focused on the nXYTER, today<br />
we are also designing and implementing readout logic<br />
for the FEET chip [8] and the TRD chip (in planning<br />
stage). To keep the re-usability as high as possible, we<br />
did split the ROC into two fully independent modules: the<br />
Figure 1: The unitized layout of the Universal ROC<br />
readout logic (RL) and the transport logic (TL). Both are<br />
connected to each other via a standard bus for slow control<br />
and via a FIFO for the hit data transport (see figure 1).<br />
This internal interface is common for all transport modules<br />
and all readout modules. Therefore the development of the<br />
modules can be done independently.<br />
The strict separation of the chip into RL and TL also influences<br />
the software on the PC. At this, RL and TL can be<br />
seen as two different layers. A change from Ethernet to Optic<br />
causes the change of the whole communication setup.<br />
Of course fiber cables instead of Ethernet cables have to<br />
be used. But more important, there is no fiber port on the<br />
PC. Therefore the ABB board (which in short acts as an<br />
adapter from fiber to PCIe [6]) has to be used. This leads<br />
to the utilization of completely different drivers. However,<br />
the overlying DABC software [7], which implements slow<br />
control and data taking, has not to be changed at all. Using<br />
encapsulation, it does not even have to notice the change<br />
from Ethernet to Optic. On the other hand a change of<br />
the RL from nXYTER to FEET only influences the control<br />
software and does not require any changes on the driver<br />
software.<br />
In conclusion the modularization of the Read Out Controller<br />
and the consequential separation of the control software<br />
into different layers, enables us to provide an Universal<br />
ROC, which offers quick access to a long-run tested<br />
transport logic. This leads to a significant increase of stability<br />
and reliability compared to a development from the<br />
scratch. Beyond that, the modularization concept allows us<br />
to easily add a new readout logic for further FEE setups.<br />
References<br />
[1] N. Abel et. al, “Development of the Read Out Controller for<br />
the nXYTER Front End Board”, <strong>GSI</strong> Progress Report 2007,<br />
Darmstadt, Germany<br />
[2] B. Bozsogi, “Test of CBM Silicon Tracking Detectors in a<br />
proton beam at <strong>GSI</strong>”, Student Report, 2009, Budapest, Hungary<br />
[3] cbm-wiki.gsi.de/cgi-bin/view/Beamtime/BeamTimeGsiSep2008<br />
[4] cbm-wiki.gsi.de/cgi-bin/view/Beamtime/BeamTimeGsiAug2009<br />
[5] F. Lemke et. al, “A Unified Interconnection Network with<br />
Precise Time Synchronization for the CBM DAQ System”,<br />
IEEE NPSS Real Time Conference, 2009, Beijing, China<br />
[6] W.gao et. al, “Improved Active Buffer Board of CBM”, <strong>GSI</strong><br />
Scientific Report 2008, Darmstadt, Germany<br />
[7] Linev et. al, “Software development for CBM readout controller<br />
board”, <strong>GSI</strong> Progress Report 2008, Darmstadt, Germany<br />
[8] Sebastian Manz, “GET4 readout chain”, CBM Collaboration<br />
Meeting, 2009, Split, Croatia<br />
323
INSTRUMENTS-METHODS-44 <strong>GSI</strong> SCIENTIFIC REPORT 2009<br />
A Wide Applicable TDC with Event-Driven Readout<br />
Introduction<br />
2009 the <strong>GSI</strong> ASIC desgin group presented the first prototype<br />
of the event-driven TDC ASIC GET4. This ASIC<br />
was originally designed for the CBM Time of Flight subdetector<br />
system but its excellent time resolution and the triggerless<br />
operation make this chip to a good TDC candidate<br />
for other detectors especially in the FAIR environment.<br />
f Ref<br />
Channel 1 ... 4<br />
Hit<br />
Hit<br />
Hit<br />
Hit<br />
D Q<br />
D Q<br />
D Q<br />
D Q<br />
D Q<br />
D Q<br />
D Q<br />
D Q<br />
D Q<br />
D Q<br />
D Q<br />
D Q<br />
D Q<br />
D Q<br />
D Q<br />
D Q<br />
DD Q<br />
DD Q<br />
DD Q<br />
D Q<br />
...<br />
00.......00111111111111000..............00<br />
00.......00111111111111000..............00<br />
Hit Register<br />
00.......00111111111111000..............00<br />
Hit Register<br />
00.......00111111111111000..............00<br />
Hit Register<br />
Hit 128 Register bit sampled hit pattern<br />
128 bit sampled hit pattern<br />
128 bit sampled hit pattern<br />
Trailing Edge<br />
128 bit sampled hit pattern<br />
Trailing Edge<br />
Trailing LeadingEdge Edge<br />
Trailing LeadingEdge Edge<br />
Timestamp Latch<br />
Leading Edge 64 to 6 + 1 Encoder 64 to 6 + 1 Encoder<br />
Timestamp Latch<br />
Leading Edge 64 to 6 + 1 Encoder 64 to 6 + 1 Encoder<br />
Timestamp Latch<br />
64 to 6 + 1 Encoder 64 to 6 + 1 Encoder<br />
Timestamp Latch<br />
64 to 6 + 1 Encoder 64 to 6 + 1 Encoder<br />
64 to 6 + 1 Encoder 64 to 6 + 1 Encoder<br />
Timestamp TimestampLatch Latch<br />
64 to 6 + 1 Encoder 64 to 6 + 1 Encoder<br />
Timestamp Clock Latch A<br />
64 to 6 + 1 Encoder 64 to 6 + 1 Encoder<br />
Timestamp Clock Latch A<br />
64 to 6 + 1 Encoder 64 to 6 + 1 Encoder Hit<br />
Latch Clock BClockA<br />
A<br />
Hit<br />
Latch BClock<br />
A Clock B<br />
FineTime 6<br />
Latch LatchBB Clock A<br />
Hit<br />
Clock A Clock B<br />
Hit FineTime 6<br />
Latch B Clock B<br />
6<br />
Latch BClock<br />
A Clock B<br />
Hit<br />
FineTime 6<br />
Latch B<br />
6<br />
Latch AClock<br />
Clock B<br />
Hit<br />
FineTime 6<br />
Latch B Latch AClock<br />
BClock<br />
A<br />
6<br />
Hit FineTime<br />
6<br />
Latch LatchAA Clock BClock<br />
A<br />
6 6<br />
Latch A Clock A<br />
Hit FineTime<br />
Clock A<br />
66<br />
Latch A<br />
Latch A Clock A<br />
FineTime<br />
Clock A<br />
66<br />
Latch A Clock A<br />
FineTime<br />
6<br />
Clock A<br />
6<br />
{ { { {<br />
DF<br />
Delay Locked Loop<br />
128 delayed clocks<br />
D Q<br />
D Q<br />
D Q<br />
Sync<br />
D Q<br />
TDC Overview<br />
12 bit Timestamp Counter<br />
Timestamp<br />
Epoche Event<br />
SyncEvent<br />
Event Latch<br />
Event Latch<br />
Event Latch<br />
Event Latch<br />
Event Latch<br />
Event Latch<br />
SyncError<br />
Data Data<br />
Data Event FiFo (8 x 30 Bit) Data<br />
Data Event FiFo (8 x 30 Bit) Data<br />
Data Event FiFo (8 (8xx30 30Bit) Bit) Data<br />
Data Event FiFo (8 (8xx30 30Bit) Bit) Data<br />
WriteData<br />
Full Event FiFo (8 x 30 Bit) Data Empty<br />
Write Full Event FiFo (8 x 30 Bit)<br />
Write Decision Full<br />
Empty<br />
Write FullWR<br />
EmptyRD<br />
Write Decision Full<br />
Empty<br />
Write Decision FullWR<br />
EmptyRD<br />
Write Decision FullWR<br />
EmptyRD<br />
Decision WR<br />
EmptyRD<br />
Write Decision FullWR<br />
RD<br />
Decision WR<br />
EmptyRD<br />
WR<br />
RD<br />
Decision WR<br />
RD<br />
29 28 27 26 25 24 23 22 21 20 19 18 17 16 15 14 13 12 11 9 7 5 3 1<br />
10 6 8 4 2 0<br />
Epoche<br />
Time Stamp<br />
Fine Time B Fine Time A<br />
Sync<br />
Hit B<br />
Hit A<br />
H. Deppe 1 and H. Flemming 1<br />
1 <strong>GSI</strong>, Experiment Electronics, Darmstadt, Germany<br />
Token Ring Controller<br />
Token Out<br />
Token In<br />
Token In<br />
Token In<br />
Token In<br />
Token In<br />
Token In<br />
Token In<br />
Token In<br />
Token Ring Readout<br />
Token Ring Readout<br />
Token Ring Readout<br />
Token Ring Readout<br />
Token Ring Readout<br />
Token Ring Readout<br />
Token Ring Readout<br />
Token Ring Readout<br />
Token Out<br />
Token Out<br />
Token Out<br />
Token Out<br />
Token Out<br />
Token Out<br />
Token Out<br />
Token Out<br />
Figure 1: Block diagram of the GET4 TDC ASIC.<br />
Figure 1 shows a <strong>block</strong> diagram of the GET4 ASIC.<br />
Main part of the time measurement system is the time core<br />
with an 128 stage Delay Locked Loop (DLL). Each of the<br />
four channels has an 128 bit hit register which is clocked<br />
by the timing signals of the DLL, four data encoders and<br />
two derandomization units. The readout of the data is done<br />
by a token ring based readout logic.<br />
The time resolution of the TDC is given by the delay of<br />
one DLL delay element. The theoretical value is<br />
σth = 1<br />
√<br />
12<br />
1<br />
128 Tcyc<br />
With a design clock frequency of 156.25 MHz the theoretical<br />
limit is σth = 14.4 ps. The splitting of the 128<br />
bit hit register into two parts with separate data encoders<br />
makes GET4 able to cope with a burst hit rate of 312.5<br />
MHz. The GET4 detects leading and trailing edges for time<br />
over threshold calculation.<br />
Test Results<br />
Figure 2 shows time measurements between channel 0<br />
and channel 2 of the GET4 TDC. The measured correlated<br />
time resolution is 34.3 ps which leads into an uncorrelated<br />
time resolution of 24.2 ps. The histogram also shows that<br />
324<br />
(1)<br />
Entries [1]<br />
45000<br />
40000<br />
35000<br />
30000<br />
25000<br />
20000<br />
15000<br />
10000<br />
5000<br />
Time and Double Hit Resolution of GET4<br />
Time Difference Ch0 - Ch2<br />
µ: (-0.5612 +/- 0.0001) ns<br />
σ: (34.31 +/- 0.06) ps<br />
Pulse Spacing<br />
µ: (3.7342 +/- 0.0003) ns<br />
σ: (38.45+/- 0.26) ps<br />
0<br />
-3 -2 -1 0 1<br />
Time Difference [ns]<br />
2 3 4 5<br />
Figure 2: Histogram for time resolution and double pulse<br />
resolution determination.<br />
the TDC can resolve double hits with ≤ 3.7 ns puls spacing.<br />
Beyond that it could be shown that GET4 is able to<br />
measure puls widths below 1 ns.<br />
Evaluation board FEET-TDC<br />
For detector and FEE developments an evaluation board<br />
with two GET4 ASICs on board was designed. This board<br />
with the two ASICs on the left side is shown in figure 3.<br />
Figure 3: Picture of the FEET TDC pc-board (courtesy of<br />
G. Otto).<br />
References<br />
[1] H. Deppe and H. Flemming, The <strong>GSI</strong> Event-driven TDC with<br />
four Channels GET4, Nuclear Science Symposium Conference<br />
Record, 2009 IEEE
<strong>GSI</strong> SCIENTIFIC REPORT 2009 INSTRUMENTS-METHODS-45<br />
<strong>GSI</strong>Temp late2007<br />
Development of a High-Resolution (< 10 ps RMS) 32-channel TDC<br />
in a Field-Programmable-Gate-Array*<br />
Time to Digital Converters (TDCs) are widely used in<br />
many scientific applications. At <strong>GSI</strong> high-resolution<br />
ASIC-TDCs and commercial modules are utilized in<br />
Time of Flight detectors. Two methods used in highresolution<br />
applications – the Vernier and the tapped delay<br />
line (TDL) method – have been successfully implemented<br />
in FPGAs, e.g. a FPGA-TDC with 17 ps time resolution<br />
has been described recently in [1]. The advantage of a<br />
FPGA implementation is the less complex, less expensive<br />
and less time consuming design process as well as the<br />
flexibility and adaptability of the FPGA-TDC design to<br />
special needs of the current application. These facts motivated<br />
us to explore the performance of a TDC implementation<br />
in a FPGA.<br />
TDC-Design<br />
A 32-channel TDC based on the TDL method was implemented<br />
on a Virtex-4 FPGA. In this method standard<br />
chain structures in a FPGA – the carry chains – are used<br />
as a delay chain for time stretching purposes. The intrinsic<br />
delay of a cell in the chain determines the achievable<br />
time-resolution of the time interpolation. In our target<br />
device the maximum delay of a cell is 45 ps. Some methods<br />
were proposed to improve the resolution of the TDC<br />
beyond its cell delay. A promising method, called the<br />
Wave-Union method, introduced in [2] for an Altera device,<br />
was adapted to the Xilinx Virtex FPGA architecture.<br />
Measurements<br />
In our measurements we determined the time difference<br />
of two rising edges which were fed into two different<br />
TDC channels. The time delay between the edges was<br />
varied by using different cable delays or with Tektronix<br />
Data Timing Generator DTG5078. In a TDC channel the<br />
time difference between the asynchronous input and the<br />
next rising edge of the system clock was measured and<br />
time stamped. The measurement data was combined with<br />
a channel number and stored in a FIFO. A bin-by-bin calibration<br />
and the analysis was performed offline. Several<br />
series of tests were performed to derive the achieved time<br />
resolution and the impact on it due to the temperature and<br />
supply voltage variations. All tests were accomplished<br />
with a 200 MHz system clock.<br />
To characterize the influence of the system clock (accuracy<br />
and jitter) on the measured RMS value three measurement<br />
series were performed. Several measurements<br />
with increasing time difference were made with both<br />
* Work supported by EU FP6 grant, contract number 515876<br />
and EU FP6 grant RII-CT-2004-506078.<br />
# eugen.bayer@gmx.de, e.bayer@gsi.de<br />
E. Bayer 1,# , M. Traxler 1<br />
1 <strong>GSI</strong> Helmholzzentrum, Darmstadt, Germany.<br />
edges within a system clock period (Figure 1a), within<br />
few periods and with a time difference about 1 �s respectively.<br />
A typical distribution of 500k time measurements<br />
for one fixed time delay is shown in Figure 1b.<br />
a)<br />
Hits<br />
30000<br />
25000<br />
20000<br />
15000<br />
10000<br />
5000<br />
0<br />
1650 1700 1750 1800<br />
time difference [ps]<br />
b)<br />
RMS = 9 ps<br />
1740 1760 1780 1800 1820<br />
time difference [ps]<br />
Figure 1: a: Tree different delays (incr. 40 ps) within a<br />
clock period. b: Typical distribution of 500k hits.<br />
In the first two measurement series the RMS value was<br />
9 ps. So the resolution of a single channel is 9/�2 � 7 ps.<br />
Due to the limited accuracy of the system clock additional<br />
2 ps were added in the third series (long period measurement).<br />
The performance of the TDC was also examined under<br />
varying environment conditions. In the temperature test<br />
setup the temperature of the FPGA was increased from<br />
30 °C to 85 °C. With increasing temperature a deformation<br />
of the calibration look-up-table was observed. This<br />
results in a worsening of the RMS value if a table beyond<br />
the 5 °C temperature region is used. However, the change<br />
of the temperature has no influence if the table is updated<br />
often enough.<br />
In the voltage test setup the supply voltage was varied<br />
within the allowed voltage range of the FPGA-core from<br />
1.15 V to 1.25 V. We observed a 50 ps shift in the measured<br />
mean caused by the reduction of the intrinsic offset<br />
between the signal runtimes to the carry chains. Under<br />
normal conditions this effect was not observed with the<br />
used voltage regulator (DC/DC converter).<br />
References<br />
[1] C. Favi; E. Charbon: A 17ps Time-to-digital Converter<br />
Implemented in 65nm FPGA Technology,<br />
IEEE ISFPGA, February 2009.<br />
[2] J. Wu, Z. Shi: The 10-ps wave union TDC: Improving<br />
FPGA TDC resolution beyond its cell delay,<br />
IEEE Nuclear Science Symposium Conference, 19-<br />
25 Oct. 2008.<br />
325
INSTRUMENTS-METHODS-46 <strong>GSI</strong> SCIENTIFIC REPORT 2009<br />
Design and performance of a fully differential Multigap RPC ∗<br />
I. Deppner † 1 , N. Herrmann 1 , M. Ciobanu 2 , D. Gonzales-Diaz 2 , K.D. Hildenbrand 2 , M. Kis 2 ,<br />
Y. Leifels 2 , P.-A. Loizeau 1 , and Y. Zhang 1<br />
1 Physikalische Institut Uni. Heidelberg, Heidelberg, Germany; 2 <strong>GSI</strong>, Darmstadt, Germany<br />
In the current design of the CBM experiment, hadron<br />
identification is based on the Time-of-Flight measurement<br />
provided by a wall of Multi-gap Resistive Plate Chambers<br />
(MRPC). Due to a lower rate the outer most part can be<br />
covered with float glass MRPCs in a multi-strip configuration.<br />
In order to study possible configuration of such systems,<br />
a prototype of a Multi-strip MRPC with fully differential<br />
readout was developed (see Fig.1). The active area of the<br />
Figure 1: MRPC layout<br />
prototype is 28 x 16.5 cm 2 . Its active volume is subdivided<br />
by nine 0.55 mm thick float glass plates. The space between<br />
the glass plates is ensured by 220 µm thick fishing<br />
lines. The bottom and top plates are covered by conductive<br />
layers (surface resistivity 100 MΩ/cm 2 ) to form electrodes<br />
to which High Voltage of ±10.5 kV and ±11.5 kV<br />
is applied. Therefore the el. field in between the electrode<br />
equals to 120 kV/cm and 130 kV/cm. The two outermost<br />
plates (PCB 4mm) serve as support for the MRPC and contain<br />
also the readout strips which have a width of 7 mm.<br />
The relatively big distance between the strips is 3 mm and<br />
leads to an reduced cross talk. This strip configuration together<br />
with the total number of gaps was simulated to have<br />
the impedance of 100 Ω. A good impedance matching with<br />
the front-end electronics [1] is necessary to reduce signal<br />
reflections in the counter. Measurements with an reflectometer<br />
show a real impedance of about 80 Ω. Another advantage<br />
of the purposed strip configuration is that the strip<br />
width is comparable with the cluster size of an avalanche,<br />
which was shown to be approximately 7 mm at a field of<br />
108 kV/cm [2], therefore charge sharing can only happen<br />
between two strips. Due to the totally symmetric layout<br />
of the counter the signal is fully differential which minimize<br />
the common mode pickup noise in the preamplifier.<br />
For signal amplification and discrimination we use the so<br />
called PADI 2 [1] with time-over-threshold function. The<br />
LVDS timing output signals from PADI are fed into an expansion<br />
card for the high timing resolution system (TAC-<br />
326<br />
∗ Work supported by BMBF 06HD190i<br />
† deppner@physi.uni-heidelberg.de<br />
QUILA) [3], which allows time over threshold functionality<br />
for TACQUILA.<br />
The described setup was tested in August 2009 with a 3<br />
GeV proton beam in cave B. Using the tracking information<br />
from silicon detectors the efficiency for different<br />
strips and different positions perpendicular to the strip (yposition)<br />
could be determined with accuracy of 1 mm (see<br />
fig. 2). The efficiency of each individual strip shows a<br />
plateau of 6 mm in the overlap region of the strip in the<br />
order of 95%. It drops slightly towards the side of the<br />
strip, but in the middle of the gap between the strips it still<br />
amounts to be about 80%. The total efficiency of the RPC<br />
is over all about 95%. In addition the average cluster size<br />
Figure 2: Strip by strip efficiency: the yellow area depict<br />
the position of the strips.<br />
of the signals was determined. That is the average number<br />
of strips which fire for a single avalanche. At 11 kV the<br />
cluster size was found to be 1.2 strips which means that in<br />
most of the cases only one strip fires. Three strip events<br />
were found with a probability of about 2% allowing to estimate<br />
the total cross talk in this configuration to below 3%.<br />
References<br />
[1] M. Ciobanu, N. Herrmann, K.D. Hildenbrand, M. Kis, A.<br />
Schüttauf, “ PADI, a fast Preamplifier - Discriminator for<br />
Time-of-Flight measurements”, IEEE NSS, Dresden, (2008),<br />
2018-2024<br />
[2] I. Deppner, N. Herrmann, R. Averbeck, C. Ciobanu1, K.D.<br />
Hildenbrand, T.I. Kang, M. Kis, Y. Leifels, K. Piasecki, A.<br />
Schüttauf, D. Gonzalez Diaz, and the FOPI Collaboration “<br />
Characterisation of FOPI narrow strip RPCs”, CBM Progress<br />
Report 2008<br />
[3] K. Koch, E. Badura, “ High resolution double-hit timing and<br />
time over threshold measurement feasibility for the TAC-<br />
QUILA system”, IEEE NSS,Honolulu, HI, (2007), Volume:<br />
1, 320-321
<strong>GSI</strong> SCIENTIFIC REPORT 2009 INSTRUMENTS-METHODS-47<br />
An algorithm for offline correction of the walk effect<br />
H.T. Johansson 1 and Yu. Aksyutina 2<br />
1 Chalmers University of Technology, Göteborg, Sweden; 2 <strong>GSI</strong>, Darmstadt, Germany<br />
The walk effect, i.e. the dependence of a time signal on<br />
its amplitude, can lead to a significant worsening of the<br />
time resolution for a detector signal. Walk is inevitable<br />
in measurements where the time signal is produced using<br />
a leading-edge discriminator. Using a CFD supposedly<br />
should solve the problem, but any improper adjustment of<br />
the CFD can worsen the walk. Here an algorithm for offline<br />
determination of the walk effect from collected physics<br />
data is presented.<br />
The time, t, measured by a single detector channel can<br />
be viewed as<br />
t = t0 + f(e), (1)<br />
where t0 is the real time of event appearance and f(e) the<br />
function containing the amplitude dependence of the measured<br />
time. Thus, to perform the walk correction, the function<br />
f(e) has to be determined and corrected for. In case of<br />
events where known t0 are available, the function f(e) can<br />
be easily determined [1].<br />
For the case with unknown t0, events with special properties<br />
can be used. The present algorithm uses data from<br />
events where it can be expected (often by geometry) that<br />
some relationship between real times should exist. These<br />
can be either the four times of two simultaneously fired<br />
neighbouring paddles in case of the LAND and TFW detectors<br />
or a single scintillator foil viewed by four photomultipliers,<br />
such as the POS detectors. Assuming that signals<br />
with the above mentioned properties are produced by the<br />
same particle, the condition for calculated mean times<br />
t01 + t02<br />
2<br />
− t03 + t04<br />
2<br />
= C (2)<br />
has to be fulfilled. Here, the times t01 and t02 (t03 and<br />
t04) belong to opposite photomultipliers. The constant C<br />
is calibrated to vanish by later calibration steps and is not<br />
relevant for this paper.<br />
Different flight paths of the particle through the two paddles<br />
cause different energy deposition. Although the energies<br />
measured in one paddle are correlated, the finite energy<br />
resolution makes them different enough to be used as<br />
independent. In case of the POS detector, all four energies<br />
are correlated but due to small detector size the light attenuation<br />
is comparable with resolution. Therefore, they also<br />
can be treated as independent.<br />
By introducing a value<br />
dt = t1 + t2<br />
2<br />
− t3 + t4<br />
, (3)<br />
2<br />
where t1, t2, t3 and t4 are measured times, the combination<br />
of Eq. 1 and Eq. 2 leads to<br />
dt(e1, ...) = f1(e1) + f2(e2)<br />
−<br />
2<br />
f3(e3) + f4(e4)<br />
+C. (4)<br />
2<br />
Accordingly, the function dt is affected by the walk effect<br />
in all four detector channels. If one applies narrow<br />
gates on e2, e3 and e4 then corresponding functions can<br />
be treated as constants and eq. 4 is simplified to f1(e1) =<br />
dt(e1) + C1, where C1 includes all constant offsets. By<br />
looping over e1 the corresponding function is determined.<br />
By moving the gates over the whole ranges of e2, e3 and<br />
e4 a set of curves f1,j(e1) = dtj(e1) + C2,j is obtained,<br />
where the constant C2 depends on the gate positions. The<br />
curves cover partial energy ranges. They are subsequently<br />
merged into one energy-dependent function. A walk curve<br />
obtained for one of the POS detector channels is shown in<br />
Fig. 1.<br />
Figure 1: Walk curve obtained for one POS channel.<br />
Once the functions fi(ei) have been obtained, corrections<br />
can be tested for the data after the TDC slopes, prior<br />
to subsequent calibration procedures.<br />
The presented method has been applied to the POS, TFW<br />
and LAND detectors during analysis of the S245 experiment.<br />
Due to lack of statistics for LAND and TFW the<br />
results have so far not been useable. For these detectors<br />
an alternative data collection using only two or three signals<br />
is under investigation. Curves obtained for the POS<br />
detectors were successfully applied and although gaining a<br />
small resolution improvement from σ = 196 ps to σ = 192<br />
ps, the method works and should be very helpful in the future,<br />
when leading edge discriminators will be used in R 3 B<br />
setup.<br />
References<br />
[1] L. Heilbronn, Y. Iwata, H. Iwase, Nucl. Instr. Meth. A 522<br />
(2004) 495.<br />
327
INSTRUMENTS-METHODS-48 <strong>GSI</strong> SCIENTIFIC REPORT 2009<br />
Correcting integral non-linearities of the TACQUILA board<br />
M. Kiˇs 1,2 , R. Averbeck 1 , M. Ciobanu 1 , I. Deppner 2 , Y. Leifels 1 , N. Herrmann 2 , K.D. Hildenbrand 1 ,<br />
and FOPI Collaboration 1<br />
1 <strong>GSI</strong>, Darmstadt, Germany; 2 Physikalisches Institut, Heidelberg, Germany<br />
The MMRPC ToF Barrel [1] was installed in FOPI towards<br />
the end of 2007; since then we have performed a few<br />
production runs in which the new detector has shown to<br />
be a valuable tool. The ToF resolution of about 95 ps has<br />
been achieved in all runs after consistent implementation<br />
of necessary corrections. Here we present the correction of<br />
integral non-linearities also known as “wiggle”-correction.<br />
The timing electronics for the MMRPC Barrel (so-called<br />
TACQUILA board [2]) was developed by the DVEE department<br />
of <strong>GSI</strong>, which also designed the TAC chip used<br />
on the board. The measurement is performed in a commonstop<br />
mode with a distributed 40 MHz clock system as reference.<br />
The TAC ASIC has an timing resolution of about<br />
10 ps and it features a very good linearity. However, one<br />
can still find small deviations that can be corrected. These<br />
so-called integral non-linearities are illustrated in Fig. 1.<br />
The top panel (a) shows raw spectra of the time difference.<br />
counts<br />
sum r x10 3 counts<br />
diff counts<br />
300<br />
200<br />
100<br />
0<br />
100<br />
75<br />
50<br />
25<br />
0<br />
1000<br />
0<br />
-1000<br />
(a)<br />
(b)<br />
(c)<br />
7.5 10 12.5 15 17.5 20 22.5 25 27.5 30<br />
t channels x 10 2<br />
Figure 1: See text for details.<br />
Apart from beginning and end of the spectra which are influenced<br />
by an interference, the measurement appears to be<br />
fully random since there is no correlation between physi-<br />
328<br />
cal events and the reference (clock) signal. Nevertheless,<br />
if one subtracts a linear fit of the cumulative sum of the<br />
spectra (panel b), the result (panel c) indicates a systematic<br />
non-linear behavior (“wiggle”) which can be corrected.<br />
It is known that the integral non-linearities in the case<br />
of our TAC chips are strongly dependent on temperature.<br />
Therefore a very robust cooling system for electronics was<br />
installed. In addition the calibration is performed in regular<br />
intervals. On the other hand during regular runs one cannot<br />
obtain enough statistics in order to perform a precise<br />
correction for each channel as shown in Fig. 1. Therefore,<br />
since the behavior of TAC chips is similar, the correction<br />
is performed by averaging over the 16 channels of a single<br />
TACQUILA board. The result of such a correction is<br />
dt ns<br />
dt ns<br />
0.4<br />
0.3<br />
0.2<br />
0.1<br />
-0<br />
-0.1<br />
-0.2<br />
-0.3<br />
-0.4<br />
0.4<br />
0.3<br />
0.2<br />
0.1<br />
-0<br />
-0.1<br />
-0.2<br />
-0.3<br />
-0.4<br />
(a)<br />
(b)<br />
7.5 11.25 15 18.75 22.5 26.25 30<br />
t channels x10 2<br />
Figure 2: See text for details.<br />
in Fig. 2, where a time difference spectra before and after<br />
correction (upper and lower panel) is shown. The corrections<br />
are applied to all RPCs of the Barrel as a last correction,<br />
bringing the overall ToF resolution from about 100 to<br />
95 ps.<br />
References<br />
[1] A. Schüttauf et al., Nucl. Phys. B (proc.Supp.) 158 (2006) 52<br />
[2] K. Koch et al., IEEE Trans. Nucl. Sci. 52 (2005) 745
<strong>GSI</strong> SCIENTIFIC REPORT 2009 INSTRUMENTS-METHODS-49<br />
Radiation Studies on the UMC 180 nm CMOS Process<br />
Introduction<br />
Radiation damages to electronic components are an important<br />
issue for future FAIR experiments. One of the preferred<br />
technology for ASIC developments at <strong>GSI</strong> is the<br />
180 nm UMC CMOS process. In this regard the ASIC design<br />
group of the <strong>GSI</strong> Experiment Electronic department<br />
has been launched a research project in 2007, including the<br />
development of an ASIC called GRISU. The main goal is<br />
the characterisation of Single Event Effects as well as Total<br />
Ionising Dose effects on the 180 nm UMC process.<br />
Single Event Effect Studies<br />
Single Event Effect (SEE) is the main generic term for<br />
effects in semiconductor devices triggered by the impact of<br />
ionising particles. Within the SEE there are more detailed<br />
types of effects. Of great interest are the so-called Single<br />
Event Upset (SEU) and Single Event Transient (SET) effects.<br />
A good choice to test these effects is the irradiation of<br />
the semiconductor devices with heavy ions. Therefore the<br />
GRISU test chip has been particular designed to monitor<br />
these effects during irradiation. For a complete characterisation<br />
it is also necessary to measure the impact of ionising<br />
particles at different Linear Energy Transfer (LET) levels.<br />
The irradiation tests of the GRISU were performed at the<br />
<strong>GSI</strong> linear accelerator (UNILAC) in cave X6. The coverage<br />
of the large LET range was obtained with different<br />
heavy ions and energy absorption in air. An overview of<br />
the 2008 and 2009 available ions and the resulting energy<br />
and LET parameters are given in Table 1.<br />
Heavy Energy Energy LET<br />
ion [MeV/AMU] [MeV] [MeV cm 2 / mg]<br />
C-12 0. . . 10.4 0. . . 125 1. . . 5<br />
Ar-40 0. . . 9.0 0. . . 360 10. . . 19<br />
Ni-58 0. . . 7.9 0. . . 458 15. . . 32<br />
Ru-96 0. . . 7.3 0. . . 691 30. . . 49<br />
Xe-132 0. . . 7.3 0. . . 969 40. . . 60<br />
Table 1: Energy and LET range for the heavy ions available<br />
at the various beam test.<br />
Exemplarily the overall cross section test results versus<br />
LET is shown in Figure 1 for a minimum sized inverter.<br />
The critical Linear Energy Transfer (LETcrit) as well as<br />
the maximum cross section ratio are extracted from the test<br />
results for each test structures. Furthermore the sensitivity<br />
against SEU for different types of flip-flop and memory<br />
∗ s.loechner@gsi.de<br />
S. Löchner ∗1<br />
1 <strong>GSI</strong>, Darmstadt, Germany<br />
cells have been tested.<br />
σ [cm 2 /bit]<br />
1.0e-07<br />
1.0e-08<br />
1.0e-09<br />
1.0e-10<br />
1.0e-11<br />
1.0e-12<br />
Inv0<br />
Weibull-Fit<br />
0 5 10 15 20 25 30 35 40 45 50 55 60 65<br />
LET [MeV cm 2 1.0e-13<br />
/mg]<br />
Figure 1: Weibull fit of the SET cross section of a minimum<br />
sized inverter.<br />
Total Ionising Dose Studies<br />
A Total Ionising Dose (TID) test was performed at the Xray<br />
irradiation facility of the IEKP [1] / FZK [2]. In total 8<br />
GRISU test chips have been irradiated. Table 2 summarises<br />
the different dose rates and accumulated doses.<br />
The transient and output characteristics of discrete<br />
MOSFET transistors as well as threshold voltage and leakage<br />
currents were measured for different accumulated dose<br />
levels. Immediately after irradiation the annealing of the<br />
chips were measured. Finally, all chips showed a very good<br />
annealing performance. After four weeks leakage current<br />
has settled back to the initial value.<br />
Number of Dose rate Accumulated dose<br />
chips [krad/h (SiO2)] [krad (SiO2)]<br />
1 20 320<br />
2 40 400. . . 480<br />
4 80 640. . . 960<br />
1 196 600<br />
Table 2: Summary of irradiated GRISU chips, dose rates<br />
and accumulated doses of the TID test.<br />
References<br />
[1] Institute of Experimental nuclear Physics (IEKP),<br />
University of Karlsruhe (TH)<br />
http://www-ekp.physik.uni-karlsruhe.de<br />
[2] Forschungszentrum Karlsruhe (FZK)<br />
http://www.fzk.de<br />
329
INSTRUMENTS-METHODS-50 <strong>GSI</strong> SCIENTIFIC REPORT 2009<br />
Total Ionising Dose Studies of the QFW ASIC<br />
S. Löchner ∗1 , H. Flemming 1 , and M. Witthaus 2<br />
1 <strong>GSI</strong> Darmstadt, Experiment Electronics; 2 <strong>GSI</strong> Darmstadt, Beam Diagnostic<br />
Introduction<br />
In 2004 the ASIC design group of the <strong>GSI</strong> Experiment<br />
Electronics department (EE) has developed a full custom<br />
designed Application Specific Integrated Circuit (ASIC)<br />
called QFW[1]. This chip, based on a former development<br />
of a charge to frequency converter [2], provides a dynamic<br />
range of more than 7 decades without any range switching<br />
(1 pA. . . 10 µA respectively 10 pA. . . 100 µA).<br />
A typical application for which the chip can be used is<br />
the signal readout of ionisation chambers or multi wire detectors.<br />
Therefore, for a good readout performance the<br />
QFW chip has to be mounted maybe very close to the<br />
<strong>GSI</strong> accelerator or near the beam pipe somewhere in the<br />
experiments. In these environments there are often very<br />
harsh radiation conditions to the semiconductor devices.<br />
Special effects like the Total Ionising Dose (TID) play a<br />
very important role and therefore prior to the selection of<br />
a chip must be carefully tested. In cooperation with the<br />
<strong>GSI</strong> Beam Diagnostic group a research project has been<br />
launched 2008 for testing to test these TID effects of the<br />
QFW ASIC.<br />
Total Ionising Dose Studies<br />
In July 2009 a Total Ionising Dose test was performed<br />
at the X-ray irradiation facility of the Institute of Experimental<br />
Nuclear Physics (IEKP)[3] at Forschungszentrum<br />
Karlsruhe (FZK)[4]. In total two QFW test chips mounted<br />
on the QFW board of the Beam Diagnostic group [5] have<br />
been irradiated. A picture of the test setup inside the irradiation<br />
chamber is shown in Fig. 1. During the beam tests<br />
the X-ray operation settings were held constant at 60 kV<br />
and 30 mA tube current. In order to change the irradiation<br />
dose rate the distance between X-ray source and test setup<br />
could be changed.<br />
Measurements and Results<br />
The first chip was irradiated up to 3.2 kGy (SiO2), the<br />
second chip up to a total dose of 17.2 kGy (SiO2). For all<br />
four channels of the QFW chip the current to frequency<br />
characteristic was measured for positive as well as negative<br />
test currents. The lower limit for the injected currents was<br />
50 pA, the upper limit 10 µA respectively 100 µA.<br />
Both chips were fully functional after irradiation with<br />
X-rays. The measured increase of leakage current was in<br />
the order of 70 pA per kGy (SiO2), constant over the complete<br />
dynamic range of the QFW. Only one channel of one<br />
330<br />
∗ s.loechner@gsi.de<br />
Figure 1: QFW test setup inside the X-ray irradiation chamber.<br />
The collimator output of the X-ray tube is shown at the<br />
top, underneath one of the both test PCB with a QFW chip<br />
is located.<br />
chip showed a significant higher increase in leakage current.<br />
After a total dose of 6 kGy (SiO2) the average increase<br />
of leakage current of this channel was 1940 pA per<br />
kGy (SiO2).<br />
Immediately after irradiation the annealing of the induced<br />
leak currents was observed. After two months of<br />
annealing at room temperature no leakage currents were<br />
measured for both chips.<br />
Summary<br />
The first Total Ionising Dose test of the QFW has shown<br />
that the chip can withstand higher radiation doses, although<br />
it was not designed for it. The chip also showed a very good<br />
annealing performance after the X-ray beam was switch<br />
off. It is therefore highly unlikely that failures due to TID<br />
effects will occur during normal beam operation conditions.<br />
References<br />
[1] H. Flemming and E. Badura ”A high dynamic charge to frequency<br />
converter ASIC”, <strong>GSI</strong> Scientific Report 2004<br />
[2] E. Badura, ”Vorrichtung und Verfahren zum Umwandeln von<br />
Ladungsfluss in ein Frequenzsignal”, EP 1 031 040 B1<br />
[3] Institute of Experimental Nuclear Physics (IEKP),<br />
University of Karlsruhe (TH), Karlsruhe, Germany<br />
http://www-ekp.physik.uni-karlsruhe.de<br />
[4] Forschungszentrum Karlsruhe (FZK), Karlsruhe, Germany<br />
http://www.fzk.de<br />
[5] M. Witthaus et al., ”Charge-Frequency-Converter (QFW)<br />
Test Board and Results”, <strong>GSI</strong> Scientific Report 2009
<strong>GSI</strong> SCIENTIFIC REPORT 2009 INSTRUMENTS-METHODS-51<br />
Design and implementation of a data transfer protocol via optical fibre<br />
There have been development of the new electronics<br />
equipped with the small form-factor pluggable (SFP)<br />
transceivers for the data transfer via optical fiber, i.e.<br />
PEXOR (a PCIe card) [1], VULOM5 ( a VME module<br />
) [2], FEBEX ( a front-end board with pipeline ADC )<br />
[3] and EXPLODER ( a front-end board with 32 LVDS<br />
I/O ) [4]. A new protocol, GOSIP (Gigabit Optical Serial<br />
Interface Protocol) has been designed to provide communication<br />
between the electronics via optical fibre, primarily<br />
for the multi branch system (MBS), standard data acquisition<br />
system at <strong>GSI</strong>.<br />
Table 1: An example of the structure of the packet for the<br />
address mode write request to be sent from the master to the<br />
slave. The values in the third column are the case for the<br />
write access with the value 0x01FEDCBA to the memory<br />
at the address of 0x7654321 of the 8th slave module.<br />
8 bit width data example<br />
0 Reserved Packet Type 0x0 0x6<br />
1 Address Length Data Length 0x4 0x4<br />
2 Address 0 0x21<br />
3 Address 1 0x43<br />
4 Address 2 0x65<br />
5 Address 3 0x87<br />
6 Data 0 0xBA<br />
7 Data 1 0xDC<br />
8 Data 2 0xFE<br />
9 Data 3 0x01<br />
It is a master and slave protocol to control the busy of the<br />
communication safely. One SFP port of a master is capable<br />
to control multiple slaves if the slaves have 2 SFP ports.<br />
The slaves can be cascaded the way that the secondary SFP<br />
port of the slave at upstream to be connected with the primary<br />
SFP port of the slave at downstream. The chain of<br />
the slaves need to be initialized by ’initialization’ packet<br />
and will be assigned the module ID number starting from<br />
0x00 to the number or the slave modules. The module ID<br />
occupied 8-bit of address space in 32-bit address space that<br />
the memory with the size of 16 Mbytes can be mapped for<br />
the each slave modules. There are 2 modes of data transfer,<br />
’address mode’ and ’<strong>block</strong> mode’. ’Address mode’ supports<br />
read and write memory access to the slave specified<br />
by 24-bit-wide memory address and 8-bit-wide slave module<br />
ID. ’Block mode’ provides fast readout of large size of<br />
data from all the slave memory. It transfers data with the<br />
size of pre-set size from the pre-set base address and its<br />
successive addresses. The slaves can have 2 pre-set base<br />
address for double buffering to reduce dead-time. The example<br />
of the packet structure of the address mode and the<br />
<strong>block</strong> mode are shown in Table 1 and Table 2, respectively.<br />
The both modes are initiated by the master which send a<br />
∗ s.minami@gsi.de<br />
S. Minami ∗1 , J. Hoffmann 1 , N. Kurz 1 , and W. Ott 1<br />
1 <strong>GSI</strong>, Darmstadt, Germany<br />
’request’ packet to the slave and the slave examines the<br />
’packet type’ if it indicates ’initialization’, ’address mode’<br />
or ’<strong>block</strong> mode’. If it is for ’address mode’, and the address<br />
points to itself, the slave will send ’reply’ packet to<br />
the master. If the address dose not match the slave, then<br />
the ’request’ packet will be passed to the next slave until<br />
the address matches one slave or it reaches the last slave.<br />
The slave modules pass the packet sent from other slave<br />
modules at downstream without checking and the master<br />
receives either ’reply’ packet to the correct ’request’ or the<br />
original ’request’ if the address dose not match any slaves.<br />
In the case of ’<strong>block</strong> mode’, the slave received the ’request’<br />
packet starts transfer of the ’reply’ packet with the data.<br />
When it finishes to send its own data, it passes the ’request’<br />
packet to the slave at downstream until the last slave. The<br />
last slave return the ’request’ packet back to upstream.<br />
The protocol has been implemented using Verilog HDL,<br />
currently supports the communication between PEXOR<br />
and FEBEX or PEXOR and EXPLODER.<br />
Table 2: An example of the structure of the packet for the<br />
<strong>block</strong> mode read reply from the slave to the master. Data<br />
size (DS) to be transferred are specified in 4×8-bit fields,<br />
Data Size 0,1,2 and 3. The values in the third column are<br />
for the case to send the data, 0x01FEDCBA, with the size<br />
of 0x00000004 bytes taken with the trigger whose flag is<br />
0x01 from the 8th slave module.<br />
8 bit width data example<br />
Reserved Packet Type 0x0 0x8<br />
1 Header Length Data Size Length 0x3 0x4<br />
2 Header 0 (Trigger) 0x01<br />
3 Header 1 (Slave ID) 0x08<br />
4 Header 2 (SubMemory ID) 0x01<br />
5 Data Size 0 0x04<br />
6 Data Size 1 0x00<br />
7 Data Size 2 0x00<br />
8 Data Size 3 0x00<br />
9 Data 0 0xBA<br />
10 Data 1 0xDC<br />
11 Data 2 0xFE<br />
.<br />
.<br />
.<br />
.<br />
DS+8 The last Data 0x01<br />
References<br />
[1] J. Hoffmann et al. <strong>GSI</strong> Scientific Report 2008, p275<br />
[2] http://www.gsi.de/informationen/wti/ee/elekt entwicklung/<br />
vulom5.html<br />
[3] http://www.gsi.de/informationen/wti/ee/elekt entwicklung/<br />
febex.html<br />
[4] http://www.gsi.de/informationen/wti/ ee/elekt entwicklung/<br />
exploder.html<br />
331
INSTRUMENTS-METHODS-52 <strong>GSI</strong> SCIENTIFIC REPORT 2009<br />
Charge Breeding with the SPARC-EBIT<br />
A. Thorn ∗1 , A. Sokolov 2 , G. Vorobyev 2 , F. Herfurth 2 , O. Kester 3 , W. Quint 2 , F. Ullmann 4 , and G.<br />
Zschornack 1<br />
1 Institut <strong>für</strong> Angewandte Physik, Technische Universität Dresden, Germany; 2 <strong>GSI</strong>, Darmstadt, Germany; 3 NSCL/MSU,<br />
East Lansing, USA; 4 Dreebit GmbH, Dresden, Germany<br />
Highly charged ions (HCIs) are an important tool in various<br />
fields of basic and applied physical research. However,<br />
in many cases the species of interest cannot be produced directly<br />
by a primary ion source. Therefore, charge breeding,<br />
i.e. the conversion of singly charged ions to highly charged<br />
ions, is an essential part of projects such as nuclear or astrophysical<br />
experiments with post accelerated beams of radioactive<br />
ions [1] or precise nuclear mass measurements<br />
with ions stored in penning traps [2].<br />
At <strong>GSI</strong>’s HITRAP facility [3] HCIs up to U 92+ can be<br />
provided using an accelerator complex to strip electrons off<br />
the initially low charged ions at high velocities. In case<br />
the beam from the accelerator structure is not available,<br />
tests can be run using a compact room-temperature electron<br />
beam ion trap, the SPARC-EBIT [4], which was designed<br />
to produce HCIs from gaseous materials injected through a<br />
needle valve. To broaden the range of particles which can<br />
be fed to the source we have investigated its abilities as a<br />
charge breeder.<br />
The setup for the charge breeding experiments includes<br />
a surface ion source for the creation of the singly charged<br />
alkali metal ions. The measurements presented in this paper<br />
were performed using potassium. These primary ions<br />
are guided straight towards the SPARC-EBIT where the<br />
charge breeding process takes place. It can be divided into<br />
three phases: K 1+ injection, breeding, and re-extraction of<br />
a pulse of highly charged ions from the EBIT. During the<br />
re-extraction phase a quadrupole bender mounted in between<br />
the two ion sources is switched from ground to high<br />
voltage to bend the ion trajectories by 90 degrees and send<br />
the pulse towards the multi passage spectrometer (MPS)<br />
where it can then be analyzed by magnetic A/q separation.<br />
A typical A/q spectrum of charge bred potassium measured<br />
with the MPS is presented in figure 1. The source<br />
parameters given in the picture were found to be optimal<br />
for continuous potassium ion injection. After a breeding<br />
time of tbreed = 3 s the charge state distribution has<br />
reached its equilibrium. Since the electron beam energy<br />
of the EBIT was set close to the ionization energy of the<br />
K-shell, helium-like potassium shows the highest relative<br />
abundance in the spectrum. Bare potassium ions have been<br />
detected, though only in small amounts. Further on, it<br />
was discovered that an injection time of tinj = 20 ms at<br />
the beginning of the breeding time, tbreed, is sufficient to<br />
achieve the maximum ion output for high charge states.<br />
The capture efficiency during the measurement resulted in<br />
≈ 2 · 10 −4 . Breeding efficiencies for different charge states<br />
332<br />
∗ a.thorn@fzd.de<br />
��������������<br />
���<br />
���<br />
���<br />
���<br />
���<br />
���<br />
� ���<br />
� ���<br />
� ���<br />
� ���<br />
� ���<br />
�<br />
�����<br />
� � �����������<br />
� � ���������<br />
� � �������������������������<br />
�������������������<br />
� ��� ���������<br />
� ��� ��������<br />
�������<br />
� ��� ����������� ����� ������<br />
��� ��� ���<br />
�����<br />
��� ���<br />
Figure 1: Charge state distribution after tinj = 20 ms and<br />
tbreed = 3 s. The experimental parameters given in the picture<br />
are the electron beam energy, Ee, as well as the electron<br />
current, Ie, of the EBIT, the drift tube voltages, Ut, the K 1+<br />
ion acceleration potential, UK1+, and finally the K 1+ current,<br />
IK1+, measured on a Faraday cup in front of the EBIT<br />
entrance.<br />
are presented in table 1.<br />
The activities will be continued with studies of advanced<br />
charge breeding techniques [5] using high-Z elements.<br />
Table 1: Charge breeding parameters for various potassium<br />
ion charge states q including the breeding time at which q<br />
represents the maximum of the charge state distribution,<br />
tbreed, the maximum number of K q+ ions per pulse, N K q+,<br />
the relative abundance of the charge state q, N K q+/NK, and<br />
the breeding efficiencies, ε1 → q.<br />
q tbreed(ms) N K q+(10 5 )<br />
N K q+<br />
NK<br />
�<br />
ε1 → q(10 −5 )<br />
9 50 2.4 ± 0.5 29 % 6.3 ± 1.6<br />
14 300 2.7 ± 0.5 32 % 7.2 ± 1.8<br />
17 1000 5.6 ± 1.1 45 % 15.3 ± 3.8<br />
References<br />
[1] D. Habs et al.: Hyperfine Interactions 129 (2000) 43–66<br />
[2] J. Dilling et al.: Int. J. Mass Spectrom. 251 (2006) 198<br />
[3] F. Herfurth et al.: Int. J. Mass Spectrom. 251 (2006) 266<br />
[4] B.E. O’Rourke et al.: J. Phys. Conf. Ser. 163 (2009) 012103<br />
[5] O. Kester et al.: J. Phys. Conf. Ser. 2 (2004) 107
<strong>GSI</strong> SCIENTIFIC REPORT 2009 INSTRUMENTS-METHODS-53<br />
Design and Implementation of the Read Out Controller for the GET4 TDC of<br />
the CBM ToF Wall Prototype<br />
S. Manz 1 and U. Kebschull 1<br />
1 Kirchhoff Institute for Physics, Heidelberg University, Heidelberg, Germany<br />
Introduction<br />
The Time of Flight detector of the CBM experiment will<br />
assemble about 12 500 GET4 ASICs [1]. Those chips give<br />
a very precise timestamp (resolution better than 25 ps) to<br />
detected hits and then deliver the data (24 bits/hit) via a<br />
serial LVDS link to the Read Out Controller (ROC). At<br />
the moment, the FPGA of one ROC interfaces up to 14<br />
GET4 chips. However, the current hardware allows up to<br />
28 GET4 chips and even more should be possible with the<br />
new generation of ROCs. In addition to the combination<br />
and synchronization of the data from all GET4 chips into<br />
one data stream, the ROC has to provide a control interface<br />
for all the chips.<br />
Modular Design<br />
The GET4 readout chain is one of several readout chains<br />
needed for the experiment, all with similar requirements.<br />
Therefore we implemented a modular system which separates<br />
the readout logic from the transport logic. Much<br />
functionality can be reused and only the interface to the<br />
frontend electronics needs to be exchanged. In addition,<br />
this modular approach allows an efficient development of<br />
the firmware by more than one designer. The GET4-ROC<br />
is developed as a readout logic module in the “Universal<br />
ROC” design. More details concerning the “Universal<br />
ROC” design can be found in [2].<br />
Readout Logic<br />
Until now a basic readout module for the GET4 chips has<br />
been developed. Figure 1 shows an overview of the ROC.<br />
First the serial data is sampled and deserialized. Then<br />
the decoded data is combined into a single data stream.<br />
At the moment a simple round robin algorithm is implemented.<br />
This stage also performs very basic message building.<br />
For future versions a slightly more complex token ring<br />
readout in combination with improved message building is<br />
planned. The sampling on the data ports can be switched<br />
off by a configurable mask register (e.g. to avoid ghost data<br />
from unconnected ports).<br />
The ROC also needs to provide a control interface to the<br />
GET4 chips and to the ROC itself. Single commands can<br />
be send via transport logic to the ROC. In case of a command<br />
for the GET4 chips, this command is passed to the<br />
GET4-boards (the so called FEET boards) via a serializer.<br />
On default, the command is sent to every connected FEET<br />
board. To address only specific boards the control path im-<br />
plements a configurable mask register as well.<br />
serial clock<br />
serial data<br />
serial control<br />
Masks<br />
Mask<br />
Serial Clock<br />
Generator<br />
Frontend<br />
Module<br />
Transport<br />
Module<br />
Deserializers<br />
Serializer<br />
com−<br />
bine<br />
Control<br />
Logic<br />
FIFO<br />
Optical<br />
Readout<br />
Logic<br />
Figure 1: Block diagram of the ROC’s functionality.<br />
Transport Logic<br />
Optics<br />
At the moment there are two transport logic modules<br />
available to connect the ROC to a DAQ-PC, Ethernet and<br />
optics (see [3] for details concerning the optics). While<br />
Ethernet is better tested and a convenient solution for small<br />
setups, some features only come with the optics module.<br />
Those features are a high bandwidth (current hardware: ca.<br />
230 MB/s) for the data readout and deterministic latency<br />
messages for synchronisation. However the optical readout<br />
chain requires an additional PCIe card, the ABB [4].<br />
Future Prospects<br />
The current version of the GET4 readout module provides<br />
a basic interface. The module is usable, however<br />
it is not feature complete. Besides the improvement of<br />
many smaller details, the features that will be developed<br />
in 2010 are a proper synchronization technique and simple<br />
data processing tasks.<br />
References<br />
[1] H. Flemming and H. Deppe, “GET4 TDC ASIC”, <strong>GSI</strong> internal<br />
report, March 2009<br />
[2] N. Abel, S. Manz and U. Kebschull, “Design and Implementation<br />
of an Universal Read Out Controller” <strong>GSI</strong> Scientific<br />
Report 2009, Darmstadt, Germany<br />
[3] F. Lemke et. al, “A Unified Interconnection Network with<br />
Precise Time Synchronization for the CBM DAQ System”,<br />
IEEE NPSS Real Time Conference, 2009, Beijing, China<br />
[4] W. Gao et. al, “Improved Active Buffer Board of CBM”, <strong>GSI</strong><br />
Scientific Report 2008, Darmstadt, Germany<br />
333
INSTRUMENTS-METHODS-54 <strong>GSI</strong> SCIENTIFIC REPORT 2009<br />
Usage of DABC in software development for CBM DAQ<br />
S. Linev 1 , J. Adamczewski-Musch 1 , and H.G. Essel 1<br />
CBM readout controller<br />
The CBM readout controller board (ROC) was developed<br />
to control nXYTER-based [1] front-end electronics<br />
and deliver data from the nXYTER to a PC via Ethernet.<br />
A first version of PC software libraries (ROClib [2]) for<br />
communication with the ROC was implemented.<br />
Then a significant redesign of this software was required<br />
because new ROC firmware will support various kinds of<br />
front-end electronics and optic transport from ROC to PC.<br />
It was necessary to separate the communication (transport<br />
layer) from the device-specific controlling and configuration<br />
(application layer).<br />
Data transport<br />
The application layer together with communication interfaces<br />
is kept in ROClib. An abstract roc::Board class<br />
defines the interface for communication and data transport.<br />
The transport layer was removed from ROClib and implemented<br />
as plug-ins of the Data Acquisition Backbone Core<br />
(DABC) [3], a general purpose data acquisition framework.<br />
DABC had already been used with the previous ROClib for<br />
building DAQ applications for ROCs.<br />
The UDP transport between ROC and PC was reimplemented<br />
with the powerfull DABC socket handling classes,<br />
allowing to handle several socket connections in one<br />
thread.<br />
Several firmware and software components were developed<br />
at Uni Heidelberg for the optic transport from ROC<br />
to PC via a PCIe board (AVNET-board). This consists of<br />
a linux driver for the board, a user-space library (mprace)<br />
and a special daemon application. Appropriate DABC device<br />
and transport classes were implemented on top of this<br />
software.<br />
Introducing a communication layer interface in ROClib<br />
allows to develop application software which is fully independent<br />
from the communication implementations like the<br />
DABC plug-ins.<br />
Control interface<br />
To control and configure different front-end electronics<br />
connected to the ROC, a control-space access interface was<br />
defined in ROClib. It consist of a single operation - noper,<br />
which is just a list of put and get register operations, implemented<br />
in the DABC plug-ins. Based on such interface,<br />
a number of device-specific classes were implemented in<br />
ROClib to configure ADCs, nXYTERs, I2C bus and other<br />
components.<br />
334<br />
1 <strong>GSI</strong>, Darmstadt, Germany<br />
Data format<br />
All data taken from one kind of front-end are packed in<br />
messages of fixed length. Message format and even message<br />
size depend on the connected electronics, firmware<br />
version and the kind of the connection. To handle all possible<br />
formats a class roc::Message was introduced. It provides<br />
a convenient way to access the data fields for any<br />
supported message type.<br />
User tools<br />
The transport and control classes are used in several applications:<br />
rocutil - command-line tool for device configuration;<br />
rocGui - Qt4-based configuration GUI;<br />
go4monitor - go4-based [4] program for taking and displaying<br />
data from a single ROC.<br />
Test beamtime 2009<br />
During September beamtime up to 6 ROCs reading data<br />
from different detectors were running in parallel. They delivered<br />
up to 30 MB/s to a single PC running the DABC<br />
data acquisition, which sorted and stored the data to listmode<br />
data files. At the same time data was monitored online<br />
by several go4monitor applications, connected to the<br />
DABC application through standard <strong>GSI</strong> data channels.<br />
Status and outlook<br />
The developed software allows to configure and run<br />
ROCs in different environments. DABC is used as core<br />
framework for the implementation of ROClib software.<br />
A succesfull beamtime was operated with a DABC-based<br />
DAQ system in September 2009. The development of the<br />
optic transport via PCIe board is mostly finished. Information<br />
and latest news on cbm-wiki.gsi.de<br />
References<br />
[1] A.S. Brogna et al., “N-XYTER, a CMOS read-out ASIC for<br />
high resolution time and amplitude measurements on high<br />
rate multi-channel counting mode neutron detectors”, Nucl.<br />
Instrum. Methods A 568 (2006), pp. 301-308<br />
[2] N. Abel et al., “Software development for CBM readout controller<br />
board”, <strong>GSI</strong> Scientific Report 2008, p. 228<br />
[3] J. Adamczewski, H.G. Essel, N. Kurz, S. Linev, “Data Acquisition<br />
Backbone Core DABC”, Journal of Physics: Conference<br />
Series 119 (2008) 022002<br />
[4] J. Adamczewski, M. Al-Turany, D. Bertini, H.G. Essel,<br />
S. Linev, “Go4 online monitoring”, IEEE Trans.on Nucl. Science,<br />
Vol.51, No.3, June 2004, pp 565-570
<strong>GSI</strong> SCIENTIFIC REPORT 2009 INSTRUMENTS-METHODS-55<br />
Development of a GEM-TPC for PANDA ∗<br />
X. Zhang † 1 ,C.Höppner 1 , B. Ketzer 1 , I. Konorov 1 , and M. Vandenbroucke 1<br />
1 Physik Department, Technische Universität München, 85748 Garching, Germany, for the GEM-TPC Collaboration<br />
The PANDA (AntiProton Annihilations at Darmstadt)<br />
experiment is an internal target experiment at the High Energy<br />
Storage Ring (HESR) for antiprotons at the new Facility<br />
for Antiproton and Ion Research (FAIR) at Darmstadt,<br />
Germany. A Time Projection Chamber (TPC) is proposed<br />
as the central tracker due to its excellent tracking and particle<br />
identification capabilities [1]. A spatial resolution of<br />
∼150 μm in the rϕ projecton and ∼1 mm in z, resulting<br />
in a momentum resolution of the order of a few percents<br />
over a range of 0.1 to 8 GeV, and a low material budget are<br />
needed by the rich physics program of PANDA.<br />
The continuous antiproton beam structure at HESR,<br />
however, makes the use of a traditional ion gate, normally<br />
used to avoid space charge accumulation, impractical.<br />
Due to their intrinsic ion backflow suppression, the<br />
use of GEM (Gas Electron Multiplier) structures [2] for gas<br />
amplication opens up the possibility to operate the TPC<br />
in an ungated mode without accumulating excessive space<br />
charge.<br />
A small GEM-TPC was built and characterized with cosmic<br />
muons [3]. The test chamber of 20 cm diameter and<br />
8 cm drift length, operates with an Ar/CO2 (70/30) gas mixture.<br />
On the readout plate, an active area of 10×10 cm 2<br />
was filled with rectangular pads of 0.8×6.0 mm 2 and covered<br />
by 3 GEM foils for electron amplification. An average<br />
resolution of 200 μm had been achived using the PASA-<br />
/ALTRO [4] readout electronics.<br />
To perform a complete characterization of the test chamber,<br />
we set up a tracking telescope on the electron accelerator<br />
ELSA in Bonn, Germany. The test bench consists of<br />
four single silicon strip detectors and 4 GEM planes, triggered<br />
by four plastic scintillators with 2×2cm 2 active area.<br />
Figure 1: Photographs of the new readout plane (left)<br />
and the Front-end Electronics (FE) card (right) which holds<br />
four AFTER chips.<br />
∗ Supported by the 6th Framework Program of the EU (Contracts<br />
No. RII3-CT-2004-506078, I3 Hadron Physics, and No. 515873-DS,<br />
DIRAC-secondary-Beams), the German Bundesministerium <strong>für</strong> Bildung<br />
und Forschung, the Maier-Leibnitz-Labor der LMU und TU München,<br />
and the DFG Cluster of Excellence “Origin and Structure of the Universe”.<br />
† xzhang@e18.physik.tu-muenchen.de<br />
Figure 2: The GEM detector of the GEM-TPC prototype<br />
with 42 FE cards (See Fig. 1).<br />
In addition, the TPC test chamber was upgraded before<br />
its installation in the test setup. The readout plane<br />
was changed from rectangular pads to hexagnal pads of<br />
1.25 mm and 1.5 mm outer radius, respectively(See Fig. 1).<br />
Another main improvement is the use of a new readout<br />
based on the AFTER (Asic For TPC Electronic Readout)<br />
chip developed by CEA Saclay for the T2K experiment [5].<br />
This 72 channels ASIC contains an analog memory, based<br />
on a switched capacitor array of 511 cells which can be<br />
read by a custom-made ADC sampling at 10 to 50MHz.<br />
The full front-end electronics reaches a good noise performance<br />
of 800 e − at an input capacitance of 10 pF. The<br />
tracking telescope was successfully commissioned in December<br />
2008 and has started to record data. First signals<br />
have been observed in the GEM-TPC. The texternal<br />
tracking and the very good noise performance of the readout<br />
electronics will allow a precise measurement of spatial<br />
resolution, drift velocity and charge accumulation inside<br />
the TPC. These properties will be further investigated with<br />
larger GEM-TPC prototypes (30 cm of diameter, 73 cm of<br />
drift length) currently built for the FOPI experiment at <strong>GSI</strong><br />
and Crystal Barrel at ELSA. Fig. 2 shows its GEM detector<br />
which is being tested in our lab.<br />
References<br />
[1] Technical Progress Reports for PANDA, 2005, http://wwwpanda.gsi.de/archive/public/panda<br />
tpr.pdf.<br />
[2] F. Sauli, GEM, Charge transfer and charge broading of<br />
GEM structures in high magnetic fields, Nucl. Instr. Meth.<br />
A386 (1997) 531.<br />
[3] Q. Weitzel et al., Development of a High-Rate GEM-Based<br />
TPC for PANDA, IEEE Nucl. Sci. Symp. Conf. Rec. (2007).<br />
[4] L.Musa et al., The ALICE TPC Front End Electronic, Proceedings<br />
of the IEEE Nucl. Sci. Symp., Portland (2003).<br />
[5] P. Baron et al., AFTER, an ASIC for the readout of the<br />
Large T2K Time Projection Chambers, Nuclear Science,<br />
IEEE Transactions on Vol. 55, Issue 3, (2008).<br />
335
INSTRUMENTS-METHODS-56 <strong>GSI</strong> SCIENTIFIC REPORT 2009<br />
Introduction<br />
The developed Front End Board with optical link EXtension<br />
(FEBEX) is designed for parallel analogue signal<br />
readout. The input stage of the board consists of 12 bit<br />
sampling ADCs. With the implemented FPGA a pulseshape<br />
analyse is destined. The FEBEX - board is used for<br />
a matrix readout of the preamplifier shaper ASICs (APD<br />
PANDA Front End Link (APFEL)) which are developed<br />
by the EE ASIC group for the electromagnetic calorimeter<br />
(EMC) of the PANDA experiment[1].<br />
Preamplifier shaper ASIC APFEL<br />
The charge sensitive preamplifier and shaper ASIC<br />
APFEL developed for the EMC of the PANDA experiment<br />
is optimised for the readout of avalanche photo diodes<br />
(APD) with a capacitance of 300 pF. It is able to cope with<br />
an event rate of 300 kHz. At the forseen operation temperature<br />
of T= −20 ◦ C and a detector capacitance of 300 pF<br />
an equivalent noise charge (ENC) of 4334 e − ± 28 e −<br />
was measured. Together with the maximum input charge<br />
of 6 pC this leads to a dynamic range of over 10 000. The<br />
power consumption is 49.5 mW / channel. These results of<br />
the preamplifier shaper ASIC are in excellent agreement<br />
with simulations and fulfil the given requirements[1].<br />
FEBEX - Board<br />
Figure 1: Picture of the FEBEX - board[2] (courtesy of<br />
G. Otto).<br />
336<br />
∗ Work supported by EU (contract number: RII3-CT-2004-506078)<br />
Readout Chain for the PANDA EMC ∗<br />
Peter Wieczorek 1 and Jan Hoffmann 1<br />
1 <strong>GSI</strong>, Experiment Electronics, Darmstadt, Germany<br />
Figure 1 shows the FEBEX - board. The input side comprises<br />
8 differential analogue inputs which are connected<br />
to the ADCs. The used ADC has an input range of ± 1 V<br />
with a resolution of 12 bit and a sampling rate of 65 MS/s.<br />
An implemented FPGA is forseen for pulseshape analysis.<br />
The data transfer is done over an optical link[2].<br />
ASIC Matrix readout<br />
Figure 2: Picture of the matrix readout (courtesy of<br />
G. Otto).<br />
In the end of 2009 first electronic tests were successful<br />
completed. In the next step a matrix of 16 lead tungstate<br />
crystals will be assembled. Each crystal will be equipped<br />
with an APD detector which is read out by the charge sensitive<br />
preamplifier shaper ASIC.<br />
The differential analogue output signals of the ASIC are<br />
digitised by the FEBEX - board. Afterwards the data collection<br />
will be done over an optical link to the <strong>GSI</strong> Multi<br />
Branch System (MBS)[3]. The overview of the mounted<br />
setup is shown in figure 2. For the visualisation of the data<br />
the <strong>GSI</strong> Objected Oriented On - line Off - line system (Go4)<br />
will be used[4].<br />
The in figure 2 presented setup is prepared for the cosmic<br />
radiation measurements which are scheduled in March.<br />
During the next year more detailed beam tests are intended.<br />
References<br />
[1] P. Wieczorek and H. Flemming, “Low noise preamplifier<br />
ASIC for the PANDA EMC”, <strong>GSI</strong> Scientific Report 2006,<br />
June 2007 p. 4.<br />
[2] J. Hoffmann, <strong>GSI</strong>: http : //www.gsi.de/informationen<br />
/wti/ee/elekt entwicklung/febex.html<br />
[3] N. Kurz, <strong>GSI</strong>: http : //www − win.gsi.de/daq/<br />
[4] J. Adamczewski - Musch, <strong>GSI</strong>:<br />
http : //www − win.gsi.de/go4/
<strong>GSI</strong> SCIENTIFIC REPORT 2009 INSTRUMENTS-METHODS-57<br />
<strong>GSI</strong>Template2007<br />
The PANDA GEM-TPC prototype*<br />
B. Voss, R. Arora, M. Henske, V. Kleipa, J. Kunkel, C.J. Schmidt, S. Schwab, D. Soyk, J. Weinert<br />
<strong>GSI</strong>, Darmstadt, Germany.<br />
A Time-Projection Chamber (TPC) [1] is an ideal candidate<br />
for the central tracking device inside the target<br />
spectrometer of PANDA@FAIR due to its excellent tracking<br />
performance and particle identification capabilities,<br />
combined with a small material budget. Its operation in<br />
the antiproton storage ring HESR at a ‘standard’ rate of<br />
2·10 7 pp-bar annihilations per second, however, requires a<br />
continuous sampling of incoming signals leading to event<br />
mixing. The use of GEM technology for charge amplification<br />
provides the means to achieve the required resolution<br />
and to suppress the accumulation of space charge in the<br />
drift volume. We currently foresee 3 stages with 8 cakelike<br />
sectors per foil in CERN ‘standard’ configuration<br />
(Cu/Kapton ® 5/50µm thickness and double-conical hole<br />
pattern 50/70/140µm ∅Cu/∅K/distance). The leakage current<br />
at 550V has been measured to be (3.1±1.8) nA for 10<br />
foils with a maximum value of 6.3 nA which is very well<br />
acceptable.<br />
For in-lab tests, a pad plane with 10000 hexagonal<br />
pads as shown in fig. 1 has been built. Its shape conforms<br />
to the design values within an accuracy of well below<br />
0.1mm. It features common electrical support, coding of<br />
the front-end boards and a variety of sensor controls.<br />
For test purposes it is foreseen to read out the detection<br />
systems using a future version of the data driven XYTER<br />
ASIC offering 128 ch/chip of charge sensitive amplifiers,<br />
fast (30 ns) & slow (150 ns) shapers, a peak detector, 1 ns<br />
time stamping and a de-randomizing, sparsifying 32 MHz<br />
425e<br />
token-ring readout. The measured noise value of ¡<br />
-<br />
@5..10pF is close to the design-value of 370e - @10pF /<br />
550e - @20pF and sufficient for the PID by the TPC. The<br />
current version AMS-CMOS-0.35µm technology needs<br />
21 mW/ch of power requiring an effective cooling system<br />
to get rid of 0.5 kW heat dissipated. For this purpose, a<br />
heat-piping system (see fig. 2) with a minimized number<br />
of joints is operated with liquid coolant HFE7100 under<br />
4 bar overpressure and turbulent flow of 3 l/h.<br />
Most of the ongoing work is now focussing on the construction<br />
and testing of the field-defining system (see<br />
fig. 3). Its length has been extended to 702 mm to cope<br />
with the needs of the crystal-barrel experiment at ELSA<br />
/Bonn. The simulations show that a strip width and gap of<br />
the staggered strip-lines of 1 mm and 0.5 mm, respectively,<br />
keep the field inhomogeneities in the vicinity of the<br />
walls in an acceptable range. The GEM-TPC prototype<br />
will be tested early 2010 at CB@ELSA and FOPI@<strong>GSI</strong><br />
References<br />
[1] Voss B. et al., <strong>GSI</strong> Scientific Report 2008, <strong>GSI</strong> Re<br />
port 2009-1, p.238.<br />
* Work supported by the EU 7 th framework program<br />
(I3HP2).<br />
Figure 1: Features and characteristics of the pad plane.<br />
Figure 2: Details of the heat piping system.<br />
Figure 3: Design and simulation details of the field-cage.<br />
337
INSTRUMENTS-METHODS-58 <strong>GSI</strong> SCIENTIFIC REPORT 2009<br />
338<br />
<strong>GSI</strong>Template2007<br />
The GEM-Discs for the PANDA experiment*<br />
The Setup<br />
In the PANDA experiment particles emitted at angle below<br />
22° may not be fully covered by the Central Tracker<br />
in the target spectrometer. They will be tracked with a set<br />
of up to four large-area planar gaseous micro-pattern detectors<br />
based on GEM foils as amplification stages [1]. A<br />
sketch of their design is shown in fig. 1.<br />
Figure 1: Sketch of the build-up of a single GEM-Disc.<br />
In order to optimize the acceptance, these GEM-<br />
Trackers have to be of large diameters Ø0.9m (2x), 1.12m<br />
and 1.48m and will be placed 0.81m, 1.17m, 1.53m and<br />
1.89m downstream of the target, respectively. The current<br />
design assumes up to four double planes with two projections<br />
per plane. With the envisaged position resolution of<br />
0.1mm the system promises sufficient momentum resolution<br />
and a double track resolution of 10mm and 5°, respectively,<br />
in the range of forward angles of 4-5 up to 18-<br />
20° (depending on the available space).<br />
Beam<br />
pipe…<br />
Inner | Outer area…<br />
Figure 2: Simulation of the particle flux.<br />
The chambers have to sustain a high counting rate of<br />
particles peaked at the most forward angles due to the<br />
relativistic boost of the reaction products as well as due to<br />
the small angle pp-bar elastic scattering. According to<br />
simulations [2] of the particle flux as shown in fig. 2 for<br />
the envisaged luminosity, the expected hit rate in the first<br />
chamber is about 8*10 4 cm �2 s �1 in the vicinity of the 6.5<br />
cm diameter beam pipe. The track length to be recorded<br />
inside the active volumes of the detectors will be 0.5-<br />
8mm (mean 1.3-1.6mm) in radial and 0-0.8°(mean 0.15°)<br />
in angular direction. The expected cluster sizes are
<strong>GSI</strong> SCIENTIFIC REPORT 2009 INSTRUMENTS-METHODS-59<br />
Performance of the ALICE TRD with first LHC collisions<br />
In December 2009 a milestone of the ALICE Transition<br />
Radiation Detector (TRD) [1] was marked when the detector<br />
was turned on to record tracks of particles produced by<br />
first stable beams in collision at the Large Hadron Collider.<br />
We report here the performance of the detector during the<br />
ensuing data taking period of 2 weeks.<br />
Of the 18 TRD supermodules, 7 are currently installed in<br />
the ALICE setup. Assembly and testing is ongoing for the<br />
rest, envisioned to be installed during the next LHC shutdown<br />
period end of 2010. The LHC provided beams at the<br />
injection energy of 450 GeV per beam, with bunch intensities<br />
of up to 10 10 protons. Triggering with the Silicon<br />
Pixel Detector and the V0 detector, ALICE acquired about<br />
2.5·10 5 events with a good collision vertex. About 90%<br />
of the 210 individual chambers in the TRD recorded data<br />
at their nominal settings. Chamber calibration [2] was performed<br />
both online and based on a dedicated reconstruction<br />
pass performed at <strong>GSI</strong>.<br />
dN/dQ<br />
Average signal (ADC ch.)<br />
0.09<br />
0.08<br />
0.07<br />
0.06<br />
0.05<br />
0.04<br />
0.03<br />
0.02<br />
0.01<br />
pp@LHC<br />
p=1 GeV/c<br />
electrons<br />
pions<br />
testbeam (2002)<br />
0<br />
0 10 20 30 40 50 60 70 80 90<br />
250<br />
200<br />
150<br />
100<br />
50<br />
Integral signal Q (arb. units)<br />
0 5 10 15 20 25 30<br />
The ALICE TRD collaboration ∗<br />
Time bin (100 ns)<br />
Figure 1: Integral charge deposit (top) and average signal<br />
as a function of time (bottom) for pions and electrons of 1<br />
GeV/c.<br />
In Fig. 1 we show for all chambers the integral charge<br />
deposit per chamber for pions and electrons as well as the<br />
average signal as a function of drift time. For these studies<br />
an electron-enriched sample is selected employing reconstructed<br />
photon conversion candidates, while the pions<br />
are selected from reconstructed K 0 s<br />
mesons. Cuts in the<br />
dE/dx signal of the TPC were additionally employed. Good<br />
agreement with data measured earlier in testbeams is ob-<br />
∗ The list of members and institutions is available at<br />
http://www-alice.gsi.de/trd<br />
served. The TR signature of electrons, manifested in the<br />
average signal increase at late drift times is also evident.<br />
TRD-TPC matching efficiency<br />
1<br />
0.8<br />
0.6<br />
0.4<br />
0.2<br />
positives<br />
negatives<br />
0<br />
0 0.5 1 1.5 2 2.5 3 3.5 4 4.5<br />
p (GeV/c)<br />
t<br />
Figure 2: TRD-TPC track matching efficiency as a function<br />
of transverse momentum.<br />
In Fig. 2 we show the track matching efficiency between<br />
the TRD and TPC, demonstrating the good performance of<br />
the detector and reconstruction algorithm.<br />
An important prerequisite for global tracking is to properly<br />
account for the actual positions of the involved detectors.<br />
The relative alignment between the TPC and TRD was<br />
studied using cosmic muons collected within four months<br />
prior to the LHC startup. Without alignment, the residual<br />
distance between the TRD tracklets and the TPC tracks<br />
extrapolated to the TRD (dashed histogram in Fig. 3) indicates<br />
that the TRD supermodules were displaced by up<br />
to 1-2 cm with respect to the TPC. Applying the alignment<br />
parameters deduced from the cosmic muon tracks for the<br />
reconstruction of the pp collisions leads to the drastically<br />
reduced residuals shown as the solid histogram in Fig. 3.<br />
4000<br />
3500<br />
3000<br />
2500<br />
2000<br />
1500<br />
1000<br />
500<br />
before alignment<br />
(cosmics)<br />
after alignment<br />
(pp collisions)<br />
0<br />
-5 -4 -3 -2 -1 0 1 2 3<br />
y - y (cm)<br />
TRD extrap. TPC<br />
Figure 3: The rφ position residuals of the TRD w.r.t. extrapolated<br />
tracks from the TPC.<br />
References<br />
[1] ALICE Transition Radiation Detector Technical Design Report,<br />
ALICE TDR 9, CERN/LHCC 2001-021.<br />
[2] R. Bailhache et al., this Report.<br />
339
INSTRUMENTS-METHODS-60 <strong>GSI</strong> SCIENTIFIC REPORT 2009<br />
Gain Calibration of the ALICE TRD with Krypton ( m83 Kr)<br />
M. Al Helwi 1 , A. Andronic 3 , Y. Pachmayer 1 , N. Pitz 2 , C. Garabatos 3 , K. Schweda 1,3 , J. Stachel 1 , and<br />
J. Wiechula 1<br />
1 University of Heidelberg, Heidelberg, Germany; 1 University of Frankfurt, Frankfurt, Germany;<br />
3 <strong>GSI</strong> Helmholtz Centre for Heavy Ion Research, Darmstadt, Germany<br />
The Transition-Radiation Detector (TRD) of ALICE at<br />
the LHC is designed for electron identification, charged<br />
particle tracking and providing a fast trigger. The TRD<br />
consists of 18 super-modules with 540 readout drift chambers<br />
filled with Xenon gas. The large active area of roughly<br />
700 m 2 is covered by about 1.2 million readout channels.<br />
Traversing charged particles ionize the gas along their path<br />
creating secondary electrons. These electrons drift in a uniform<br />
field of 700 V/cm over 3 cm before being amplified.<br />
In order to guarantee a high quality of the collected data a<br />
uniform gain is essential. The gain contains both gas and<br />
electronics response which may vary throughout the detector.<br />
These gain parameters can be determined with a dedicated<br />
calibration run using Krypton. During the run, the radioactive<br />
m83 Kr was distributed homogeneously in the TRD volume<br />
by the gas circulation system.<br />
This method allows a pad per pad calibration of the 7 TRDsuper-modules<br />
installed in ALICE during the 2009 data and<br />
calibration run. The radioactive 83 Rb decays to metastable<br />
m83 Kr by β-decay. 83 Rb is solid and therefore it allows to<br />
be placed into the gas stream via a by-pass line.<br />
The gaseous m83 Kr disperses throughout the entire TRD<br />
gas volume. It has a lifetime of 2,64h, which is short<br />
enough to ensure the chamber to be operated normally once<br />
a few lifetimes passed after cutting off the Krypton supply<br />
to the chamber. Thus no disposal of radioactive gas is<br />
necessary. On the other hand, it is long enough to be distributed<br />
in all chambers resulting in a sufficient number of<br />
decays. The metastable m83 Kr decays through emissions<br />
of electrons with kinetic energies corresponding to the expected<br />
energy deposition of particles produced in heavy ion<br />
collisions (Fig.1).<br />
Figure 1: 83 Rb and 83 Kr energy level scheme. This figure<br />
has been taken from [1]<br />
The Krypton data taking started on the 31 st of August<br />
2009 and ended on the 25 th of September 2009. In this period<br />
of time about 800 million events were taken with dif-<br />
340<br />
ferent high voltage (1450 V , 1470 V ) and magnetic field<br />
settings (0 T , 0.2 T , 0.5T ). Approximately five Krypton<br />
decays per event are expected. The size of the raw data<br />
was circa 30 T B which was reduced to circa 10 T B after<br />
reconstruction.<br />
A cluster finder algorithm that reconstructs the energy deposition<br />
in TRD from the m83 Kr decays was developed.<br />
Furthermore, cuts to significantly reduce noise were implemented.<br />
Figure 2 shows the Krypton energy spectrum for<br />
Counts<br />
Counts<br />
3<br />
× 10<br />
100<br />
80<br />
60<br />
40<br />
20<br />
83m<br />
Kr --> e- + Kr<br />
Resolution 15 %<br />
9.39 11.9 19.6 27.5 32.3 41.55<br />
0<br />
0 1000 2000 3000 4000<br />
Energy [ADC Counts]<br />
80<br />
60<br />
40<br />
20<br />
0<br />
0 1000 2000 3000 4000<br />
Energy [ADC Counts]<br />
Figure 2: caption: Top: Experimental Krypton spectrum of<br />
a single TRD chamber, the arrows shows the energy in keV.<br />
Bottom: Experimental Krypton spectrum for a single pad.<br />
one chamber with 2304 pads and for one pad using approximately<br />
10% of the statistics.The peak around ADC channel<br />
#2700 correspond to electron energies of 41.55 keV.<br />
Since this is the most likely decay channel, this peak will<br />
be used for the calibration. The other peaks provide information<br />
for cross checks.<br />
The final goal is to provide pad by pad gain tables to be<br />
uploaded in the TRD front end electronics for data taking.<br />
References<br />
[1] T. Eggert, “Calibration methods of the STAR-FTPC”, STAR<br />
Experiment at Brookhaven National Laboratory, USA.<br />
Acknowledgement: This work has been supported<br />
by the Helmholtz Association under contract numbers<br />
VH-NG-147, HA-216/EMMI and the Federal Ministry<br />
of Education and Research under promotional reference<br />
06HD9129D.
<strong>GSI</strong> SCIENTIFIC REPORT 2009 INSTRUMENTS-METHODS-61<br />
Status of the Pretrigger System for the ALICE Transition Radiation Detector ∗<br />
J. Lehnert 1 , B. Doenigus 2 , J. Klein 3 , T. Krawutschke 4 , K. Oyama 3 , R. Schicker 3 , S. Schmiederer 3 ,<br />
K. Schweda 3 , and J. Stachel 3<br />
1 Institut <strong>für</strong> Kernphysik, Univ. Frankfurt; 2 <strong>GSI</strong> <strong>Helmholtzzentrum</strong> <strong>für</strong> <strong>Schwerionenforschung</strong>, Darmstadt, Germany;<br />
3 Physikalisches Institut, Univ. Heidelberg ; 4 Fachhochschule Köln<br />
The Transition Radiation Detector (TRD)[1] of the AL-<br />
ICE experiment at the CERN Large Hadron Collider<br />
(LHC) provides electron identification and tracking in the<br />
central barrel as well as fast triggering (6 µs). The frontend<br />
electronics (FEE) consisting of 75000 multichip modules<br />
has a total power consumption of less than 65 kW by<br />
keeping the digital electronics in a low power mode after<br />
processing each event. A fast wakeup signal for the FEE is<br />
needed to capture the TRD drift signals over the full time<br />
range and to ensure a low data processing latency. This<br />
pretrigger signal has to be generated within 400 ns after<br />
an interaction, more than 1 µs ahead of the ALICE Level0<br />
(L0) trigger. It is based on the signals from the fast ALICE<br />
subdetectors TOF, V0 and T0, or alternatively derived from<br />
the LHC bunch counter (BC).<br />
The pretrigger system[2] consists of a number of specific<br />
hardware components (see Fig.1) which are mounted<br />
inside the L3 magnet close to the respective detectors to<br />
minimize signal propagation delays. For the TOF detector,<br />
a single field programmable gate array(FPGA), the TLMU,<br />
evaluates 576 digital bits from the entire barrel region and<br />
provides trigger signals for configurable multiplicity conditions<br />
or geometrical correlations.<br />
Figure 1: Schematic overview of the pretrigger system.<br />
For the V0 and T0 detectors, preamplified analog signals<br />
from 44 channels on each side of the interaction point<br />
are discriminated in 5 front-end boxes (FEBs) and used as<br />
input to three stages of look up tables implemented in FP-<br />
GAs. Their signals are combined in one control box on<br />
each side (CB-A and CB-C). One central trigger box (CB-<br />
B) processes trigger signals from each side of the forward<br />
detectors, from the TLMU and the central ALICE trigger<br />
processor. The CB-B provides event-synchronous alignment<br />
of signals from the different sources, combines them<br />
into a trigger decision and generates a pretrigger signal for<br />
∗ This work has been supported by the Helmholtz Association under<br />
contract numbers VH-NG-147, HA-216/EMMI and the Federal Ministry<br />
of Education and Research under promotional reference 06HD9129D.<br />
the TRD FEE (see Fig.2). The CB-B also generates a contribution<br />
for the ALICE L0 trigger.<br />
In 2009, the full pretrigger hardware and improved code<br />
versions of the most critical FPGA designs were commissioned.<br />
Tests were performed with the individual detectors<br />
either with cosmics (TOF) or with LED/laser pulsers<br />
(V0,T0), and the whole pretrigger functionality including<br />
communication with CTP and FEE was established.<br />
Figure 2: Screenshot from CB-B internal timing analyzer<br />
for single p+p collision.<br />
The TRD pretrigger system was operational during the<br />
data taking period of ALICE with p+p collisions in the end<br />
of 2009. For the initial accelerator conditions with only 2<br />
or 4 bunches in each beam, a BC trigger was used. The BC<br />
trigger on the filled bunches is internally generated in the<br />
CB-B and synchronized with the accelerator bunch clock.<br />
This trigger on each potential interaction allows pretrigger<br />
operation without any potential efficiency loss due to<br />
the detectors used in the pretrigger. With the periodic BC<br />
trigger, pretrigger rates up to 300 kHz were reached, limited<br />
only by the FEE power consumption. A V0 based<br />
pretrigger was evaluated, which is needed for more than<br />
16 bunches per beam. A pretrigger should be generated<br />
for each L0 trigger, and a preliminary analysis of the data<br />
shows a V0 pretrigger efficiency >99% with respect to the<br />
V0 based ALICE L0 trigger. The pretrigger system was<br />
also operational with a setup including both TOF and V0<br />
pretrigger. More detailed investigations are needed in order<br />
to estimate the performance of this setup.<br />
For the run period in early spring 2010, optimizations of<br />
pretrigger settings and more detailed investigations of pretrigger<br />
efficiency under various conditions are foreseen and<br />
the full pretrigger DCS functionality will be implemented.<br />
References<br />
[1] ALICE Transition Radiation Detector Technical Design Report,<br />
ALICE TDR 9, CERN/LHCC 2001-021.<br />
[2] S. Schmiederer, Diploma Thesis, Heidelberg 2009<br />
341
INSTRUMENTS-METHODS-62 <strong>GSI</strong> SCIENTIFIC REPORT 2009<br />
Calibration of the ALICE Transition Radiation Detector with the First Proton<br />
Beam Data ∗<br />
R. Bailhache † 1 , F. Kramer 1 , T. Bird 2 , A. Andronic 3 , I. Arsene 3 , C. Blume 1 , J. Book 1 , and<br />
H. Appelshäuser 1<br />
1 Geothe-University, Frankfurt, Germany; 2 University of Southampton, United Kingdom; 3 <strong>GSI</strong>, Darmstadt, Germany<br />
The ALICE Transition Radiation Detector (TRD)[1] is<br />
a gaseous detector for electron identification, charged particle<br />
tracking, and triggering. When a charged particle<br />
crosses the gas volume it ionizes the gas along its path and<br />
electrons drift in a uniform field of 700 V/cm over 3 cm<br />
before being amplified. To optimize the detector performance,<br />
the drift velocity of the electrons and the amplification<br />
factor have to be corrected for variations of the temperature,<br />
pressure, and gas composition.<br />
In December 2009 the 7 TRD supermodules installed in the<br />
ALICE setup took data together with the other detectors<br />
during the crossing of the first proton beams in the LHC.<br />
About 10 % of the 210 TRD chambers were for technical<br />
reasons not operated with their nominal anode or drift voltage<br />
and therefore ignored by the calibration procedure.<br />
In the future, the calibration constants will be calculated<br />
during data taking with the High Level Trigger cluster[2].<br />
The procedures have been partially tested with cosmic-rays<br />
data. A dedicated reconstruction pass performed at <strong>GSI</strong><br />
was used to determine the calibration constants.<br />
s]<br />
µ<br />
Drift Velocity [cm/<br />
3<br />
2.5<br />
2<br />
1.5<br />
1<br />
0.5<br />
Measurement<br />
Magboltz Simulations 85% Xe<br />
0<br />
100 200 300 400 500 600 700 800 900<br />
Electric field E [V/cm]<br />
Figure 1: Drift velocity as function of the drift voltage in<br />
the chambers compared to Garfield simulations.<br />
Fig. 1 shows the drift velocity of each chamber as function<br />
of their electric drift field for the run 104892. The results<br />
are compared to Magboltz simulations done for the corresponding<br />
gas mixture (Xe,CO2(15 %)) at 1000 mbar.<br />
The amplification factor was determined for each chamber.<br />
The variations of the temperature, pressure, and gas<br />
composition produce an overall shift of the gas gain. After<br />
normalization the gains can be compared from one run<br />
to another to estimate the accuracy of the gain calibration<br />
chamber by chamber. With the statistics available, an accu-<br />
342<br />
∗ Work supported by BMBF and <strong>GSI</strong><br />
† rbailhache@ikf.uni-frankfurt.de<br />
racy of about 5 % has been reached. Fig. 2 shows the gas<br />
gain for two different runs. In run 104892 some chambers<br />
with reduced anode voltage and therefore lower gain have<br />
been calibrated as well.<br />
Gas gain<br />
2<br />
1.8<br />
1.6<br />
1.4<br />
1.2<br />
1<br />
0.8<br />
0.6<br />
0.4<br />
0.2<br />
Gain for run 104792<br />
Gain for run 104892<br />
0<br />
0 100 200 300 400 500<br />
Detector number<br />
Figure 2: Gas gain for runs 104792 and 104892.<br />
The gas gain and drift velocity constants found there<br />
were used to adjust the anode and drift voltages of the<br />
chambers to equalize their response. A first look at run<br />
105160, taken after the High Voltage (HV) adjustment,<br />
shows a smaller dispersion of the chamber gain factors (8 %<br />
against 14 %).<br />
Furthermore, the procedures for storing the detector configuration<br />
and status [3] have been extended. In addition<br />
to the front end electronics also the global tracking unit<br />
(GTU) is now read out twice for each run via the DIM protocol<br />
[4]. New methods have been put in place to assure<br />
that data has been transmitted correctly. The central communication<br />
proxy has been included into the standard alarm<br />
system for immediate reaction upon an error. The output,<br />
which is stored in the ALICE offline calibration database,<br />
is now read and used during data reconstruction.<br />
References<br />
[1] ALICE Transition Radiation Detector Technical Design Report,<br />
ALICE TDR 9, CERN/LHCC 2001-021.<br />
[2] T.Rascanu et al., <strong>GSI</strong> Scientific Report 2009.<br />
[3] F.Kramer et al., <strong>GSI</strong> Scientific Report 2008, Instruments-<br />
Methods-49, 269<br />
[4] C. Gaspar et al., “DIM”, International Conference on Computing<br />
in High Energy and Nuclear Physics (Padova, Italy,<br />
1-11 February 2000).
<strong>GSI</strong> SCIENTIFIC REPORT 2009 INSTRUMENTS-METHODS-63<br />
Implementation of the ALICE TRD into the High-Level-Trigger ∗<br />
T. Rascanu † , H. Appelshäuser, A. Arend, R. Bailhache, H. Büsching, J. Ulery<br />
for the ALICE collaboration, Institut <strong>für</strong> Kernphysik, Goethe - Universität Frankfurt am Main, Germany<br />
In this report, we describe the development, optimization<br />
and implementation of ALICE Transition Radiation<br />
Detector (TRD) [1] specific components into the<br />
High Level Trigger (HLT) [2] of the experiment.<br />
The TRD High Level Trigger components<br />
The ALICE High Level Trigger is a high performance<br />
computer cluster which provides the possibility of an online<br />
analysis of detector data from the ALICE experiment<br />
at the CERN LHC. With this online analysis it is possible<br />
to distinguish rare and interesting physics scenarios<br />
from frequently occurring and well known events. It<br />
also enables the various subdetector systems to perform<br />
online calibration, monitoring, and quality assurance.<br />
The HLT framework handles data transport and provides<br />
the infrastructure to integrate detector specific components.<br />
The current TRD specific analysis chain in the HLT is<br />
laid out as follows: The TRD cluster and track finding<br />
components (AliHLTTRDClusterizerComponent and<br />
AliHLTTRDTrackerV1) derive directly from the offline<br />
analysis components [3]. They have been modified and<br />
optimized in terms of processing rates to the requirements<br />
of the HLT online analysis system. The calibration<br />
component (AliHLTTRDCalibrationComponent) has been<br />
adapted from the offline calibration procedure. The<br />
monitoring components for quality assurance (AliHLT-<br />
TRDClusterHistoComponent and AliHLTTRDTrackHistoComponent)<br />
have been specifically designed for the<br />
HLT-TRD. The analysis chain is depicted in Figure 1. The<br />
trigger component AliHLTTRDTriggerClusterMulticity is<br />
the first approach to determine a trigger decision based on<br />
TRD information.<br />
Current status<br />
The HLT-TRD components have successfully been integrated<br />
into the High Level Trigger framework. During the<br />
data taking of the ALICE TRD in the year 2009 the components<br />
have intensively been tested in several scenarios<br />
(cosmic runs, data taking with krypton gas for calibration,<br />
and during the first pp-collisions). The stability and reliability<br />
of the software has been demonstrated. By using<br />
the designated HLT-TRD hardware infrastructure an overall<br />
event processing rate of more than 900 Hz was achieved<br />
∗ Work supported by BMBF and <strong>GSI</strong><br />
† rascanu@ikf.uni-frankfurt.de<br />
AliHLTtrigger<br />
Agent<br />
AliHLTTriggerTRD<br />
ClusterMul�pliciy<br />
AliHLTTRDCallibra�on-<br />
Component<br />
RORC_Publisher<br />
AliHLTTRDClusterizer-<br />
Component<br />
AliHLTTRDTrackerV1-<br />
Component<br />
AliHLTGlobalESD-<br />
ConverterComponent/<br />
TrackMergerComponent<br />
AliHLTTRDClusterHisto-<br />
Component<br />
AliHLTTRDTrackHisto-<br />
Component<br />
Figure 1: Data flow scheme for the HLT-TRD-<br />
Components. Dashed boxes represent components of the<br />
HLT framework.<br />
for real pp-collision data in the complete chain. This event<br />
processing rate is the result of an intense optimization cycle<br />
containing a renewed memory allocation scheme, improved<br />
raw data reading patterns of the components, refined<br />
design of the core analysis components (cluster finding<br />
and tracking) and other minor optimizations.<br />
Outlook<br />
The ALICE HLT-TRD is ready for the upcoming data<br />
taking period at LHC with pp-collisions. Further efforts<br />
will focus on the implementation of particle identification,<br />
the development of further trigger scenarios (high pT<br />
charged particle trigger and dilepton trigger) and on the optimization<br />
of the existing components with respect to the<br />
requirement of the scheduled PbPb-collisions.<br />
References<br />
[1] ALICE TRD, Technical Design Report 9, CERN / LHCC,<br />
2001-021.<br />
[2] ALICE Collaboration, Technical Design Report of the Computing,<br />
CERN / LHCC, 2005-018.<br />
[3] M. Ploskon et al., ALICE Higl-Level Trigger: Implementation<br />
of TRD-specific components, <strong>GSI</strong> Ananual Report (2007)<br />
184.<br />
343
INSTRUMENTS-METHODS-64 <strong>GSI</strong> SCIENTIFIC REPORT 2009<br />
PID and Trigger Studies for the ALICE-TRD ∗<br />
C. Klein-Bösing † 1,2 , B. Albrecht 1 , J. Anielski 1 , B. Bathen 1 , T. Dietel 1 , D. Emschermann 1,3 , H. Gatz 1 ,<br />
M. Heide 1 , M. Kalisky 1 , J. Klein 2 , F. Poppenborg 1 , M. Rammler 1 , E. Sicking 1 , M. Walter 1 , M.<br />
Wilde 1 , A. Wilk 1 , J. P. Wessels 1 , and U. Westerhoff 1<br />
1 Institut <strong>für</strong> Kernphysik, University of Münster, Germany; 2 ExtreMe Matter Institute EMMI, <strong>GSI</strong> Darmstadt, Germany;<br />
3 Physikalisches Institut, University of Heidelberg, Germany<br />
The Transition Radiation Detector (TRD) has been designed<br />
for electron/pion separation and charged particle<br />
tracking within the ALICE experiment at the LHC [1]. In<br />
addition, the TRD electronics allow to provide a fast trigger<br />
decision (within 6 µs), e.g., on high-momentum electrons<br />
or jets [2]. This fast decision is based on the reconstruction<br />
of track segments (tracklets) by the 4 CPUs in each Multi-<br />
Chip Modules (MCM) of the TRD readout electronics.<br />
To test the performance of the trigger, the MCM can be<br />
emulated in software, using real or simulated charge deposit<br />
as input. Here, the use of simulations as input allows,<br />
e.g., to directly validate the tracklet reconstruction by the<br />
MCM. This is illustrated in Fig. 1, where the resolution of<br />
the tracklet reconstruction for the y position and the inclination<br />
of the tracklet is given. For normal incidence a resolution<br />
of σy ≈ 170 µm and σ dy/dx ≈ 9 mrad is reached.<br />
μm)<br />
(<br />
σy<br />
320<br />
300<br />
280<br />
260<br />
240<br />
220<br />
200<br />
180<br />
160<br />
-4 -2 0 2 4<br />
φ (degree)<br />
(mrad)<br />
dy<br />
dx<br />
σ<br />
20<br />
18<br />
16<br />
14<br />
12<br />
10<br />
-4 -2 0 2 4<br />
φ (degree)<br />
Figure 1: Width of the residuals between the tracklet information<br />
of the MCM and the true track parameters for<br />
different inclinations of the tracklet. Left: Resolution in y<br />
direction. Right: Resolution of the tracklet slope.<br />
The separation of electrons and pions using the TRD is<br />
vital for precision measurements of quarkonia within AL-<br />
ICE. In order to reach the design goal of a pion rejection<br />
factor of 100 for electrons with momenta above 1 GeV/c at<br />
an efficiency of 90%, neural network techniques have been<br />
employed successfully in the analysis of TRD test beam<br />
data [3]. Neural networks allow to fully exploit the temporal<br />
structure of the charge deposit in the TRD, with the<br />
characteristic transition radiation for electrons at late times<br />
[4]. The PID performance for electrons has also been verified<br />
for the implementation of the TRD in the ALICE simulation<br />
framework (Fig. 2). Simulations allow to evaluate<br />
the PID capabilities for particle species not available in the<br />
test beams and with the expected particle abundances. Particles<br />
other than electrons can only be discriminated via<br />
∗ Work supported by <strong>GSI</strong>, BMBF, and Helmholtz Alliance<br />
HA216/EMMI.<br />
† Christian.Klein-Boesing@uni-muenster.de<br />
344<br />
their energy loss due to ionisation. As seen in Fig. 2 the<br />
TRD can nevertheless provide good identification of protons<br />
below 1.5 GeV/c and enhance the purity of proton<br />
and kaon samples at momenta above 4 GeV/c, where the<br />
TRD-PID reduces the contamination by roughly 50%. The<br />
poorer performance in case of muons is explained by the<br />
fact that the background under realistic conditions mainly<br />
consists of pions, which show only little difference in the<br />
energy deposit in the detector. The performance in the kaon<br />
identification can be understood by the poor rejection of pions<br />
as well as protons in the background.<br />
Contamination<br />
1<br />
-1 10<br />
-2 10<br />
-3<br />
10<br />
Contamination for<br />
Electrons<br />
Muons<br />
Pions<br />
Kaons<br />
Protons<br />
-4 10<br />
-1<br />
5× 10<br />
1 2 3 4 5 6 7 8 9 10<br />
Momentum (GeV/c)<br />
Figure 2: Remaining fraction of contamination in different<br />
identified particle samples selected with the TRD using<br />
neural networks. The particle abundances have been simulated<br />
for p + p collisions at 10 TeV, the particle efficiency<br />
is 90%.<br />
Currently, the results from the PID studies with neural<br />
networks are used for the implementation of electron PID<br />
in the ALICE-TRD trigger logic. In addition, the particle<br />
identification with real collision data at √ s = 900 GeV is<br />
pursued, using topological cuts on so-called V 0 s (e.g., photon<br />
conversions, λ and K 0 decays) and the PID information<br />
from other detectors to select reference data of identified<br />
particles for the TRD with high purity.<br />
References<br />
[1] ALICE TRD Collaboration, Transition Radiation Detector<br />
Technical Design Report, CERN/LHCC 2001-021 (2001).<br />
[2] V. Angelov, NIM A 563, 317 (2006).<br />
[3] C. Adler, NIM A 552, 516 (2005).<br />
[4] A. Andronic, <strong>GSI</strong> Scientific Report 2007, 237 (2007).
<strong>GSI</strong> SCIENTIFIC REPORT 2009 INSTRUMENTS-METHODS-65<br />
Analysis of ALICE TRD testbeam data at the PS-accelerator at CERN ∗<br />
The Transition Radiation Detector (TRD) is one of the<br />
main detectors in the ALICE experiment, the dedicated<br />
heavy ion experiment at the Large Hadron Collider (LHC)<br />
at CERN Ref. [1]. This detector consists of 18 super modules,<br />
each of them containing 30 TRD chambers. Each detector<br />
has a 4.8 cm thick radiator, which is attached to a<br />
gas chamber with a 3 cm long drift region and a 0.7 cm<br />
amplification gap.<br />
In November 2007 a test of one fully integrated TRD<br />
super module(final electronics and cooling set-up) at the<br />
CERN PS - accelerator with a mixed electron - pion beam<br />
(1, 2, 4 and 6 GeV/c) was performed.<br />
With this data set it is feasible to investigate the PID and<br />
tracking performance of the detector. The major aspect is<br />
to improve the electron PID performance.<br />
Figure 1: Average TRD signal for pions(blue) and electrons(red).<br />
The electrons have a larger dE/dx lost so the<br />
detected charge is in all time bins larger for electrons. At<br />
time bins between 18-23 we can see the characteristic tr<br />
signal for electrons.<br />
To separate electrons from pions it is possible to use two<br />
different informations from the TRD detector. First, the<br />
different overall dE/dx of charged particles with different<br />
masses defined by the Bethe Bloch energy loss.<br />
dE 4πnz2<br />
dx = mec2β 2 · ( e2<br />
4πǫ0 ) · [ln( 2mec2β 2<br />
I·(1−β 2 ) ) − β2 ]<br />
Second, the additional transition radiation signal from<br />
the electrons which happens most likely in the gas near to<br />
the radiator so we expect an additional signal at late time<br />
bins. This explains the overall average pulse height of electrons<br />
compared to pions, combined with a continuous increase<br />
of the electron pulse height towards large drift times<br />
see Fig. 1. In the normal 1d likelihood calculation we use<br />
just the total deposited charge and combine the information<br />
M. Kliemant 1 , H. Appelshaeuser 1 , and M. Hartig 1<br />
∗ This work is supported by BMBF FSP201, the <strong>GSI</strong> F&E and the<br />
Helmholtz Gemeinschaft<br />
1 IKF, UNI Frankfurt, Germany<br />
from six layers and get as an result the overall probability<br />
of a track to be an electron or pion. With the average charge<br />
spectra we calculate the likelihood as follows:<br />
L = Pe<br />
Pe+Pπ<br />
with<br />
N�<br />
Pπ = P (Xi|π) for the pion probability and<br />
i=1<br />
N�<br />
Pe = P (Xi|e) for the electron probability.<br />
i=1<br />
The product is running over the six layers , N.<br />
Figure 2: Pion rejection for different momenta (1-6 GeV).<br />
In black and red 1d likelihood method for different quality<br />
cuts. In blue 2d likelihood compared to test beam data from<br />
2004 in green.<br />
To improve the results we can go a step further and use<br />
the second information that we expect a high charge signal<br />
in late time bins. In the 2d likelihood method we use now<br />
the position of the maximum time bin and do the same calculations<br />
and combine the information from six layers like<br />
before with the 1d likelihood method. Finally, to check our<br />
analysis we can combine the 2d likelihood PID information<br />
with the Pb-glass and Cerenkov detector PID information<br />
and get a value for the pion efficiency Fig. 2. This is in<br />
agreement with further test beam data from 2004.<br />
References<br />
[1] ALICE TRD, Technical Design Report 9, CERN/LHCC<br />
2001-021.<br />
[2] R. Bailhache and C. Lippmann [ALICE TRD Collaboration],<br />
Nucl. Instrum. Meth. A 563 (2006) 310.<br />
[3] A. Wilk [ALICE TRD Collaboration], Nucl. Instrum. Meth.<br />
A 563 (2006) 314.<br />
345
INSTRUMENTS-METHODS-66 <strong>GSI</strong> SCIENTIFIC REPORT 2009<br />
Status of the ALICE TRD Global Tracking Unit ∗<br />
F. Rettig † 1,2 , S. Kirsch 2,3 , J. de Cuveland 2 , and V. Lindenstruth 2<br />
1 Kirchhoff-Institut <strong>für</strong> Physik, Universität Heidelberg, Germany; 2 Frankfurt Institute for Advanced Studies,<br />
Goethe-Universität Frankfurt, Germany; 3 CERN, Geneva, Swiss<br />
The Transition Radiation Detector (TRD, [1]) of the<br />
ALICE experiment at the LHC is designed to provide<br />
Level-1 trigger contributions on various signatures, like<br />
high-pt electron/positron pairs or jets. Short track segments<br />
calculated by more than 65 500 multi-chip modules<br />
of the front-end electronics are sent to the Global Tracking<br />
Unit (GTU, [2]) via 1 080 optical links. The GTU<br />
performs a three-dimensional reconstruction of tracks with<br />
pt > 2 GeV within less than 1.6 µs. The GTU hardware<br />
consists of 109 dedicated FPGA-based processing nodes<br />
forming a three-level hierarchy.<br />
Operation at CERN<br />
In 2009 the GTU was in continuous operation providing<br />
read-out and generation of trigger contributions of the<br />
TRD. The cosmic trigger was used to gather high-quality<br />
alignment data for all seven supermodules installed.<br />
Stable and reliable interoperation with the ALICE CTP<br />
and DAQ systems has been proven in long cosmic and calibration<br />
data-taking sessions as well as during the ALICE<br />
early partition runs – preparatory tests for first collision.<br />
Finally, during data taking with first collisions at the end<br />
of the year stable operation was shown continuously.<br />
Track Reconstruction<br />
Detailed timing simulations of the track reconstruction<br />
hardware prove that the design specifications are met.<br />
For highest multiplicities the tracking time stays below<br />
1.6 µs Careful revision of the FPGA designs reduced the<br />
ressource utilization in the Virtex-4 FX100 devices to 85%<br />
including the full tracking and trigger logic.<br />
Figure 1: Time consumption of the on-line tracking [3].<br />
346<br />
∗ Work supported by BMBF FSP201<br />
† rettig@kip.uni-heidelberg.de<br />
Commissioning and Technical Advances<br />
In order to operate the GTU within the ALICE/TRD<br />
DCS framework, a hierarchical system for monitoring and<br />
control has been developed. A master process controls the<br />
server processes on each of the DCS boards and interacts<br />
with the configuration database and the higher level control<br />
systems. Hardware parameters of interest are published by<br />
the system and a PVSS interface has been implemented.<br />
As last part of the installation the optical cabling has<br />
been finalized. Custom optical fibre bundles (Fig. 2) satisfy<br />
both the needs for reliable and tight packing as well as<br />
accessibility of the electronics hardware. All fibres were<br />
produced, those for the present segments are installed.<br />
Figure 2: Custom optical fibres connecting two GTU segments<br />
with TRD supermodules.<br />
Major technical advancements include the utilization of<br />
both embedded PowerPC cores in each of the FPGAs.<br />
Control and monitoring tasks previously occupying logic<br />
ressources is now absorbed by flexible embedded software.<br />
One core runs an embedded Linux 2.6 kernel that will be<br />
used for high-level monitoring and control. SDCard-based<br />
storage and ethernet connectivity is under development.<br />
References<br />
[1] ALICE TRD Technical Design Report, ALICE TDR 9,<br />
CERN/LHCC 2001-021<br />
[2] F. Rettig, et al., Proceedings 2008 International Conference<br />
on Field Programmable Logic and Applications, (2008)<br />
[3] J. de Cuveland, A track reconstructing low latency trigger<br />
processor for high-energy physics, Dissertation, (2009)
<strong>GSI</strong> SCIENTIFIC REPORT 2009 INSTRUMENTS-METHODS-67<br />
ALICE TPC Online Tracking on GPU<br />
D. Rohr 1 , S. Gorbunov 1,2 , and M. Kretz 1<br />
1 Kirchhoff Institute for Physics, University of Heidelberg, Germany; 2 FIAS, Frankfurt, Germany<br />
ALICE Online Tracker<br />
For the ALICE High Level Trigger a fast tracking algorithm<br />
was developed by Sergey Gorbunov based on the<br />
Cellular Automaton method and the Kalman filter [1], that<br />
is currently installed in the HLT. For an efficient handling<br />
of upcoming lead-lead collisions in 2010 with a tremendous<br />
increase of clusters and tracks, possibilities for a better<br />
usage of parallelism and many core hardware were analyzed.<br />
The tracker itself was designed with parallel approaches<br />
in mind. A SIMD approach was realized by<br />
Matthias Kretz [2] in his diploma thesis and further the<br />
tracker was adopted to run on the NVIDIA CUDA framework<br />
[3].<br />
Modern Many-Core Processors<br />
With the race for higher and higher clock frequencies<br />
having reached an end, state of the art CPUs improve in<br />
efficiency and multi-core capabilities. Graphics cards have<br />
been designed using such approaches for many years now,<br />
and just recently started to offer support for execution of<br />
general purpose code in high level languages. The GT200b<br />
chip used consists of 30 cores, providing 8 ALUs and 16kb<br />
of fast shared memory per core. For reasons such as memory<br />
latencies there should be about 256 threads running on<br />
each core, to reach a good GPU utilization.<br />
GPU Tracker<br />
For fully exploiting the GPU’s processing power many<br />
changes hat to be applied to the tracker. Major challenges<br />
hereby have been an efficient usage of the several heterogenous<br />
memory types on the GPU as well as a good overall<br />
utilization of all cores. In the later case different tracks<br />
lengths turned out to be a problem, that was solved by introducing<br />
a scheduler that dynamically distributes the workload<br />
among cores and threads. Utilization raised from 19%<br />
(Fig. 1) to 62% (Fig. 2). The implementation of simultaneous<br />
processing of multiple sectors allows the use of a<br />
processing pipeline where data processing and data moving<br />
to- and from the GPU overlap.<br />
Figure 1: Tracklet Constructor without scheduling 1<br />
Figure 2: Tracklet Constructor with dynamic scheduling 1<br />
Performance<br />
Out of the several steps involved in the tracking algorithm<br />
three have a non negligible runtime. Fig. 3 shows a<br />
performance comparison of the GPU tracker with the CPU<br />
version running on an Intel Nehalem 3.2 GHz. It demonstrates<br />
that performance for two of these three steps improved<br />
significantly. Although there is some drawback during<br />
initialization and output of the tracks, caused by GPU-<br />
Host synchronization and PCIe transfer, a complete tracking<br />
run using simulated data of a central lead-lead event<br />
was accelerated by a factor of 3.3.<br />
Component Time [μs]<br />
25000<br />
20000<br />
15000<br />
10000<br />
5000<br />
0<br />
CPU<br />
GPU<br />
Init.Neighbours Tracklet Tracklet TrackletComplete<br />
Finder Constructor SelectorOutput<br />
Run<br />
Figure 3: GPU Tracker Performance<br />
References<br />
1250<br />
1000<br />
[1] S. Gorbunov, Matthias Kretz, David Rohr “Fast Cellular Automaton<br />
tracker for the ALICE High Level Trigger”, <strong>GSI</strong> Scientific<br />
Report 2009<br />
[2] M. Kretz, “Efficient Use of Multi- and Many-Core Systems<br />
With Vectorization and Multithreading”<br />
[3] NVIDIA CUDA Reference Manual,<br />
http://developer.<strong>download</strong>.nvidia.com/compute/cuda/<br />
2 3/toolkit/docs/CUDA Reference Manual 2.3.pdf<br />
1Colors stand for: black: idling, color: working., y-axis: time, x-axis:<br />
thread<br />
347<br />
750<br />
500<br />
250<br />
0<br />
Complete Time [ms]
INSTRUMENTS-METHODS-68 <strong>GSI</strong> SCIENTIFIC REPORT 2009<br />
Fast Cellular Automaton tracker for the ALICE High Level Trigger<br />
S. Gorbunov 1,2 , M. Kretz 2 , D. Rohr 2 for the ALICE collaboration<br />
The core of the event reconstruction in ALICE is the reconstruction<br />
of particle trajectories (tracking) in TPC detector,<br />
the main tracking detector of the experiment. For<br />
this propose a fast on-line algorithm has been developed.<br />
It reconstructs all types of data including physics events,<br />
cosmics and special calibration events.<br />
Figure 1: Real proton-proton event, reconstructed in HLT<br />
The algorithm combines a Cellular Automaton<br />
method [1], which is used for a fast pattern recognition,<br />
and the Kalman filter method [2], which performs a<br />
fit of found trajectories and the final track selection. The<br />
algorithm has proved its high performance (99.9% for<br />
the proton-proton events and 95.8% for the central Pb-Pb<br />
collisions) in comparison with the off-line reconstruction<br />
(99.9% and 98.5% correspondingly). In addition to the the<br />
high efficiency, the on-line reconstruction is an order of<br />
magnitude faster than the off-line analysis: 19.6ms (pp) or<br />
17.6s (PbPb central) in comparison with 66.0ms or 160.1s<br />
for the off-line.<br />
Figure 2: Reconstruction performance for p-p (left) and<br />
central Pb-Pb (right) events<br />
Due to the large combinatorial background the key issue<br />
is the dependence of the reconstruction time on the number<br />
of tracks to be reconstructed. Figure 3 shows that the<br />
HLT tracker requires 130 us per track independent of the<br />
detector occupancy.<br />
348<br />
1 FIAS, Frankfurt, Germany; 2 KIP, Heidelberg, Germany<br />
Reconstruction time [msec]<br />
HLT CA Tracker: reconstruction time / TPC slice<br />
240<br />
220<br />
200<br />
180<br />
160<br />
140<br />
120<br />
100<br />
80<br />
60<br />
40<br />
20<br />
0<br />
0 200 400 600 800 1000 1200 1400 1600 1800<br />
N reconstructed tracks<br />
Figure 3: Reconstruction time on CPU<br />
An important feature of the algorithm is an ability to use<br />
GPU hardware accelerators, giving another order of magnitude<br />
speed-up for the on-line data processing. The GPU<br />
accelerators allow to perform a fast reconstruction of heavy<br />
ion collisions where a track density is very high.<br />
The first GPU implementation of the algorithm was developed<br />
for the NVIDIA graphic card. In addition, the<br />
algorithm was adopted for the upcoming Intel Larrabee<br />
graphic card. For this propose the code has been vectorized<br />
[3] , implying a detailed investigation of the SIMD<br />
instructions and development of general vector classes.<br />
The GPU tracker is integrated to the High Level Trigger<br />
framework and will be used for the on-line data processing<br />
in the ALICE experiment.<br />
References<br />
[1] I. Kisel, V. Kovalenko, F. Laplanche et al. (NEMO Collaboration),<br />
Cellular automaton and elastic net for event reconstruction<br />
in the NEMO-2 experiment. Nucl. Instr. and Meth.<br />
A387 (1997) 433-442.<br />
[2] R. Frühwirth et al., Data analysis techniques for high-energy<br />
physics. Second edition, Cambridge Univ. Press (2000).<br />
[3] S. Gorbunov, U. Kebschull, I. Kisel, V. Lindenstruth and<br />
W. F. J. Mller, Fast SIMDized Kalman filter based track fit.<br />
Comp. Phys. Comm. 178 (2008) 374-383.
<strong>GSI</strong> SCIENTIFIC REPORT 2009 INSTRUMENTS-METHODS-69<br />
��������������������������������������������������������������<br />
��������� � ��������������������������������<br />
�� ������������������������������������������������������������������������������<br />
������������<br />
��� � ���������� � ������� � ����� � ��� � �� � ��� � �����<br />
�������������������������������������������������������<br />
�����������������������������������������������������<br />
�� � ���� � ��� ����� ����� � �� ����� � ����� ����������� � ��<br />
������� � ��� � ���� � ����� � �� � ����������� � ��� � ������� � ���<br />
�������������������������������������������������������<br />
������ � �� � ������ � ������� � �� � � � ����� � ����� � ������ � ��<br />
��������������������������������<br />
�������������������<br />
�������������������������������������������������<br />
����������������������������������������������������������<br />
��������������������������������������������������������<br />
�������������������������������������������������������<br />
������ � ���� � ������� � �������������� � ���������� � ��� � ���<br />
������� ������� �������������� ���� ���� ��� ��������� �����<br />
����������������������������������������������������<br />
��������������������������������������������������������<br />
�� � ��� � ������� � ������������� � ����� � �� � ������� � ��� � ��<br />
��������������������������������������������������������<br />
�����������������������<br />
�� � �������� � �� �� � � ���� � ��� � ��� � ������� � �����<br />
���������������������������������������������������������<br />
��� � ���������� � ������� � ��� � ������� � ������� � ������<br />
��������������������������������������������������������<br />
�������� ���� �� � ���� � �������� � �� � ��� � ����� ��������� � ���<br />
����������������������������������������������������������<br />
������������������������������������������������������<br />
���������������������������������������������������������<br />
������������������������������������������������<br />
�����������������������������������������������������������<br />
���� � ��� � �������� � ������ � ���� � ���������� � ��<br />
���������������������������������������������������<br />
�������������� � �� � ��� � ������� � ������ � ��������� � ��� � ���<br />
��������������������������������������������������������<br />
���������������������������������������������������������<br />
<strong>GSI</strong> Templ ate2 00 7<br />
����������������������������������������������������������<br />
������������������������������������������������������<br />
��������������������������������������������������<br />
���������������������������������������������������������<br />
���������������������������������������������������������<br />
���������������� �Λ � � ����� � �� ����������������������������<br />
���������������������������������������������������������<br />
�����������������������������������������������������<br />
����������������� � ��������������������������<br />
����������������<br />
�� � ����� � ��� � ��������� � �������� � ������� � ��� � ���<br />
������������ ��� ���������������� ��������� �����������<br />
�������������������������������������������������������<br />
����������������������������������������������������<br />
����������<br />
��� ��������� � ������ � ����� � ��� � ��� � ���������<br />
���������������<br />
��� �� � ������ � �� � ��� � ��� � ����� � �������������� � ���<br />
����� � ���������� � �� � ��� � ���� � ���� � ����� ��<br />
���������������������<br />
��� �� � ������ � �� � ���� ��� � ����� � �������������� � �����<br />
�������������� � ���������� � �� � ��� � ��� � �� � ��������<br />
���� � ��� � ����� � ��������� � ����������� � �� � ���<br />
����������������������������������������������������<br />
�������������������������������������������<br />
349
INSTRUMENTS-METHODS-69 <strong>GSI</strong> SCIENTIFIC REPORT 2009<br />
350


![GS I -P-]-17 - GSI Helmholtzzentrum für Schwerionenforschung](https://img.yumpu.com/20698964/1/184x260/gs-i-p-17-gsi-helmholtzzentrum-fur-schwerionenforschung.jpg?quality=85)