Comparison of innovation policies in selected European, Asian and ...
Comparison of innovation policies in selected European, Asian and ...
Comparison of innovation policies in selected European, Asian and ...

You also want an ePaper? Increase the reach of your titles
YUMPU automatically turns print PDFs into web optimized ePapers that Google loves.
0.90<br />
0.80<br />
0.70<br />
0.60<br />
0.50<br />
0.40<br />
0.30<br />
0.20<br />
0.10<br />
0.00<br />
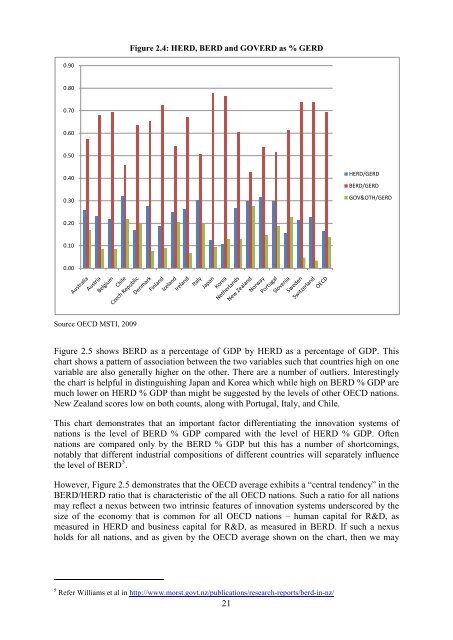
Source OECD MSTI, 2009<br />
Figure 2.4: HERD, BERD <strong>and</strong> GOVERD as % GERD<br />
Figure 2.5 shows BERD as a percentage <strong>of</strong> GDP by HERD as a percentage <strong>of</strong> GDP. This<br />
chart shows a pattern <strong>of</strong> association between the two variables such that countries high on one<br />
variable are also generally higher on the other. There are a number <strong>of</strong> outliers. Interest<strong>in</strong>gly<br />
the chart is helpful <strong>in</strong> dist<strong>in</strong>guish<strong>in</strong>g Japan <strong>and</strong> Korea which while high on BERD % GDP are<br />
much lower on HERD % GDP than might be suggested by the levels <strong>of</strong> other OECD nations.<br />
New Zeal<strong>and</strong> scores low on both counts, along with Portugal, Italy, <strong>and</strong> Chile.<br />
This chart demonstrates that an important factor differentiat<strong>in</strong>g the <strong><strong>in</strong>novation</strong> systems <strong>of</strong><br />
nations is the level <strong>of</strong> BERD % GDP compared with the level <strong>of</strong> HERD % GDP. Often<br />
nations are compared only by the BERD % GDP but this has a number <strong>of</strong> shortcom<strong>in</strong>gs,<br />
notably that different <strong>in</strong>dustrial compositions <strong>of</strong> different countries will separately <strong>in</strong>fluence<br />
the level <strong>of</strong> BERD 5<br />
.<br />
However, Figure 2.5 demonstrates that the OECD average exhibits a “central tendency” <strong>in</strong> the<br />
BERD/HERD ratio that is characteristic <strong>of</strong> the all OECD nations. Such a ratio for all nations<br />
may reflect a nexus between two <strong>in</strong>tr<strong>in</strong>sic features <strong>of</strong> <strong><strong>in</strong>novation</strong> systems underscored by the<br />
size <strong>of</strong> the economy that is common for all OECD nations – human capital for R&D, as<br />
measured <strong>in</strong> HERD <strong>and</strong> bus<strong>in</strong>ess capital for R&D, as measured <strong>in</strong> BERD. If such a nexus<br />
holds for all nations, <strong>and</strong> as given by the OECD average shown on the chart, then we may<br />
5 Refer Williams et al <strong>in</strong> http://www.morst.govt.nz/publications/research-reports/berd-<strong>in</strong>-nz/<br />
21<br />
HERD/GERD<br />
BERD/GERD<br />
GOV&OTH/GERD