Statistical properties of determinantal point processes in high ...
Statistical properties of determinantal point processes in high ...
Statistical properties of determinantal point processes in high ...

Create successful ePaper yourself
Turn your PDF publications into a flip-book with our unique Google optimized e-Paper software.
SCARDICCHIO, ZACHARY, AND TORQUATO PHYSICAL REVIEW E 79, 041108 2009<br />
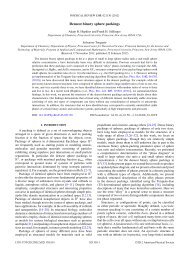
p(r)<br />
1<br />
0.9<br />
0.8<br />
0.7<br />
0.6<br />
0.5<br />
0.4<br />
0.3<br />
0.2<br />
0.1<br />
0<br />
0 0.3 0.6 0.9 1.2 1.5 1.8 2.1 2.4 2.7 3<br />
r<br />
H v (r)<br />
Numerical<br />
Simulation<br />
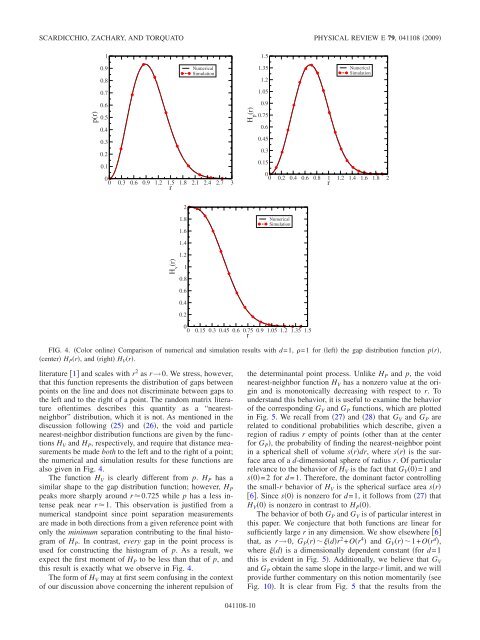
literature 1 and scales with r 2 as r→0. We stress, however,<br />
that this function represents the distribution <strong>of</strong> gaps between<br />
<strong>po<strong>in</strong>t</strong>s on the l<strong>in</strong>e and does not discrim<strong>in</strong>ate between gaps to<br />
the left and to the right <strong>of</strong> a <strong>po<strong>in</strong>t</strong>. The random matrix literature<br />
<strong>of</strong>tentimes describes this quantity as a “nearestneighbor”<br />
distribution, which it is not. As mentioned <strong>in</strong> the<br />
discussion follow<strong>in</strong>g 25 and 26, the void and particle<br />
nearest-neighbor distribution functions are given by the functions<br />
H V and H P, respectively, and require that distance measurements<br />
be made both to the left and to the right <strong>of</strong> a <strong>po<strong>in</strong>t</strong>;<br />
the numerical and simulation results for these functions are<br />
also given <strong>in</strong> Fig. 4.<br />
The function H V is clearly different from p. H P has a<br />
similar shape to the gap distribution function; however, H P<br />
peaks more sharply around r0.725 while p has a less <strong>in</strong>tense<br />
peak near r1. This observation is justified from a<br />
numerical stand<strong>po<strong>in</strong>t</strong> s<strong>in</strong>ce <strong>po<strong>in</strong>t</strong> separation measurements<br />
are made <strong>in</strong> both directions from a given reference <strong>po<strong>in</strong>t</strong> with<br />
only the m<strong>in</strong>imum separation contribut<strong>in</strong>g to the f<strong>in</strong>al histogram<br />
<strong>of</strong> H P. In contrast, every gap <strong>in</strong> the <strong>po<strong>in</strong>t</strong> process is<br />
used for construct<strong>in</strong>g the histogram <strong>of</strong> p. As a result, we<br />
expect the first moment <strong>of</strong> H P to be less than that <strong>of</strong> p, and<br />
this result is exactly what we observe <strong>in</strong> Fig. 4.<br />
The form <strong>of</strong> H V may at first seem confus<strong>in</strong>g <strong>in</strong> the context<br />
<strong>of</strong> our discussion above concern<strong>in</strong>g the <strong>in</strong>herent repulsion <strong>of</strong><br />
2<br />
1.8<br />
1.6<br />
1.4<br />
1.2<br />
1<br />
0.8<br />
0.6<br />
0.4<br />
0.2<br />
H p (r)<br />
1.5<br />
1.35<br />
1.2<br />
1.05<br />
0.9<br />
0.75<br />
0.6<br />
0.45<br />
0.3<br />
0.15<br />
0<br />
0 0.15 0.3 0.45 0.6 0.75 0.9 1.05 1.2 1.35 1.5<br />
r<br />
Numerical<br />
Simulation<br />
0<br />
0 0.2 0.4 0.6 0.8 1 1.2 1.4 1.6 1.8 2<br />
r<br />
Numerical<br />
Simulation<br />
FIG. 4. Color onl<strong>in</strong>e Comparison <strong>of</strong> numerical and simulation results with d=1, =1 for left the gap distribution function pr,<br />
center H Pr, and right H Vr.<br />
041108-10<br />
the <strong>determ<strong>in</strong>antal</strong> <strong>po<strong>in</strong>t</strong> process. Unlike H P and p, the void<br />
nearest-neighbor function H V has a nonzero value at the orig<strong>in</strong><br />
and is monotonically decreas<strong>in</strong>g with respect to r. To<br />
understand this behavior, it is useful to exam<strong>in</strong>e the behavior<br />
<strong>of</strong> the correspond<strong>in</strong>g G V and G P functions, which are plotted<br />
<strong>in</strong> Fig. 5. We recall from 27 and 28 that G V and G P are<br />
related to conditional probabilities which describe, given a<br />
region <strong>of</strong> radius r empty <strong>of</strong> <strong>po<strong>in</strong>t</strong>s other than at the center<br />
for G P, the probability <strong>of</strong> f<strong>in</strong>d<strong>in</strong>g the nearest-neighbor <strong>po<strong>in</strong>t</strong><br />
<strong>in</strong> a spherical shell <strong>of</strong> volume srdr, where sr is the surface<br />
area <strong>of</strong> a d-dimensional sphere <strong>of</strong> radius r. Of particular<br />
relevance to the behavior <strong>of</strong> H V is the fact that G V0=1 and<br />
s0=2 for d=1. Therefore, the dom<strong>in</strong>ant factor controll<strong>in</strong>g<br />
the small-r behavior <strong>of</strong> H V is the spherical surface area sr<br />
6. S<strong>in</strong>ce s0 is nonzero for d=1, it follows from 27 that<br />
H V0 is nonzero <strong>in</strong> contrast to H P0.<br />
The behavior <strong>of</strong> both G P and G V is <strong>of</strong> particular <strong>in</strong>terest <strong>in</strong><br />
this paper. We conjecture that both functions are l<strong>in</strong>ear for<br />
sufficiently large r <strong>in</strong> any dimension. We show elsewhere 6<br />
that, as r→0, G Prdr 2 +Or 4 and G Vr1+Or d ,<br />
where d is a dimensionally dependent constant for d=1<br />
this is evident <strong>in</strong> Fig. 5. Additionally, we believe that G V<br />
and G P obta<strong>in</strong> the same slope <strong>in</strong> the large-r limit, and we will<br />
provide further commentary on this notion momentarily see<br />
Fig. 10. It is clear from Fig. 5 that the results from the