Statistical properties of determinantal point processes in high ...
Statistical properties of determinantal point processes in high ...
Statistical properties of determinantal point processes in high ...

You also want an ePaper? Increase the reach of your titles
YUMPU automatically turns print PDFs into web optimized ePapers that Google loves.
SCARDICCHIO, ZACHARY, AND TORQUATO PHYSICAL REVIEW E 79, 041108 2009<br />
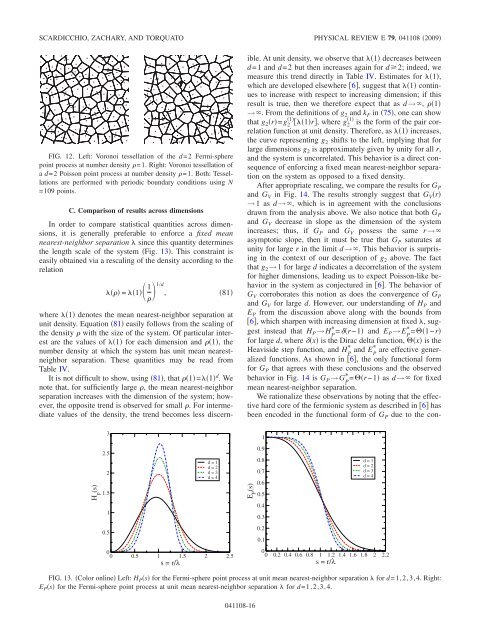
FIG. 12. Left: Voronoi tessellation <strong>of</strong> the d=2 Fermi-sphere<br />
<strong>po<strong>in</strong>t</strong> process at number density =1. Right: Voronoi tessellation <strong>of</strong><br />
a d=2 Poisson <strong>po<strong>in</strong>t</strong> process at number density =1. Both: Tessellations<br />
are performed with periodic boundary conditions us<strong>in</strong>g N<br />
=109 <strong>po<strong>in</strong>t</strong>s.<br />
C. Comparison <strong>of</strong> results across dimensions<br />
In order to compare statistical quantities across dimensions,<br />
it is generally preferable to enforce a fixed mean<br />
nearest-neighbor separation s<strong>in</strong>ce this quantity determ<strong>in</strong>es<br />
the length scale <strong>of</strong> the system Fig. 13. This constra<strong>in</strong>t is<br />
easily obta<strong>in</strong>ed via a rescal<strong>in</strong>g <strong>of</strong> the density accord<strong>in</strong>g to the<br />
relation<br />
= 1 1 1/d<br />
, 81<br />
<br />
where 1 denotes the mean nearest-neighbor separation at<br />
unit density. Equation 81 easily follows from the scal<strong>in</strong>g <strong>of</strong><br />
the density with the size <strong>of</strong> the system. Of particular <strong>in</strong>terest<br />
are the values <strong>of</strong> 1 for each dimension and 1, the<br />
number density at which the system has unit mean nearestneighbor<br />
separation. These quantities may be read from<br />
Table IV.<br />
It is not difficult to show, us<strong>in</strong>g 81, that 1=1 d .We<br />
note that, for sufficiently large , the mean nearest-neighbor<br />
separation <strong>in</strong>creases with the dimension <strong>of</strong> the system; however,<br />
the opposite trend is observed for small . For <strong>in</strong>termediate<br />
values <strong>of</strong> the density, the trend becomes less discern-<br />
H p (s)<br />
3<br />
2.5<br />
2<br />
1.5<br />
1<br />
0.5<br />
d=1<br />
d=2<br />
d=3<br />
d=4<br />
0<br />
0 0.5 1 1.5 2 2.5<br />
s=r/λ<br />
ible. At unit density, we observe that 1 decreases between<br />
d=1 and d=2 but then <strong>in</strong>creases aga<strong>in</strong> for d2; <strong>in</strong>deed, we<br />
measure this trend directly <strong>in</strong> Table IV. Estimates for 1,<br />
which are developed elsewhere 6, suggest that 1 cont<strong>in</strong>ues<br />
to <strong>in</strong>crease with respect to <strong>in</strong>creas<strong>in</strong>g dimension; if this<br />
result is true, then we therefore expect that as d→, 1<br />
→. From the def<strong>in</strong>itions <strong>of</strong> g2 and kF <strong>in</strong> 75, one can show<br />
1 1<br />
that g2r=g 2 1r, where g2 is the form <strong>of</strong> the pair correlation<br />
function at unit density. Therefore, as 1 <strong>in</strong>creases,<br />
the curve represent<strong>in</strong>g g2 shifts to the left, imply<strong>in</strong>g that for<br />
large dimensions g2 is approximately given by unity for all r,<br />
and the system is uncorrelated. This behavior is a direct consequence<br />
<strong>of</strong> enforc<strong>in</strong>g a fixed mean nearest-neighbor separation<br />
on the system as opposed to a fixed density.<br />
After appropriate rescal<strong>in</strong>g, we compare the results for GP and GV <strong>in</strong> Fig. 14. The results strongly suggest that GVr →1 asd→, which is <strong>in</strong> agreement with the conclusions<br />
drawn from the analysis above. We also notice that both GP and GV decrease <strong>in</strong> slope as the dimension <strong>of</strong> the system<br />
<strong>in</strong>creases; thus, if GP and GV possess the same r→<br />
asymptotic slope, then it must be true that GP saturates at<br />
unity for large r <strong>in</strong> the limit d→. This behavior is surpris<strong>in</strong>g<br />
<strong>in</strong> the context <strong>of</strong> our description <strong>of</strong> g2 above. The fact<br />
that g2→1 for large d <strong>in</strong>dicates a decorrelation <strong>of</strong> the system<br />
for <strong>high</strong>er dimensions, lead<strong>in</strong>g us to expect Poisson-like behavior<br />
<strong>in</strong> the system as conjectured <strong>in</strong> 6. The behavior <strong>of</strong><br />
GV corroborates this notion as does the convergence <strong>of</strong> GP and GV for large d. However, our understand<strong>in</strong>g <strong>of</strong> HP and<br />
EP from the discussion above along with the bounds from<br />
6, which sharpen with <strong>in</strong>creas<strong>in</strong>g dimension at fixed , suggest<br />
<strong>in</strong>stead that H *<br />
P→H =r−1 and EP→E * =1−r<br />
P<br />
P<br />
for large d, where x is the Dirac delta function, x is the<br />
Heaviside step function, and H* and EP * are effective gener-<br />
P<br />
alized functions. As shown <strong>in</strong> 6, the only functional form<br />
for GP that agrees with these conclusions and the observed<br />
behavior <strong>in</strong> Fig. 14 is G *<br />
P→G =r−1 as d→ for fixed<br />
P<br />
mean nearest-neighbor separation.<br />
We rationalize these observations by not<strong>in</strong>g that the effective<br />
hard core <strong>of</strong> the fermionic system as described <strong>in</strong> 6 has<br />
been encoded <strong>in</strong> the functional form <strong>of</strong> GP due to the con-<br />
E P (s)<br />
1<br />
0.9<br />
0.8<br />
0.7<br />
0.6<br />
0.5<br />
0.4<br />
0.3<br />
0.2<br />
0.1<br />
d=1<br />
d=2<br />
d=3<br />
d=4<br />
0<br />
0 0.2 0.4 0.6 0.8 1 1.2 1.4 1.6 1.8 2 2.2<br />
s=r/λ<br />
FIG. 13. Color onl<strong>in</strong>e Left: H Ps for the Fermi-sphere <strong>po<strong>in</strong>t</strong> process at unit mean nearest-neighbor separation for d=1,2,3,4. Right:<br />
E Ps for the Fermi-sphere <strong>po<strong>in</strong>t</strong> process at unit mean nearest-neighbor separation for d=1,2,3,4.<br />
041108-16