

WinTEC3 Software user's Guide - Electromotive Engine Controls
WinTEC3 Software user's Guide - Electromotive Engine Controls
WinTEC3 Software user's Guide - Electromotive Engine Controls

Create successful ePaper yourself
Turn your PDF publications into a flip-book with our unique Google optimized e-Paper software.
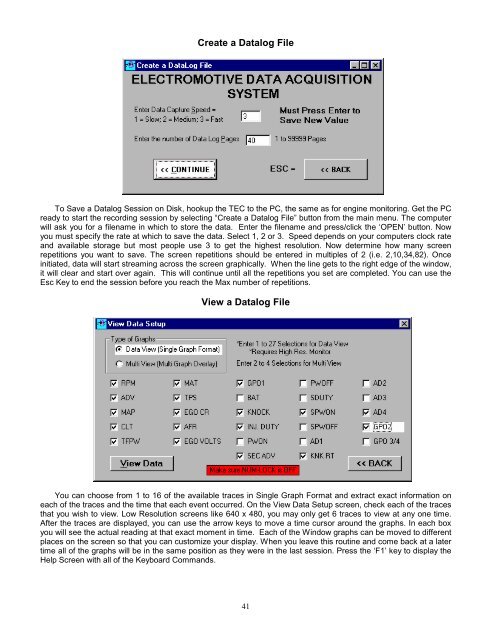
Create a Datalog File<br />
To Save a Datalog Session on Disk, hookup the TEC to the PC, the same as for engine monitoring. Get the PC<br />
ready to start the recording session by selecting “Create a Datalog File” button from the main menu. The computer<br />
will ask you for a filename in which to store the data. Enter the filename and press/click the ‘OPEN’ button. Now<br />
you must specify the rate at which to save the data. Select 1, 2 or 3. Speed depends on your computers clock rate<br />
and available storage but most people use 3 to get the highest resolution. Now determine how many screen<br />
repetitions you want to save. The screen repetitions should be entered in multiples of 2 (i.e. 2,10,34,82). Once<br />
initiated, data will start streaming across the screen graphically. When the line gets to the right edge of the window,<br />
it will clear and start over again. This will continue until all the repetitions you set are completed. You can use the<br />
Esc Key to end the session before you reach the Max number of repetitions.<br />
View a Datalog File<br />
You can choose from 1 to 16 of the available traces in Single Graph Format and extract exact information on<br />
each of the traces and the time that each event occurred. On the View Data Setup screen, check each of the traces<br />
that you wish to view. Low Resolution screens like 640 x 480, you may only get 6 traces to view at any one time.<br />
After the traces are displayed, you can use the arrow keys to move a time cursor around the graphs. In each box<br />
you will see the actual reading at that exact moment in time. Each of the Window graphs can be moved to different<br />
places on the screen so that you can customize your display. When you leave this routine and come back at a later<br />
time all of the graphs will be in the same position as they were in the last session. Press the ‘F1’ key to display the<br />
Help Screen with all of the Keyboard Commands.<br />
41