MPAe T1ex127-.45ex51275atigkeitsbericht 2002/2003 - Max-Planck ...
MPAe T1ex127-.45ex51275atigkeitsbericht 2002/2003 - Max-Planck ...
MPAe T1ex127-.45ex51275atigkeitsbericht 2002/2003 - Max-Planck ...

Create successful ePaper yourself
Turn your PDF publications into a flip-book with our unique Google optimized e-Paper software.
II.1. SONNE UND HELIOSPHÄRE/SUN AND HELIOSPHERE 29<br />
velocity of the Ne 7+ ions, which can then be used as<br />
markers of the proton flow. Therefore one has,<br />
ftot = fbp + fdr = Ne,bpvbpAdp + Ne,drvdrAdr ,<br />
(1)<br />
where f , v and A are the mass flux, measured<br />
(Doppler) outflow velocity and flux tube area, which<br />
could be inferred from the simultaneously measured<br />
magnetic flux. Ne,bp and Ne,dr denote the electron<br />
density in bright points and dark regions. Their ratio<br />
can be estimated from the line intensity ratio, by simply<br />
assuming the emission volume for a given line has<br />
the same bottom area. Empirically one finds that<br />
Ne,bp<br />
Ne,dr<br />
≈<br />
<br />
Ibp<br />
Idr<br />
≈ 1.8 . (2)<br />
The mass flux contributed by bright points to the total<br />
outflow within the measured hole area, fbp/ftot,<br />
is thus estimated to be about 12%. This estimate is<br />
consistent with previous values in the literature, and<br />
suggests that the portion of the mass flux contributed<br />
by bright points to the fast solar wind is at most comparable<br />
to the relative area they cover and therefore<br />
negligable. Funnels make the major contributions to<br />
the mass flux of the nascent solar wind.<br />
(L.D. Xia, E. Marsch, W. Curdt)<br />
Network structures and Doppler shifts in solar<br />
equatorial coronal holes<br />
By combining observations of the Sun made by<br />
SUMER and the Michelson Doppler Imager (MDI)<br />
aboard SOHO, the network structures in equatorial<br />
coronal holes have been studied, in particular the relationship<br />
between the ultraviolet emission-line parameters<br />
(line radiance, Doppler shift and line width) and<br />
the magnetic field. The bases of coronal holes as seen<br />
in chromospheric spectral lines with relatively low formation<br />
temperatures generally have similar properties<br />
as normal quiet-Sun regions, i.e., small bright patches<br />
with a size of about 2 arcsec to 10 arcsec are the dominant<br />
features in the network as well as cell interiors.<br />
With increasing formation temperature, these features<br />
become more diffuse and larger. Loop-like structures<br />
are the most prominent features in the transition region.<br />
In coronal holes, they seem to have one footpoint<br />
rooted in the intra-network and to extend into the cell<br />
interiors. Some of them appear as star-shape clusters.<br />
In Dopplergrams of typical transition region lines,<br />
such as O VI (103.2 nm), there are also many fine<br />
structures with apparent blue shifts, although, on average<br />
they appear red shifted. Structures with blue<br />
shifts usually have also broader line widths. They<br />
seem to represent plasma above large concentrations<br />
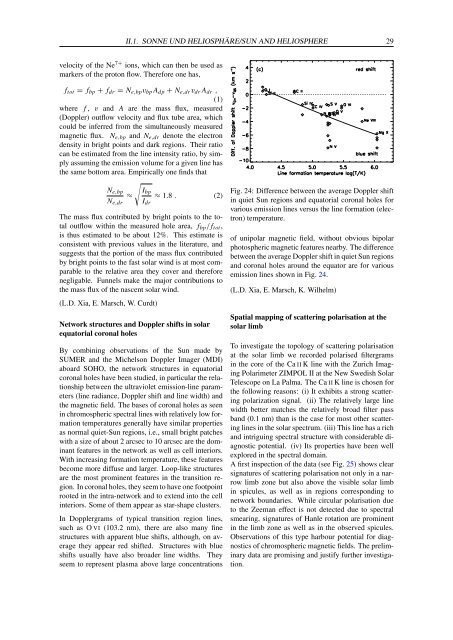
Fig. 24: Difference between the average Doppler shift<br />
in quiet Sun regions and equatorial coronal holes for<br />
various emission lines versus the line formation (electron)<br />
temperature.<br />
of unipolar magnetic field, without obvious bipolar<br />
photospheric magnetic features nearby. The difference<br />
between the average Doppler shift in quiet Sun regions<br />
and coronal holes around the equator are for various<br />
emission lines shown in Fig. 24.<br />
(L.D. Xia, E. Marsch, K. Wilhelm)<br />
Spatial mapping of scattering polarisation at the<br />
solar limb<br />
To investigate the topology of scattering polarisation<br />
at the solar limb we recorded polarised filtergrams<br />
in the core of the Ca II K line with the Zurich Imaging<br />
Polarimeter ZIMPOL II at the New Swedish Solar<br />
Telescope on La Palma. The Ca II K line is chosen for<br />
the following reasons: (i) It exhibits a strong scattering<br />
polarization signal. (ii) The relatively large line<br />
width better matches the relatively broad filter pass<br />
band (0.1 nm) than is the case for most other scattering<br />
lines in the solar spectrum. (iii) This line has a rich<br />
and intriguing spectral structure with considerable diagnostic<br />
potential. (iv) Its properties have been well<br />
explored in the spectral domain.<br />
A first inspection of the data (see Fig. 25) shows clear<br />
signatures of scattering polarisation not only in a narrow<br />
limb zone but also above the visible solar limb<br />
in spicules, as well as in regions corresponding to<br />
network boundaries. While circular polarisation due<br />
to the Zeeman effect is not detected due to spectral<br />
smearing, signatures of Hanle rotation are prominent<br />
in the limb zone as well as in the observed spicules.<br />
Observations of this type harbour potential for diagnostics<br />
of chromospheric magnetic fields. The preliminary<br />
data are promising and justify further investigation.