Making a Rogaine Map - NSW Rogaining Association
Making a Rogaine Map - NSW Rogaining Association
Making a Rogaine Map - NSW Rogaining Association

You also want an ePaper? Increase the reach of your titles
YUMPU automatically turns print PDFs into web optimized ePapers that Google loves.
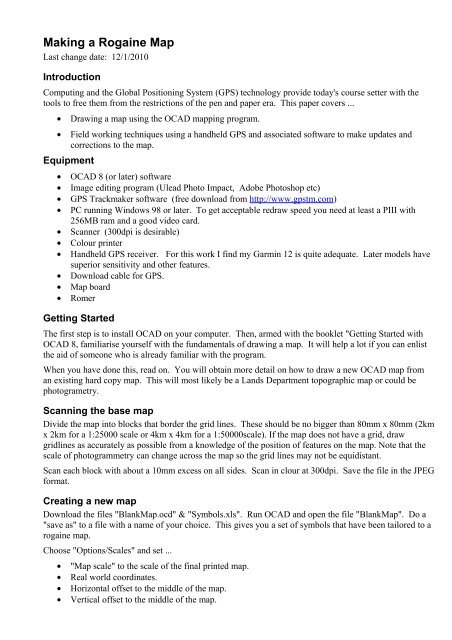
<strong>Making</strong> a <strong>Rogaine</strong> <strong>Map</strong><br />
Last change date: 12/1/2010<br />
Introduction<br />
Computing and the Global Positioning System (GPS) technology provide today's course setter with the<br />
tools to free them from the restrictions of the pen and paper era. This paper covers ...<br />
• Drawing a map using the OCAD mapping program.<br />
• Field working techniques using a handheld GPS and associated software to make updates and<br />
corrections to the map.<br />
Equipment<br />
• OCAD 8 (or later) software<br />
• Image editing program (Ulead Photo Impact, Adobe Photoshop etc)<br />
• GPS Trackmaker software (free download from http://www.gpstm.com)<br />
• PC running Windows 98 or later. To get acceptable redraw speed you need at least a PIII with<br />
256MB ram and a good video card.<br />
• Scanner (300dpi is desirable)<br />
• Colour printer<br />
• Handheld GPS receiver. For this work I find my Garmin 12 is quite adequate. Later models have<br />
superior sensitivity and other features.<br />
• Download cable for GPS.<br />
• <strong>Map</strong> board<br />
• Romer<br />
Getting Started<br />
The first step is to install OCAD on your computer. Then, armed with the booklet "Getting Started with<br />
OCAD 8, familiarise yourself with the fundamentals of drawing a map. It will help a lot if you can enlist<br />
the aid of someone who is already familiar with the program.<br />
When you have done this, read on. You will obtain more detail on how to draw a new OCAD map from<br />
an existing hard copy map. This will most likely be a Lands Department topographic map or could be<br />
photogrametry.<br />
Scanning the base map<br />
Divide the map into blocks that border the grid lines. These should be no bigger than 80mm x 80mm (2km<br />
x 2km for a 1:25000 scale or 4km x 4km for a 1:50000scale). If the map does not have a grid, draw<br />
gridlines as accurately as possible from a knowledge of the position of features on the map. Note that the<br />
scale of photogrammetry can change across the map so the grid lines may not be equidistant.<br />
Scan each block with about a 10mm excess on all sides. Scan in clour at 300dpi. Save the file in the JPEG<br />
format.<br />
Creating a new map<br />
Download the files "Blank<strong>Map</strong>.ocd" & "Symbols.xls". Run OCAD and open the file "Blank<strong>Map</strong>". Do a<br />
"save as" to a file with a name of your choice. This gives you a set of symbols that have been tailored to a<br />
rogaine map.<br />
Choose "Options/Scales" and set ...<br />
• "<strong>Map</strong> scale" to the scale of the final printed map.<br />
• Real world coordinates.<br />
• Horizontal offset to the middle of the map.<br />
• Vertical offset to the middle of the map.
• Angle to the grid/magnetic angle.<br />
• Grid distance to the grid line spacing.<br />
Make the two offsets a whole number of thousands of metres otherwise you will get very unfriendly<br />
numbers on your grid scales around the border of the map.<br />
Drawing the map<br />
Choose "Template/Open" and select one of your scanned blocks. If the scale of your base map is a<br />
different to the final scale, set the "Draft scale" to match the final scale. Set the Rotation to the Grid -<br />
magnetic angle. Click OK. The template will appear in the middle of the drawing window. Zoom out so<br />
you can see both the template and the area where it should be. Choose "Template/Adjust (F9)" and using<br />
just one point move the template to approximately the correct position. Now zoom so that the template<br />
and the position it should be are just in the drawing window.<br />
You can now adjust the template accurately using four points set to the outer grid corners of the template.<br />
Zoom in on each corner then zoom out to get best accuracy. OCAD supports nested commands.<br />
You will often find you can't achieve an exact fit. This is because grid squares on the base map are not<br />
square unless you happen to be in the middle of a zone. The OCAD grid is a perfect square. This is one of<br />
the reasons for scanning the map in small sections.. When you come to draw an adjoining section you just<br />
have to tweak the contours and other lines that cross your section borders so they join up.<br />
If you are working from photogrammetry or other source that did not have a grid, you should first draw<br />
onto the map any known features. If there are roads or tracks that show up on the photogrammetry, spend<br />
a few days in the field recording their position using your GPS and draw them onto the map using the<br />
methods described further on. Now check the position of your template against these features. If any are<br />
significantly in error, try readjusting. You may find you have to break the template into smaller areas.<br />
You can now start to draw the map. Some points to consider ...<br />
• Use bezier curves for all curved lines. Once you get the hang of it it is the fastest method and most<br />
definitely produces the best result.<br />
• Don't merge long lines such as contours where they cross your block boundaries. If you happen to<br />
accidentally delete or move one later on it will be more obvious and easier to fix.<br />
OCAD remembers the adjustment of each template so it is easy to reopen the template to check something.<br />
When you "Open" and "Adjust" a template, the position of the template is saved as part of the map.ocd<br />
file. If you "Close" the template you can then "Reopen" it and it will be in its adjusted position.<br />
Doing an "Open" will lose any previous adjustment. OCAD uses absolute addressing to store the location<br />
of the template file so if you pass your work to someone else you need to pass the directory structure.<br />
To draw magnetic north lines on the map, choose "Options/Scales" and change to "Paper coordinates" and<br />
set the "Grid distance" to a value that equals the spacing you want for the north lines. This would typically<br />
be 40mm (1km) on a 1:25000 map. You can now use the grid lines as a guide to accurately place the north<br />
south lines. The spacing should be uniform and set to a value like 1km as these lines provide the user with<br />
a "scale" across the map. Remember that there is no need to have the GIS grid on your final map.<br />
If the position of the lines doesn't fall exactly where you would like them, reduce the value of the "Grid<br />
distance" and use intermediate lines.
Fieldwork<br />
The topographic maps which are used as the base for most rogaine maps will always have errors and<br />
omissions. They can be more than 30 years old. The "cultural" features (roads, buildings, dams etc) are<br />
the most obvious ones you will find to be incorrect. Before you start any serious placement of controls, it<br />
is a good idea to at least get the roads and buildings shown correctly. The tools available to do this are the<br />
traditional mapping board and the GPS.<br />
The <strong>Map</strong>ping Board. <strong>Map</strong>ping boards in various forms have been used by orienteering mapers for many<br />
years. Where they use them to draw a complete map in colour, we only need to record corrections to an<br />
existing map. The board I use is a sheet of 16 gauge aluminium, 32cm x 28cm. A simple compass is<br />
screwed to one corner. Print the section of the map where you want to work on an A4 sheet and sticky<br />
tape this to the board. Now cover the map with a sheet of "mylar" (polyester) drafting film. Mylar has two<br />
important properties. It is dimensionally stable and you can draw on it with a hard pencil. Use at least a<br />
4H. Anchor the pencil to the board with a cord. You will lose it in the first hour otherwise. Drill a hole in<br />
a hard rubber eraser and tie this with another cord to your shirt pocket. The other thing you need is a<br />
romer with scales in metres.<br />
Draw crosses on the mylar at the intersection of the grid lines. Rotate the compass housing so that north<br />
on the housing is parallel to the magnetic north lines on the map.<br />
Fix a plain sheet of paper to the other side of the board. Use this to record your notes about things like<br />
GPS waypoints and track logs.<br />
The GPS The most simple use for the GPS is to find out where you are. Read the coordinates and then<br />
use your romer and pencil to put a dot on the mylar on your mapping board. Do this a few times in some<br />
moderately complex terrain and you will soon find out just how inaccurate not only the cultural features<br />
can be but also the contours and watercourses on topographic maps. The good news is that it is easy to do<br />
something about it.<br />
GPS Basics. The first time you use your GPS you need to check some basic settings. Select "Main<br />
Menu / Setup Menu / Navigation" See that ...<br />
1. "Position Format" is "UTM/UPS"<br />
2. "<strong>Map</strong> Datum" matches your map. For the 1st and 2nd edition <strong>NSW</strong> maps this is Australian<br />
Geodetic 1966. Later editions use the “Geocentric Datum of Australia 1994”. For more<br />
information on this subject go to “http://www.lands.nsw.gov.au/survey_maps/geodesy/gda” .<br />
3. "Units" are Metric.<br />
The accuracy of a GPS like the Garmin 12 is about 10m horizontally. Later models will give you 3m. The<br />
“GPS” elevation reading will tell you if you are at Penrith or Blackheath or half way in between but that's<br />
about all. Models with barometer altimeters give 5m accuracy. The 10m horizontal accuracy fits in well<br />
with the common rogaining map scale of 1:25000 where 1mm on the map is 25m. The accuracy of your<br />
GPS will be reduced by tree cover and hills that block the view of the satellites. If you know you are going<br />
to be working in a deep valley with tree cover it is worth picking a time to go there when there is a<br />
favourable satellite pattern. These patterns can be obtained from the web. Try<br />
http://www.geocities.com/kiwi_36_nz/alm2pos/alm2pos.htm.<br />
Plotting Point Features by GPS. Point features are easily plotted. Just stand beside them and record a<br />
Way Point on the GPS. You can also read off the coordinates and draw the feature on your map board<br />
using your romer and pencil.<br />
Plotting Linear Features by GPS. Any linear feature such as a road, track or watercourse that you are<br />
able to walk or drive along can be placed on your map. The steps in the process are ...<br />
1. "Walk" the GPS along the feature with "Track Logging" activated.<br />
2. Download the data to your computer.<br />
3. Process the data to create an OCAD image.<br />
4. Draw the feature.
Plotting Area Features by GPS. Area features such as vegetation are handled the same as linear features<br />
by "walking" the boundary of the object.<br />
GPS Track Log settings. For a Garmin 12, select "<strong>Map</strong> Page / Options / Track Setup". The items here<br />
are ...<br />
1. "Record:" This turns the Track Logging on or off. You should only turn it on when you are ready<br />
to start a walk. There are two good reasons for this, first you don't waste memory space and second<br />
you don't end up with irrelevant clutter in your data. There are two "on" options, "Fill" & "Wrap".<br />
In the "Fill" mode, once the memory fills no more points will be added. In "Wrap", once you have<br />
reached the maximum number of track points the older points will be lost as new points are added.<br />
2. Method: The options here are "Auto" and "Time Interval". Always use "Time Interval". The<br />
value you choose will depend on your anticipated rate of progress along the feature and the to some<br />
extent the twistiness of the feature. A setting of 30 seconds will give you a point every 33m if you<br />
are walking at 4km/h. It also means you can walk for 8 hours before you run out of memory. If<br />
you are driving you will need to reduce the time interval to 10s or less. You will cover the ground<br />
a lot faster but you will also fill your memory faster. Either plan to do the driving in short bursts or<br />
take a laptop computer with you so you can download the data.<br />
3. Mem Used: Keep your eye on this!<br />
4. Clear Log: Remember to do this after each download of data.<br />
Doing a Walk. When you are ready to go, switch on the recording and return to the <strong>Map</strong> Page. Press<br />
"Mark / Enter" to record a "Waypoint". Note the waypoint number. Write this on the note sheet of your<br />
map board, eg "WP1 - start of Jack's Trail". Start walking. Watch the <strong>Map</strong> Screen and see that your path<br />
is being recorded. Whenever you come to a significant feature such as a road/watercourse crossing, record<br />
a Way Point and add the details to your paper log. If you stop for more than a few minutes, turn the<br />
recording off.<br />
Processing GPS Data<br />
After returning from the field you now need to transfer the data in your GPS to your OCAD map. OCAD 9<br />
has the ability to do this directly for Garmin's eTrex models. If you don't have one of these you will have<br />
to use the Trackmaker program to read the data from your GPS and save it as an image file which you then<br />
open as a “template” in OCAD. This procedure is described next.<br />
Prepare your GPS to download data. For a Garmin 12, select "Main Menu / Setup Menu / System /<br />
Mode" and change to "Simulator". Select "Main Menu / Setup Menu / Interface" and select<br />
"Garmin/Garmin". Use your special data cable to connect the GPS to an apropriate port on your computer.<br />
Run the program "GPS Trackmaker". Select "Interface / Garmin Interface" or one to match your GPS. On<br />
the "Garmin Interface" dialog that pops up press ..<br />
1. "Product ID". See that this brings up an identification of your GPS.<br />
2. "Request from GPS"<br />
3. "Waypoint" See that the waypoints are transferred.<br />
4. "Tracklogs" See that the tracklogs are transferred.<br />
5. "Exit". The pop up will close and a map is drawn of your tracks and waypoints.<br />
There are a number of adjustments you can make to the view of your data such as showing tracks by<br />
colour, waypoint text, grid and scale. Pan and vary the scale to get the part you want on to the screen.<br />
Keep in mind that when you get to look at the file are creating in OCAD, you are going to have to read<br />
then grid values and the waypoint numbers so don't try to take too big a bite.
The best scale to use will depend on the complexity and density of your data. The aproximate relationship<br />
between Trackmaker scale and OCAD draft scale is shown in the following table.<br />
Trackmaker Scale Resolution change OCAD Draft Scale<br />
1:20 96 > 960 (see note) 16000<br />
1:30 96 > 960 28000<br />
1:50 no 4000<br />
1:75 no 7000<br />
1:100 no 9000<br />
1:150 no 14000<br />
1:300 no 28000<br />
Note: Because of the Draft Scale limitations of OCAD, if you use a scale below 1:50 you must use your<br />
image editor to change the resolution of the file from 96 dpi to 960 dpi.<br />
Do an "Edit / Copy". Run you image editor program and do an "Edit / Paste". See that what you get is<br />
what was on the screen of GPS Trackmaker. Make tone adjustments to sharpen up the image then save the<br />
image as a ".bmp" or JPEG file.<br />
Run OCAD and open your map then ...<br />
1. Zoom in on the area covered by your fieldwork file.<br />
2. Open the file as a template.<br />
3. Set the Draft Scale to the value shown in the table above.<br />
4. Set the Angle to your magnetic deviation. Less blurring seems to occur if you rotate here rather<br />
than in the image editor.<br />
5. Adjust the template using 4 points on the grid crossings. If you have trouble reading the scale bar<br />
on the template, try hiding the symbols that are obscuring the scale while you do the adjustment.<br />
If you have trouble getting the template to line up it is possibly caused by the fact mentioned earlier that<br />
grid squares on the base map aren't square. To get around this try making some adjustments to the<br />
template file with your image editor. First "Expand" the file by 50 pixels all around and then do a<br />
"Transform / Slant". Pull one side up or down by about 1 in 100. If you are smart enough you may be<br />
able to work out which way otherwise a bit of trial and error will soon sort it out.<br />
Using Google Earth Images<br />
If you are lucky enough to be working in an area where Google Earth provides high resolution images<br />
these provide a valuable resource. To line up a saved Google image with your map ...<br />
● Run Trackmaker and open one of your existing “gtm” files. This will get you into the right area on<br />
the planet.<br />
● Delete all the data on the screen.<br />
● Using the pencil tool draw crosses at the four corners of the square kilometre you want view.<br />
● Save as a Google Earth “.klm” file.<br />
● Run Google earth and open the “klm” file.<br />
● After Google zooms in on your selected area, adjust the zoom level so the crosses are just on the<br />
screen.<br />
● Turn off all the layers.<br />
● Select “Options” / “Navigation” and see that “Automatically tilt while zooming” is turned off.<br />
● Don't even think of touching the tilting buttons. If you do, close Google earth and start again.<br />
● Save the image<br />
● Open it as a template in OCAD and adjust it to the grid.
Using SIX<br />
The <strong>NSW</strong> Lands Department provides a very valuable resource of maps and images available for free. Go<br />
to https://six.maps.nsw.gov.au/wps/portal/ and in the “Have you Seen?” block select “SIX Viewer -<br />
Access to advanced tools and rich data. You will need to install ERmapper plug-in for your browser.<br />
This is a once off operation.<br />
The first warning is this application is going to be slow to use unless you have better than base line<br />
broadband. When you are using it watch both the browser status bar and the SIX Progress bar. After<br />
making a change, don't press on until they both complete.<br />
In the “Take me to:” panel, click on “Suburb” and enter a name. This can be a locality, just about any<br />
name on the map seems to work. In “Results”, click on the most likely looking answer and wait. When it<br />
completes ...<br />
In the “Show Themes:” panel ...<br />
• Move the slider left to Image<br />
• Turn off all the options.<br />
In the “Display Images:” panel ...<br />
• Select East Coast Aerial Photos (Medium-high resolution)<br />
• Select Topographic <strong>Map</strong>s - whichever series is available in your area.<br />
• Untick anything else that is on.<br />
• Move the Transparency slider left<br />
If the Progress bar gets stuck on zero, try using the “Previous Extent” tool to unstick things.<br />
Click on the “Open toolbox to add extra tools” tool. Select “Copy the current view to the clipboard” tool<br />
and click OK. See that the Copy tool is added to the main toolbar.<br />
Select the “Zoom to an area” tool and zoom in to the area you are using. Work your way in till you reach a<br />
scale of between 5000 & 6000. At this scale, by clicking the “Maximise <strong>Map</strong> Height” pointer at the<br />
bottom of the map to close the Properties panel you should be able to just get a 1km square block of the<br />
map comfortably on the screen. When you are ready, click the “Copy to clipboard” tool. This open a<br />
small dialog. Click OK and then Close. You must close it before the next copy operation!<br />
Use your image editor to paste then save the clipboard content as “xxyymap.jpg”.<br />
Now move the Transparency slider to the right to display the aerial photography. Don't move the image!<br />
Copy to clipboard and this time save as “xxyyAP.jpg”.<br />
Move the slider back to the left, move the map to line up the next square km and repeat the operations<br />
above.<br />
Do a “Template / Open” of “xxyymap.jpg” and adjust in the same way as used for the base templates.<br />
The template and your map should agree! Now ...<br />
• Close the template<br />
• Rename “xxyymap.jpg”<br />
• Template / Reopen “xxyymap.jpg. OCAD will say it can't find the template. Click on “Browse”<br />
and point to “xxyyAP.jpg”.<br />
You should now have the aerial photo image lined up with the map.
Plotting Complex Features by GPS.<br />
Finding good control sites is partly skill, partly hard work and partly luck. My experience is that some of<br />
the best sites you will stumble across are unusable unless you make corrections to the map. More to come<br />
on this subject ...<br />
Graeme Cooper