Assessing Uncertainty in Future Pressure Changes Predicted By ...
Assessing Uncertainty in Future Pressure Changes Predicted By ...
Assessing Uncertainty in Future Pressure Changes Predicted By ...

You also want an ePaper? Increase the reach of your titles
YUMPU automatically turns print PDFs into web optimized ePapers that Google loves.
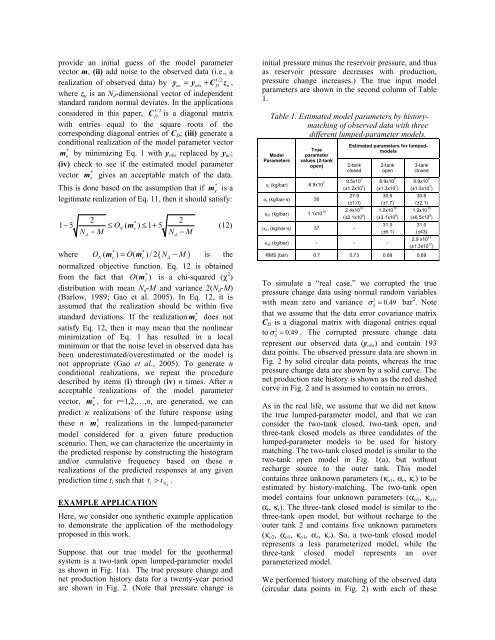
provide an <strong>in</strong>itial guess of the model parameter<br />
vector m, (ii) add noise to the observed data (i.e., a<br />
1/2<br />
realization of observed data) by yuc= yobs + CDz u ,<br />
where zu is an Nd-dimensional vector of <strong>in</strong>dependent<br />
standard random normal deviates. In the applications<br />
considered <strong>in</strong> this paper, 1/2<br />
CD is a diagonal matrix<br />
with entries equal to the square roots of the<br />
correspond<strong>in</strong>g diagonal entries of CD; (iii) generate a<br />
conditional realization of the model parameter vector<br />
*<br />
m r by m<strong>in</strong>imiz<strong>in</strong>g Eq. 1 with yobs replaced by yuc;<br />
(iv) check to see if the estimated model parameter<br />
*<br />
vector m r gives an acceptable match of the data.<br />
*<br />
This is done based on the assumption that if m r is a<br />
legitimate realization of Eq. 11, then it should satisfy:<br />
2 *<br />
2<br />
1−5 ≤ON( m r)<br />
≤ 1+ 5<br />
(12)<br />
N −M N −M<br />
d d<br />
N mr m r d is the<br />
normalized objective function. Eq. 12 is obta<strong>in</strong>ed<br />
from the fact that O ( r )<br />
*<br />
m is a chi-squared (χ 2 )<br />
distribution with mean Nd-M and variance 2(Nd-M)<br />
(Barlow, 1989; Gao et al. 2005). In Eq. 12, it is<br />
assumed that the realization should be with<strong>in</strong> five<br />
standard deviations. If the realization *<br />
m r does not<br />
satisfy Eq. 12, then it may mean that the nonl<strong>in</strong>ear<br />
m<strong>in</strong>imization of Eq. 1 has resulted <strong>in</strong> a local<br />
m<strong>in</strong>imum or that the noise level <strong>in</strong> observed data has<br />
been underestimated/overestimated or the model is<br />
not appropriate (Gao et al., 2005). To generate n<br />
conditional realizations, we repeat the procedure<br />
described by items (i) through (iv) n times. After n<br />
acceptable realizations of the model parameter<br />
*<br />
vector, m r , for r=1,2,…,n, are generated, we can<br />
predict n realizations of the future response us<strong>in</strong>g<br />
*<br />
these n m r realizations <strong>in</strong> the lumped-parameter<br />
model considered for a given future production<br />
scenario. Then, we can characterize the uncerta<strong>in</strong>ty <strong>in</strong><br />
the predicted response by construct<strong>in</strong>g the histogram<br />
and/or cumulative frequency based on these n<br />
realizations of the predicted responses at any given<br />
prediction time ti such that t > t .<br />
* *<br />
where O ( ) = O( )/2(<br />
N −M)<br />
EXAMPLE APPLICATION<br />
i Nd<br />
Here, we consider one synthetic example application<br />
to demonstrate the application of the methodology<br />
proposed <strong>in</strong> this work.<br />
Suppose that our true model for the geothermal<br />
system is a two-tank open lumped-parameter model<br />
as shown <strong>in</strong> Fig. 1(a). The true pressure change and<br />
net production history data for a twenty-year period<br />
are shown <strong>in</strong> Fig. 2. (Note that pressure change is<br />
<strong>in</strong>itial pressure m<strong>in</strong>us the reservoir pressure, and thus<br />
as reservoir pressure decreases with production,<br />
pressure change <strong>in</strong>creases.) The true <strong>in</strong>put model<br />
parameters are shown <strong>in</strong> the second column of Table<br />
1.<br />
Table 1. Estimated model parameters by historymatch<strong>in</strong>g<br />
of observed data with three<br />
different lumped-parameter models.<br />
Model<br />
Parameters<br />
True<br />
parameter<br />
values (2-tank<br />
open)<br />
κr (kg/bar) 8.9x10 7<br />
αr (kg/bar-s) 30<br />
κo1 (kg/bar) 1.1x10 10<br />
Estimated parameters for lumpedmodels<br />
2-tank<br />
closed<br />
9.5x10 7<br />
(±1.2x10 7 )<br />
27.9<br />
(±1.0)<br />
2.4x10 10<br />
(±2.1x10 9 )<br />
αo1 (kg/bar-s) 37 -<br />
2-tank<br />
open<br />
8.9x10 7<br />
(±1.3x10 7 )<br />
30.6<br />
(±1.7)<br />
1.2x10 10<br />
(±3.1x10 9 )<br />
31.0<br />
(±6.1)<br />
κo2 (kg/bar) - - -<br />
3-tank<br />
closed<br />
8.9x10 7<br />
(±1.3x10 7 )<br />
30.6<br />
(±2.1)<br />
1.2x10 10<br />
(±6.5x10 9 )<br />
31.0<br />
(±43)<br />
2.9 x10 13<br />
(±1.3x10 17 )<br />
RMS (bar) 0.7 0.73 0.69 0.69<br />
To simulate a “real case,” we corrupted the true<br />
pressure change data us<strong>in</strong>g normal random variables<br />
with mean zero and variance 2<br />
d 0.49 = σ bar2 . Note<br />
that we assume that the data error covariance matrix<br />
CD is a diagonal matrix with diagonal entries equal<br />
to 2<br />
d 0.49 = σ . The corrupted pressure change data<br />
represent our observed data (yobs) and conta<strong>in</strong> 193<br />
data po<strong>in</strong>ts. The observed pressure data are shown <strong>in</strong><br />
Fig. 2 by solid circular data po<strong>in</strong>ts, whereas the true<br />
pressure change data are shown by a solid curve. The<br />
net production rate history is shown as the red dashed<br />
curve <strong>in</strong> Fig. 2 and is assumed to conta<strong>in</strong> no errors.<br />
As <strong>in</strong> the real life, we assume that we did not know<br />
the true lumped-parameter model, and that we can<br />
consider the two-tank closed, two-tank open, and<br />
three-tank closed models as three candidates of the<br />
lumped-parameter models to be used for history<br />
match<strong>in</strong>g. The two-tank closed model is similar to the<br />
two-tank open model <strong>in</strong> Fig. 1(a), but without<br />
recharge source to the outer tank. This model<br />
conta<strong>in</strong>s three unknown parameters (κo1, αr, κr) to be<br />
estimated by history-match<strong>in</strong>g. The two-tank open<br />
model conta<strong>in</strong>s four unknown parameters (αo1, κo1,<br />
αr, κr). The three-tank closed model is similar to the<br />
three-tank open model, but without recharge to the<br />
outer tank 2 and conta<strong>in</strong>s five unknown parameters<br />
(κo2, αo1, κo1, αr, κr). So, a two-tank closed model<br />
represents a less parameterized model, while the<br />
three-tank closed model represents an over<br />
parameterized model.<br />
We performed history match<strong>in</strong>g of the observed data<br />
(circular data po<strong>in</strong>ts <strong>in</strong> Fig. 2) with each of these