Demonstrating Mercury Emissions Reduction Cost ... - Nalco
Demonstrating Mercury Emissions Reduction Cost ... - Nalco
Demonstrating Mercury Emissions Reduction Cost ... - Nalco

You also want an ePaper? Increase the reach of your titles
YUMPU automatically turns print PDFs into web optimized ePapers that Google loves.
<strong>Demonstrating</strong> <strong>Mercury</strong> <strong>Emissions</strong><br />
<strong>Reduction</strong> <strong>Cost</strong> Management<br />
By John Meier, Dr. Bruce Keiser*, Dr. Brian Higgins<br />
<strong>Nalco</strong> Company, 1601 West Diehl Road, Naperville, IL 60563-1198<br />
ABSTRACT<br />
Meeting mercury emission regulations, whether state<br />
or federal, is the primary goal of our work, while<br />
simultaneously minimizing the impact on generated<br />
electricity costs for a coal-fired power plant. 1–8<br />
Determining the right solution for a combination of<br />
boiler design, coal-type, and air quality control devices<br />
(AQCD) can result in large reductions in mercury<br />
compliance cost. An example of this is the cost savings<br />
recently generated by the application of a holistic<br />
<strong>Nalco</strong> engineered solution to mercury emission compliance<br />
on a commercial boiler.<br />
The commercial site consisted of a coal-fired 580 MWg<br />
thermal electric supercritical boiler equipped with<br />
low-NO x burners and selective catalytic reduction<br />
(SCR) for NO x control, dry scrubbers (SDAs) for SO 2<br />
control, and a pulse-jet fabric filter (FF) for particulate<br />
control. The boiler burns subbituminous Powder<br />
River Basin (PRB) coal. The site currently owns and<br />
operates a Thermo Fischer continuous mercury monitor<br />
(Thermo CMM) at the stack. The Thermo CMM is<br />
used to control HPAC (halogenated powder activated<br />
carbon) injection to maintain mercury emissions below<br />
1.0 lb/TBtu, the targeted mercury emission rate. The<br />
target represents approximately 90% mercury capture.<br />
Historically, an HPAC injection rate averaging<br />
1.65 lb/MMacf was required to meet this target.<br />
Parametric testing and optimization of the engineered<br />
mercury emission control solution were carried out<br />
during the demonstration for HPAC alone and in<br />
combination with <strong>Nalco</strong> MerControl 7895 technology.<br />
The results showed that the mercury emission target<br />
of less than 1.0 lb/TBtu could be maintained at lower<br />
HPAC usage rates when combined with MerControl<br />
7895. The HPAC usage rate was reduced 85% from<br />
1.65 lb/MMacf to 0.25 lb/MMacf when MerControl<br />
7895 was applied to the coal at a concentration of 25<br />
ppmw. The optimized engineering solution reduced<br />
the customer’s annual mercury compliance costs for<br />
the 580 MWg electric generating unit (EGU) by over<br />
$1.1 million per year.<br />
Presented at Air Quality VIII, Arlington, VA, October 24-27, 2011<br />
Reprint R-1031<br />
We also will show recent work minimizing the cost of<br />
mercury control through increasing the efficiency of<br />
mercury capture by wet flue gas desulfurizer through<br />
the application of MerControl 8034. <strong>Mercury</strong> emission<br />
was reduced on a commercial unit from 10 µg/<br />
dscm to less than 1 µg/dscm with no impact on EGU<br />
operation. This work represents a simple low-capital<br />
cost mercury strategy that enables EGUs to meet<br />
regulations with existing AQCDs.<br />
INTRODUCTION<br />
An Ecolab Company<br />
Hazardous air pollutants (HAPs) generated from the<br />
use of fossil fuels to generate electricity continues to<br />
be a topic of debate and subject for state and federal<br />
regulatory bodies. 1–4 One HAP that continues to be<br />
a focus of regulatory bodies is mercury emissions. It<br />
is anticipated that the Clean Air Act will eventually<br />
lead to federal mercury regulations on utility and<br />
industrial boilers. While federal regulations remain<br />
unclear, many states have established regulations<br />
that apply to coal-fired power plants. 3–4 As the power<br />
generating plants in these states and others move<br />
to meet these regulations, it has become clear that<br />
there are several control strategies. 5–8 The strategies<br />
employed vary greatly based on existing unit<br />
operations, coal type, and air quality control devices<br />
(AQCDs) present at any given power generation plant.<br />
The cost of air mercury emission compliance equally<br />
varies greatly from one site to another. 7–8 <strong>Nalco</strong> has<br />
been working in the field optimizing site specific<br />
engineered solutions for customers. Holistic solutions<br />
addressing both water and air mercury emissions<br />
have been demonstrated for bituminous and subbituminous<br />
coal-fired power plants with and without<br />
selective catalytic reduction (SCRs) and wet flue gas<br />
desulfurization (wFGD). 9–10 In all these cases, the goal<br />
is always to meet air mercury emission regulations<br />
while having the least impact on power generation<br />
and electricity costs.<br />
Recently, a demonstration was carried out applying<br />
<strong>Nalco</strong> patented mercury control technology resulted<br />
in a significant savings in meeting regulatory require-
ments. The demonstration site was a 580 MWg boiler<br />
burning subbituminous Powder River Basin (PRB)<br />
coal. The existing AQCDs included low NO x burners<br />
and SCR to control NO x , a spray dryer absorber<br />
(SDA) to control SO x , and a fabric filter to control<br />
particulate emissions. The site utilized stack CMM<br />
(i.e., continuous mercury measurement) to control<br />
mercury emissions via injection of halogenated powder<br />
activated carbon (HPAC) to a target of less than 1.0<br />
lb/TBtu.<br />
<strong>Nalco</strong> offers a method of controlling mercury in coal<br />
combustion flue gas that increases the oxidized mercury<br />
fraction in the gas and facilitates its capture.<br />
<strong>Nalco</strong> is the exclusive licensee of MerControl 7895<br />
technology. The oxidized form of mercury is more<br />
readily collected in conventional air quality control<br />
devices (AQCDs) such as electrostatic precipitators<br />
(ESPs) and fabric filters (FFs). Oxidized mercury is<br />
also more readily absorbed across acid gas scrubbers<br />
like wet flue gas desulfurization (WFGD) and SDA<br />
systems.<br />
This paper provides a summary of the results of<br />
this recent demonstration. Independent mercury<br />
measurement was provided by Western Kentucky<br />
University along with supplemental mercury speciation<br />
measurements to aid performance analysis, additional<br />
quality control, and determination of mercury<br />
oxidation across existing air quality control devices<br />
(AQCDs). WKU performed Ontario Hydro Method<br />
2<br />
(ASTM D6784-02/2008) and Method 30B (carbon trap<br />
sampling), both considered reference methods for<br />
measuring mercury. The study included injection of<br />
halogenated powdered activated carbon (HPAC) only,<br />
MerControl 7895 only, and both components together.<br />
The performance of the mercury control solutions was<br />
evaluated based on the ability to meet the mercury<br />
air emission target and regulatory compliance cost.<br />
Unit Description<br />
EXPERIMENTAL<br />
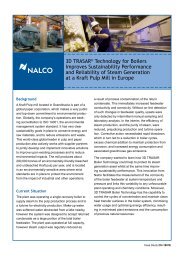
The test site has a 580 MWg, supercritical boiler<br />
burning PRB coal, equipped with lox-NO x burners<br />
and selective catalytic reduction (SCR) for NO x control,<br />
spray dryer absorber (SDA) for SO 2 control, and<br />
a pulse-jet fabric filter (FF) for particulate control<br />
(Figure 1). A Thermo CMM (i.e., continuous mercury<br />
monitor) is used to monitor mercury emissions and<br />
to control HPAC injection rate. The HPAC is introduced<br />
into the combustion gas after the air heater and<br />
before the SDA. The HPAC injection rate is actively<br />
controlled to maintain the target gas phase stack<br />
mercury level of below 1.0 lb/TBtu as measured by the<br />
Thermo CMM. Historical data shows that typically an<br />
HPAC injection rate of 1.65 lb/MMacf was required to<br />
maintain the target stack gas mercury concentration.<br />
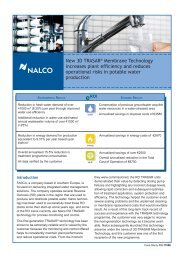
Figure 1 – Schematic of plant configuration and Hg measurements is provided. Note: M indicates mercury<br />
measurement points within the unit while HPAC indicates injection points for halogenated powder activated carbon.
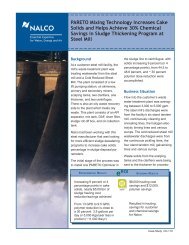
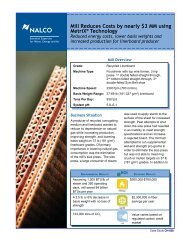
MerControl 7895 Temporary Supply System<br />
The MerControl 7895 temporary supply system<br />
(Figure 2) consists of three individual pumps, used<br />
to supply chemical into three of the four coal feeders,<br />
prior to the pulverizers. MerControl 7895 was stored<br />
in a 260-gallon tote next to the temporary supply<br />
system. MerControl 7895 supply levels were verified<br />
by performing drawdown checks through individual<br />
calibration columns on each pump. The temporary<br />
supply system is equipped with flow metering and<br />
data recording to insure that flow is not disrupted<br />
during supply. The supply of MerControl 7895 was<br />
maintained at a constant rate and did not change with<br />
load or coal flow. Note that the load did not fluctuate<br />
significantly during daily test periods. A permanent<br />
MerControl 7895 installation includes a 4-20 mA<br />
input signal to allow the flow rate to be varied with<br />
load or coal flow. The flow rate of MerControl 7895 is<br />
reported as part-per-million weight fraction (ppmw)<br />
relative to the coal flow rate (e.g., mg 7895/kg of coal).<br />
Validation of Gas Phase <strong>Mercury</strong><br />
Measurements<br />
<strong>Mercury</strong> measurements were performed by Western<br />
Kentucky University (WKU) after the air heaters and<br />
at the stack. WKU performed Ontario Hydro Method<br />
(ASTM D6784-02/2008) and Method 30B (carbon trap<br />
sampling). A PSA Analytical CMM was also installed<br />
by WKU at the outlet of one of two boiler air heaters<br />
to monitor changing coal conditions. Ontario Hydro<br />
measurements performed at the air heater outlet<br />
was considered representative of the inlet mercury<br />
concentration and used for calculation of mercury<br />
removal performance. Ontario Hydro Method (OHM)<br />
and Method 30B measurements made at the stack<br />
by WKU were used to validate the Thermo CMM.<br />
Table 1 – Comparison of Gas Phase <strong>Mercury</strong> Measurements.<br />
3<br />
Figure 2 – A typical temporary MerControl 7895<br />
technology injection skid is shown.<br />
Table 1 tabulates the OHM, Method 30B (abbreviated<br />
as M30B in the table), and Thermo CMM gas phase<br />
mercury concentrations at the stack.<br />
RESULTS AND DISCUSSIONS<br />
Validation of Stack Gas Phase Hg<br />
Measurements<br />
M30B = Method 30 B of 40 CFR Part 75.<br />
a Relative Deviation or RD calculated following Appendix K of 40 CFR Part 75 section 11.7. 11<br />
The Thermo CMM stack data for total mercury in<br />
the gas phase was validated against that obtained<br />
by WKU, see Table 1. The mercury concentrations are<br />
shown in Table 1 in both gas concentrations (μg/dscm)<br />
and relative to coal processed (lb/TBtu). The gas<br />
concentrations were used in calculating the Relative<br />
Deviation (RD) as percent between the correspond-
ing methods as shown in Table 1. 12 As can be seen,<br />
the various methods compare well with RDs ranging<br />
from 4 to 15%. One can also observe that for the first<br />
two days, the RD between the Method 30B reference<br />
method and CMM were high; i.e., ranging from 19 to<br />
36%. The site CMM was calibrated during the second<br />
day of testing resulting in the observed similar<br />
results during the rest of the test. Indeed, using the<br />
guidelines of Appendix K of 40 CFR Part 75, results<br />
from the first day would be removed based on the high<br />
RD values. A calculation of the Relative Accuracy<br />
(RA) following Performance Specification 12A12 and<br />
using data from only Day 3 through Day 5 of the test<br />
yields a value of 18%. Analysis of the information in<br />
Table 1 is shown in Figure 3 as well.<br />
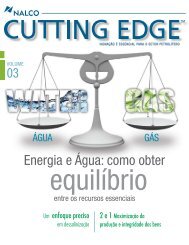
The comparison of either the site CMM or WKU OHM<br />
results to the WKU Method 30B is shown in Figure<br />
3. The red dotted line represents a theoretical exact<br />
match between methods. Linear fits forced through<br />
the origin were generated for both comparison methods;<br />
i.e., site CMM and WKU OHM versus WKU<br />
Method 30B. Please note that the highlighted data<br />
points shown in Figure 3 were omitted from the linear<br />
fit for the site CMM based on the discussion above. In<br />
both cases, the R-squared values exceed 0.9 indicated<br />
a good correlation between the respective methods.<br />
Further, the slope of the fit for site CMM is 0.95 or<br />
less than 5% from the theoretical value of 1.0. A plant<br />
study comparing methods carried out by Sarunac, et<br />
al., observed similar findings between Method 30B<br />
and CMM indicated good agreement. 13 The data<br />
shown in Table 1 and Figure 3 clearly indicate that<br />
the site CMM after calibration provided reliable and<br />
accurate gas phase mercury concentrations at the<br />
stack and will be used through the remaining of this<br />
paper.<br />
Figure 3 –The comparison of mercury measurements is<br />
made at the stack sampling point. Highlighted data<br />
points were not used in construction of linear fit.<br />
4<br />
Parametric Tests<br />
The plant load is shown in Figure 4 below during<br />
the time of the demonstration. While load was<br />
reduced overnight, the load was always near 580 MWg<br />
during daylight testing. The MerControl 7895 was<br />
supplied on a continual basis during the demonstration.<br />
Plant data regarding load and coal usage were<br />
used to calculate an “average” application concentration<br />
of MerControl 7895.<br />
Figure 4 – The plant load during the demonstration is<br />
shown.<br />
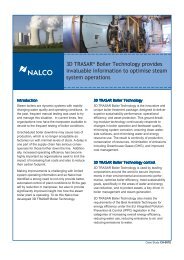
Table 2 contains a summary of the conditions, feed<br />
rates, and stack total mercury levels measured during<br />
the demonstration. The total mercury emission<br />
rate reported in Table 2 is taken from the plant stack<br />
CMM since, as shown above, these results were<br />
essentially equivalent to independent OHM and<br />
Method 30B. At the beginning of the trial HPAC<br />
was being injected at a rate of 2.45 lb/MMacf to meet<br />
the goal of less than 1.0 lb/TBtu mercury emission<br />
rate. In fact this injection rate of HPAC resulted in<br />
a mercury emission of 0.59 lb/TBtu. MerControl 7895<br />
addition began on the second day at 46 ppmw based<br />
on coal. Shortly after, the HPAC injection rate was<br />
reduced from 2.45 to 0.22 lb/MMacf. As can be seen<br />
in Table 2 and Figure 5, the stack mercury emission<br />
rate remained less than 1.0 lb/TBtu. Indeed, at this<br />
new condition of a 10-fold reduction of HPAC, a lower<br />
mercury emission rate was observed. The combination<br />
of MerControl 7895 and reduced HPAC injection<br />
rate decreased mercury emissions by more than 50%<br />
relative to only 0.3 lb/TBtu.<br />
This demonstration condition was maintained to confirm<br />
that the mercury emission levels were stable and<br />
below 1.0 lb/TBtu. After about two hours, the HPAC<br />
injection was turned off and remained off for the next
Table 2 – Summary of Supply Conditions and Performance.<br />
*MerControl supply rate ppm is on weight basis, calculated from coal flow.<br />
three days of the demonstration. MerControl 7895<br />
(referred herein as BA or boiler additive) rates were<br />
increased to maintain mercury emissions below the<br />
targeted emission rate set point of 1.0 lb/TBtu.<br />
Over the next 67+ hours of the demonstration, mercury<br />
emission rates were maintained below 1.0 lb/TBtu<br />
without addition of HPAC. During this period of the<br />
demonstration, MerControl 7895 addition rate was<br />
varied. In the initial 48 hours, it was observed that<br />
lower rates of BA addition were required to maintain<br />
mercury emission rates. It was hypothesized that the<br />
cessation of activated carbon injection was leading to<br />
the disappearance of residual HPAC from the boiler<br />
surfaces, the fabric filter and the SDA system. During<br />
previous HPAC parametric testing by the client,<br />
they found that the activated carbon memory effect<br />
on mercury removal lasted approximately 2.5 days. It<br />
was observed that after 2.5 days the “memory effect”<br />
of HPAC injection was reduced. Before the 2.5 days<br />
elapsed, MerControl 7895 injection resulted in lower<br />
mercury emissions due to residual carbon. After 2.5<br />
days elapsed, it appeared that this effect had dissipated<br />
and that the demonstration ran long enough<br />
to minimize or eliminate the effect.<br />
On the fourth day of the demonstration, 58 ppmw of<br />
MerControl 7895 controlled mercury emission rates<br />
to between 0.77 and 0.89 lb/TBtu. The average was<br />
0.83 lb/TBtu with a standard deviation of 0.083 lb/<br />
TBtu or 10% relative standard deviation. Further, as<br />
can be seen in Table 2 and Figure 5, increasing the<br />
BA application rate further decreased the mercury<br />
emission rate to less than 0.71 lb/TBtu on Day 5 of<br />
the demonstration.<br />
Therefore, during the demonstration, it was shown<br />
that HPAC injection could be reduced from 2.45 lb/<br />
MMacf to less than 0.22 lb/MMacf while maintaining<br />
the mercury emission rate below the 1.0 lb/TBtu limit<br />
through the application of MerControl 7895.<br />
5<br />
Figure 5 – The stack total mercury emissions are<br />
shown for conditions during the demonstration. Note:<br />
ΔT represents the elapse time in hours after HPAC was<br />
stopped. See Table 2 above for label codes. The optimal<br />
condition was found to be 0.22 lb/MMacf HPAC and<br />
25 ppmw MerControl 7895 technology.<br />
Optimized Solution<br />
After the <strong>Nalco</strong> demonstration period was complete,<br />
the site performed further optimization using<br />
the stack Thermo CMM. Various combinations of<br />
MerControl 7895 and HPAC injection were investigated<br />
to further reduce the cost of mercury compliance. They<br />
concluded that by adding a small amount of HPAC, the<br />
MerControl 7895 dosage could be decreased by 67%.<br />
The most cost effective solution was between 25 to<br />
50 ppmw of MerControl 7895 and 0.25 lb/MMacf of<br />
HPAC. They also noted that MerControl 7895 application<br />
provided a simple and easy means to respond<br />
to variations in mercury emission rates.
Economic Analysis<br />
Variations in mercury content of the fuel and anticipated<br />
changes in mercury emission regulations, the<br />
solution demonstrated above provides the necessary<br />
flexibility to provide a long term operational solution.<br />
To further highlight this, two economic analyses are<br />
provided for the reader’s consideration. The first case<br />
considered is an analysis of the cost required to reach<br />
83% mercury emission reduction or a target of less<br />
than 1.0 lb/TBtu. The second case to consider is the<br />
cost associated with reaching 90% mercury reduction<br />
or an emission rate of less than 0.71 lb/TBtu.<br />
To determine the yearly solution costs for meeting<br />
mercury emission regulations, the cost of consumables<br />
for the “mercury emissions solution” on an hourly basis<br />
was determined. Plant operations were assumed<br />
to consist of 8760 hours per year with a capacity factor<br />
of 90%. The cost for HPAC was taken as $0.98/lb.<br />
Case 1: <strong>Mercury</strong> emission control below<br />
1.0 lb/TBtu (or 83% <strong>Mercury</strong> <strong>Reduction</strong>):<br />
As can be seen in Table 3, the control strategy provided<br />
reduces the cost of consumables to meet this plant’s<br />
mercury emissions regulation by over $1.1 million<br />
per year.<br />
Case 2: <strong>Mercury</strong> emission control below<br />
0.7 lb/TBtu (or 90% <strong>Mercury</strong> <strong>Reduction</strong>):<br />
Here also, the demonstrated mercury emission control<br />
strategy maintains stack emissions below 0.7 lb/TBtu<br />
at a savings of over $1.7 million per year.<br />
The additional capital equipment required to<br />
apply MerControl 7895 technology is recovered in savings<br />
in less than 2 months. For this particular unit,<br />
the injection system EPC cost was less than $200,000;<br />
however, actual system costs can vary greatly due to<br />
scope and system requirements.<br />
Table 3 – Comparative cost to meet 83% total mercury reduction is<br />
presented.<br />
Condition<br />
HPAC<br />
(lb/MMacf)<br />
MerControl 7895<br />
(ppmw)<br />
$/yr<br />
HPAC only 1.65 $1,450,000<br />
HPAC+MerControl 7895 0.25 28 $ 360,000<br />
Savings $1,090,000<br />
Table 4 – Comparative cost to meet 90% total mercury reduction is<br />
presented.<br />
Condition<br />
HPAC<br />
(lb/MMacf)<br />
MerControl 7895<br />
(ppmw)<br />
$/yr<br />
HPAC only 2.50 $2,200,000<br />
HPAC+MerControl 7895 0.25 53 $ 500,000<br />
Savings $1,700,000<br />
6<br />
The reduced cost of mercury emission compliance<br />
can translate into reductions in the cost of electricity<br />
for the consumer as can be seen in Figure 6. Figure<br />
6 shows the cost of meeting mercury emission<br />
regulations on a $/MWhr basis over about a year of<br />
operation. The initial 140 days of operation shows<br />
the cost of meeting mercury emission regulations<br />
utilizing a control strategy of HPAC alone. During<br />
HPAC application alone, the average cost of mercury<br />
emission compliance is about $0.30/MWhr. During<br />
the MerControl 7895 technology demonstration,<br />
mercury emission compliance cost was reduced to<br />
about $0.11/MWhr. After about 170 days, a mercury<br />
emission compliance strategy based on the results of<br />
this demonstration was implemented consisting of<br />
combining HPAC and MerControl 7895 technology.<br />
With optimization of this control strategy, mercury<br />
compliance costs from about 221 days on have been<br />
further reduced to about $0.07/MWhr and continues<br />
to provide the flexibility to responds to fuel and<br />
operational variations.<br />
Figure 6 –The cost of control mercury emission is<br />
presented for solutions as practiced. The (*) indicates<br />
periods during which the temporary equipment was<br />
used to control the program resulting in higher costs.
The reduced cost of mercury emission compliance<br />
can translate into reductions in the cost of electricity<br />
for the consumer as can be seen in Figure 6. Figure 6<br />
shows the cost of meeting mercury emission regulations<br />
on a $/MWhr basis over about a year of operation.<br />
The initial 140 days of operation shows the cost<br />
of meeting mercury emission regulations utilizing<br />
a control strategy of HPAC alone. During HPAC<br />
application alone, the average cost of mercury emission<br />
compliance is about $0.30/MWhr. During the<br />
MerControl 7895 demonstration, mercury emission<br />
compliance cost was reduced to about $0.11/MWhr.<br />
After about 170 days, a mercury emission compliance<br />
strategy based on the results of this demonstration<br />
was implemented consisting of combining HPAC<br />
and MerControl 7895. With optimization of this control<br />
strategy, mercury compliance costs from about<br />
221 days on have been further reduced to about $0.07/<br />
MWhr and continues to provide the flexibility to responds<br />
to fuel and operational variations.<br />
CONCLUSIONS<br />
A demonstration of <strong>Nalco</strong> MerControl 7895 technology<br />
was performed on a 580 MWg boiler to reduce mercury<br />
emission compliance costs relative to a HPAC injection<br />
alone strategy. <strong>Mercury</strong> was controlled to as low<br />
as 0.7 lb/TBtu, below the target control limit of 1.0 lb/<br />
TBtu, utilizing only MerControl 7895. Lower levels<br />
of mercury emissions were recorded when combining<br />
low rates of MerControl 7895 and lower rates HPAC.<br />
It was found that about 2.5 days are required to completely<br />
remove “memory effects” of HPAC injection<br />
from the unit based on the response of stack mercury<br />
emission to the feed rate of MerControl 7895. Specifically,<br />
it was found that MerControl 7895 results<br />
in further utilization of residual carbon to produce<br />
mercury capture. It is clear from the results that<br />
7<br />
the demonstration ran long enough to minimize or<br />
eliminate the effect.<br />
At a MerControl 7895 rate of 70 ppmw, the site<br />
was able to maintain mercury emissions below the<br />
targeted rate of 1.0 lb/TBtu. Further optimization<br />
resulted in an economical mercury control strategy<br />
that provided operational flexibility while meeting<br />
mercury emission regulations with 25 ppmw of<br />
MerControl 7895 and 0.25 lb/MMacf of HPAC<br />
injection. Historically the previous control strategy<br />
required about 1.65 lb/MMacf of HPAC injection to<br />
maintain the mercury emissions below 1.0 lb/TBtu.<br />
Due to the addition of <strong>Nalco</strong> MerControl 7895 technology,<br />
the client reduced mercury emission compliance costs by<br />
$1.1 million per year. In the future, this mercury control<br />
strategy provides a means to meet 90% mercury<br />
reduction at a mercury compliance cost reduction of<br />
$1.7 million per year compared to HPAC alone.<br />
MERCURY REEMISSION CONTROL FROM<br />
WFGD (RECENT DEVELOPMENTS)<br />
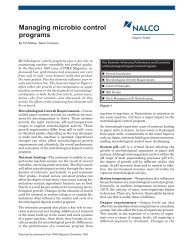
Recently, <strong>Nalco</strong> MerControl 8034 technology for control<br />
of mercury re-emission in wet flue gas desulfurizers<br />
was performed on a combined 140 MWe EGU<br />
(Figure 7) fueled by high chlorine bituminous coal,<br />
i.e., 1200 ppm as chlorine. The EGU consisted of a<br />
SCR, selective catalytic reduction for NO x control,<br />
cold-side ESP to control particulate emissions, and<br />
limestone forced-oxidation wet flue gas desulfurizer<br />
to control SO x emissions. At the time of the request,<br />
total mercury capture was less than 50%. The reason<br />
for low mercury with a wFGD was not well understood.<br />
The goal of the demonstration was to improve<br />
the mercury capture efficiency of existing air quality<br />
control devices (AQCDs) while minimizing capital<br />
cost and operational complexity.<br />
Figure 7 –Schematic of commercial EGU (electricity generating unit) where <strong>Nalco</strong> successfully<br />
demonstrated wFGD mercury reemission reduction was shown. <strong>Mercury</strong> gas-phase measurements<br />
were made at the indicated “Monitoring Points” for the demonstration.
The gas-phase mercury measurements were carried<br />
out by an independent company using continuous<br />
mercury monitors (CMMs). The CMMs results were<br />
verified via Method 30B carbon traps. The complete<br />
study will be presented subsequently and is only<br />
briefly summarized here. A segment of the demonstration<br />
results is presented in Figure 8. This segment<br />
includes periods related to baseline measurement,<br />
control strategy application and demonstration that<br />
the control strategy is actively controlling mercury<br />
re-emission from the wFGD (Figure 8).<br />
<strong>Reduction</strong> of mercury from oxidized to elemental<br />
across wFGDs, i.e. mercury re-emission, has previously<br />
been the subject of laboratory and commercial<br />
studies with limited success in the latter case. 14–15 The<br />
results shown in Figure 8 document the successful<br />
application of a simple mercury re-emission control<br />
program. The inlet mercury gas-phase measurements<br />
are shown in blue diamonds with the elemental fraction<br />
shown in blue open diamonds. Not surprisingly,<br />
the high coal chlorine, in combination with the SCR,<br />
results in high mercury oxidized speciation, i.e., about<br />
85%. If the wFGD were 100% efficient at capturing<br />
oxidized mercury, there would be 85% mercury capture<br />
relative to the inlet mercury concentration. As<br />
is seen in Figure 8, under baseline conditions, the<br />
stack total mercury concentration equals that of the<br />
total inlet mercury concentration representing near<br />
0% capture across the wFGD. Note that the stack<br />
mercury emissions are represented by the red squares<br />
with the elemental fraction represented by the open<br />
symbols. Indeed, the elemental fraction of the stack<br />
mercury concentration is greater than 70% of the<br />
total. The percent re-emission, calculated from the<br />
inlet oxidized fraction and the increase across the<br />
wFGD of the elemental fraction was observed to be<br />
greater than 77%. This was consistently observed over<br />
the course of several weeks. Therefore, the focus of<br />
this demonstration, i.e. the reduction of total mercury<br />
emission from the EGU, became the elimination of<br />
mercury re-emission across the wFGD.<br />
<strong>Nalco</strong> has developed the patented application of a<br />
proprietary liquid scrubber additive for the purpose<br />
of controlling mercury reduction across a wFGD.<br />
The product, MerControl 8034, is simple to apply,<br />
requiring minimal application equipment and with no<br />
impact on scrubber or EGU operations. As can be seen<br />
Table 5 – Summary of key performance parameters during demonstration.<br />
8<br />
Figure 8 – <strong>Mercury</strong> results are shown from the<br />
demonstration showing periods of mercury re-emission<br />
from the wFGD and the reduction by MerControl 8034<br />
addition. Feed rate is shown on the left y-axis. Elemental<br />
mercury concentrations are shown by open symbols.<br />
in Figure 8, this EGU responded to the application<br />
of MerControl 8034 within one hour of application.<br />
Within 2 hours of application, the stack total mercury<br />
concentration was the same as the mercury inlet<br />
elemental concentration. Re-emissions was reduced<br />
to zero and controlled throughout the remainder of<br />
the application period. Typically, initial high application<br />
rates are used to quickly eliminate re-emissions,<br />
with lower rates needed for “maintenance” of control.<br />
During application, the stack emissions are nearly<br />
100% elemental mercury. As a result of <strong>Nalco</strong> control<br />
technology the percent mercury capture reached<br />
greater than 85%.<br />
After demonstrating control for several hours, the<br />
application of MerControl 8034 was stopped. As<br />
expected, control continues after cessation of product<br />
application and in this case lasted for about 2<br />
hours. After MerControl 8034 is depleted, mercury<br />
re-emission returns resulting in an observed increase<br />
in stack total mercury concentrations.<br />
Table 5 contains a summary of measured parameters<br />
from the three stages of the demonstration. First, it<br />
is clear that throughout the demonstration the flue<br />
gas mercury speciation did not change. The percent<br />
mercury oxidation ranged from 87 to 95% during<br />
the course of the test. In contrast, the amount of reemission,<br />
capture and the relative efficiency of the<br />
WFGD to capture ionic mercury changed significantly
esulting from the application of MerControl 8034.<br />
Table 5 shows that before application, re-emission<br />
was averaging over 100% with mercury capture at<br />
zero. The application of MerControl 8034 decreased<br />
re-emission to near zero percent while increasing<br />
the scrubber mercury capture efficiency to 100% resulting<br />
in mercury capture increase to nearly 97%.<br />
With the cessation of application of MerControl 8034,<br />
re-emission increased again to baseline as did the<br />
mercury capture, i.e. near zero percent. Similarly, the<br />
scrubber efficiency related to ionic mercury capture<br />
from the flue gas decreased to zero percent.<br />
This demonstration shows the ability of <strong>Nalco</strong> to design<br />
and apply a mercury control strategy that works<br />
while managing costs. Our low-capital-equipment<br />
solution minimizes modifications of existing plant<br />
equipment and operating procedures. This and<br />
other successful demonstrations have proven the<br />
viability of <strong>Nalco</strong> 8034 in solving mercury reemission<br />
across wFGDs.<br />
ACKNOWLEDGMENTS<br />
The authors would like to acknowledge the contributions<br />
made to this paper by Jianwei Yuan and Gerald<br />
Hunt.<br />
REFERENCES<br />
1. Hess, G. “Boiler Battle.” C&E News 2010 88(50), 24.<br />
2. Hess, G. “Activists Oppose Boiler Rule Delay.” C&E<br />
News 2011 89(2), 24.<br />
3. Norfleet, Stephen K. and Barton, Robert E. “A<br />
Patchwork program: An Overview of State <strong>Mercury</strong><br />
Regulations.” Electric Utilities Environmental<br />
Conference, Tucson, Arizona, January 21-24, 2007.<br />
(http://rmb-consulting.com/papers/A%20Patchwork%20Program-An%20Overview%20of%20<br />
State%20<strong>Mercury</strong>%20Regulations.pdf)<br />
4. Clean Air Act, “<strong>Mercury</strong> Control Technologies at<br />
Coal-Fired Power Plants Have Achieved Substantial<br />
<strong>Emissions</strong> <strong>Reduction</strong>s.” GAO-10-47, October,<br />
2009. See Appendix III.<br />
5. United States Government Accountability Office.<br />
“<strong>Mercury</strong> Control Technologies at Coal-Fired<br />
Power Plants Have Achieved Substantial <strong>Emissions</strong><br />
<strong>Reduction</strong>s.” GAO-10-47, www.gao.gov.<br />
6. Strivastava, Ravi. “Control of <strong>Mercury</strong> <strong>Emissions</strong><br />
from Coal Fired Electric Utility Boilers: An<br />
Update.” National Risk Management Research<br />
laboratory, Office of Research and Development,<br />
U.S. Environmental Protection Agency, Cincinnati,<br />
Ohio, 45268, EPA/600/R-10/006, February 2010.<br />
9<br />
7. Staudt, James E. and Jozewicz, Wojciech. “Performance<br />
and <strong>Cost</strong> of <strong>Mercury</strong> and Multipollutant<br />
Emission Control Technology Applications on<br />
Electric Utility Boilers.” EPA-600/R-03/110, October<br />
2003.<br />
8. Stephenson, John B. “Preliminary Observations<br />
on the Effectiveness and <strong>Cost</strong>s of <strong>Mercury</strong> Control<br />
Technologies at Coal-Fired Power Plants.” Testimony<br />
before the Subcommittee on Clean Air and<br />
Nuclear Safety, Committee on Environment and<br />
Public Works, U.S. Senate, July 9, 2009 (GOA-<br />
09-860T).<br />
9. Lu, Jinghui V.; Meier, John; Shah, Jitendra; and<br />
Keiser, Bruce A. “Speciation control of mercury for<br />
coal-fired power plants.” AIChE Spring Meeting<br />
& 6th Global Congress on Process Safety, Conference<br />
Proceedings, San Antonio, TX, March 21-25,<br />
(2010), lu1/1-lu1/4.<br />
10. Keiser, Bruce A.; Meier, John; Shah, Jitendra, and<br />
Lu, Jinghui. <strong>Mercury</strong> <strong>Emissions</strong>: Demonstration<br />
of Air and Water Quality Management. Power<br />
Plant Air Pollutant Control “MEGA” Symposium,<br />
Baltimore, MD, August 30 – September 2, 2010,<br />
Paper #145.<br />
11. Electronic Code of Federal Regulations 40 CFR<br />
Part 75. Continuous <strong>Emissions</strong> Monitoring.<br />
www.ecfr.gopaccess.gov.<br />
12. Performance Specification 12A. www.gaepd.org/<br />
air/airpermit/downloads/ismp/testprocedures/<br />
pdfdocs/appb12.pdf.<br />
13. Sarunac, Nenad; Cipriano, Domenico; Ryan, Jeffrey;<br />
and Schakenbach, John. Field experience<br />
with mercury monitors. POWER 2007 151(8), 52,<br />
54-56, 58-59.<br />
14. Blythe, G. M.; DeBerry, D. W. "Bench-scale Kinetics<br />
Study of <strong>Mercury</strong> Reactions in FGD Liquors",<br />
URS Corporation, 2007, DE-FC26-04NT42314.<br />
15. Currie, J. E.; DeBerry, D. W.; Blythe, G. M.;<br />
Rhudy, R. G.; Miller, C. E.; Pletcher, S. Enhanced<br />
<strong>Mercury</strong> Control by Wet FGD Systems Proceedings<br />
of the Air Quality VI: <strong>Mercury</strong>, Trace Elements,<br />
SO 3 , and Particulate Matter Conference,<br />
2007, Arlington, VA.
<strong>Nalco</strong> Air Protection Technologies<br />
1601 West Diehl Road • Naperville, Illinois 60563-1198<br />
www.nalco.com/mercury<br />
<strong>Nalco</strong> and MerControl are Trademarks of <strong>Nalco</strong> Company<br />
Ecolab is a trademark of Ecolab USA, Inc.<br />
©2012 Ecolab USA Inc. All Rights Reserved 2/12