New 3D TRASAR® Membrane Technology increases plant ... - Nalco
New 3D TRASAR® Membrane Technology increases plant ... - Nalco
New 3D TRASAR® Membrane Technology increases plant ... - Nalco

You also want an ePaper? Increase the reach of your titles
YUMPU automatically turns print PDFs into web optimized ePapers that Google loves.
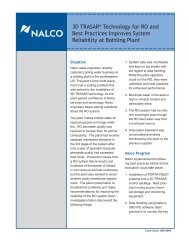
The basic hardware package includes everything<br />
necessary to monitor and control the antiscalant<br />
programme in a multi-train system: 3 fluorometers<br />
to measure the background fluorescence and the<br />
antiscalant in the feed and the concentrate; pH; ORP<br />
and conductivity probes and a platform for analogue<br />
inputs from <strong>plant</strong> sensors. A typical configuration is<br />
shown in Figure 3.<br />
Figure 3 – <strong>3D</strong> TRASAR <strong>Membrane</strong> <strong>Technology</strong>: typical<br />
control unit configuration<br />
The system can be customised for each system or<br />
customer need, and hardware can include more fluorometers<br />
(6), ORP and pH probes, PID (4), analogue<br />
inputs (20) and connectivity to a PLC.<br />
Results<br />
At this customer site, the <strong>3D</strong> TRASAR unit ran in<br />
monitoring mode only for the first few weeks.<br />
During this period, the baseline operational status<br />
was determined by recording the normal system<br />
dynamics, and the data were checked for any<br />
upsets. The main initial advantage of using the new<br />
technology became quickly apparent through the<br />
availability of a much wider array of information on<br />
system performance than previously available.<br />
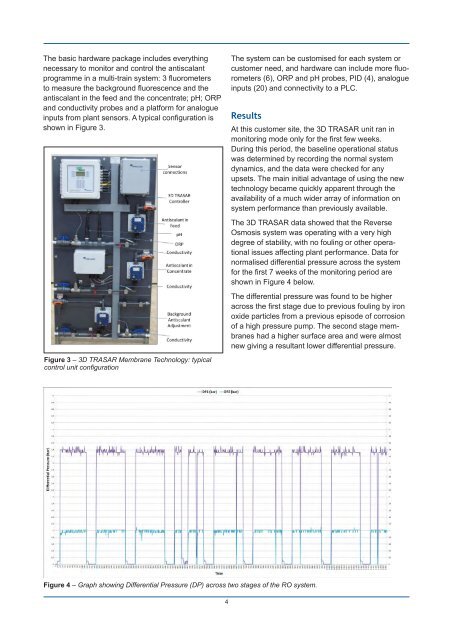
The <strong>3D</strong> TRASAR data showed that the Reverse<br />
Osmosis system was operating with a very high<br />
degree of stability, with no fouling or other operational<br />
issues affecting <strong>plant</strong> performance. Data for<br />
normalised differential pressure across the system<br />
for the first 7 weeks of the monitoring period are<br />
shown in Figure 4 below.<br />
Figure 4 – Graph showing Differential Pressure (DP) across two stages of the RO system.<br />
4<br />
The differential pressure was found to be higher<br />
across the first stage due to previous fouling by iron<br />
oxide particles from a previous episode of corrosion<br />
of a high pressure pump. The second stage membranes<br />
had a higher surface area and were almost<br />
new giving a resultant lower differential pressure.