Mercury Levels in Fijian Seafoods and Potential Health Implications
Mercury Levels in Fijian Seafoods and Potential Health Implications
Mercury Levels in Fijian Seafoods and Potential Health Implications

You also want an ePaper? Increase the reach of your titles
YUMPU automatically turns print PDFs into web optimized ePapers that Google loves.
1<br />
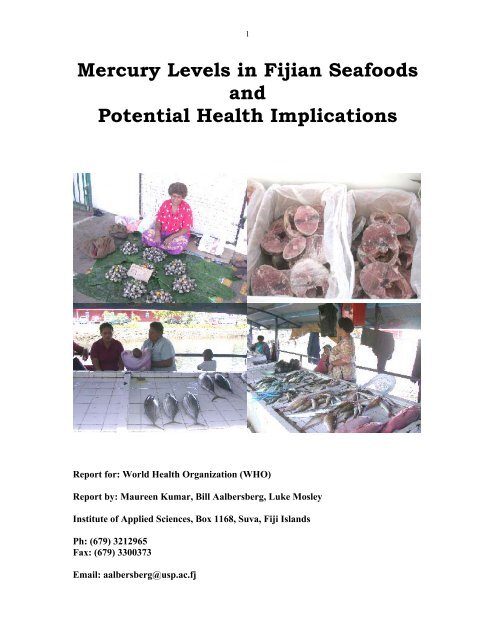
<strong>Mercury</strong> <strong>Levels</strong> <strong>in</strong> <strong>Fijian</strong> <strong>Seafoods</strong><br />
<strong>and</strong><br />
<strong>Potential</strong> <strong>Health</strong> <strong>Implications</strong><br />
Report for: World <strong>Health</strong> Organization (WHO)<br />
Report by: Maureen Kumar, Bill Aalbersberg, Luke Mosley<br />
Institute of Applied Sciences, Box 1168, Suva, Fiji Isl<strong>and</strong>s<br />
Ph: (679) 3212965<br />
Fax: (679) 3300373<br />
Email: aalbersberg@usp.ac.fj
Executive Summary<br />
2<br />
<strong>Mercury</strong> (Hg) <strong>and</strong> its compounds pose a significant threat to human health, particularly to<br />
women who are pregnant or of child-bear<strong>in</strong>g age. <strong>Mercury</strong> is a tox<strong>in</strong> to the central<br />
nervous system <strong>and</strong> it can readily cross the placental barrier. Previous studies <strong>in</strong> other<br />
locations have shown dangerously high mercury levels <strong>in</strong> certa<strong>in</strong> types of seafoods,<br />
particularly large predatory fish. Data on mercury levels <strong>in</strong> fish <strong>and</strong> other seafoods from<br />
the Pacific Isl<strong>and</strong>s are scarce.<br />
The aim of the present study was to measure total Hg content <strong>in</strong> several types of seafoods<br />
which are commonly consumed <strong>in</strong> the Fiji Isl<strong>and</strong>s, <strong>in</strong>clud<strong>in</strong>g various coastal <strong>and</strong> pelagic<br />
fish species, shellfish, <strong>and</strong> canned fish. The results of the study were used to determ<strong>in</strong>e<br />
whether there is a significant health risk aris<strong>in</strong>g from fish consumption.<br />
Total Hg <strong>in</strong> the edible tissues of 200 seafood samples of different types (whole fish, fish<br />
steaks, shellfish) <strong>and</strong> species was analysed. Total Hg was determ<strong>in</strong>ed by strong acid<br />
(HNO3/H2SO4/HCl) digestion, addition of brom<strong>in</strong>e chloride, reduction with sodium<br />
borohydride <strong>and</strong> analysis via hydride generation atomic absorption spectroscopy.<br />
The total Hg levels <strong>in</strong> some of the large predatory fish species (marl<strong>in</strong> <strong>and</strong> swordfish)<br />
exceeded the Food <strong>and</strong> Agriculture Organization (FAO)/World <strong>Health</strong> Organization<br />
(WHO) Codex Alimentarius guidel<strong>in</strong>e level of 1 mg/kg. Other types of fish steaks,<br />
smaller reef fish, shellfish, canned tuna <strong>and</strong> mackerel had average levels below the<br />
guidel<strong>in</strong>es. There was a significant positive correlation between total mercury levels with<br />
the length of yellowf<strong>in</strong> tuna while no correlation was noted for the albacore tuna. No<br />
significant correlation was noted between the total mercury levels with the fish weight for<br />
both the albacore <strong>and</strong> yellowf<strong>in</strong> tuna. For the fish steaks, the swordfish, marl<strong>in</strong> <strong>and</strong> walu<br />
showed a positive correlation <strong>in</strong> mercury levels with the size of steaks. Previous studies<br />
have shown that most (>90%) of the mercury <strong>in</strong> fish is <strong>in</strong> the form of methylmercury.
3<br />
Although a limited amount of analyses were conducted on some fish species, it is clear<br />
that health risks, particularly to pregnant women, exist from consum<strong>in</strong>g relatively small<br />
quantities (
Background<br />
4<br />
There is widespread recognition that mercury (Hg) <strong>and</strong> its compounds pose a significant<br />
threat to human health. The characteristic properties of these compounds <strong>in</strong>clude<br />
extremely high toxicity, resistance to environmental degradation which leads to<br />
persistence <strong>in</strong> the environment, accumulation with<strong>in</strong> organisms <strong>and</strong> magnification up the<br />
food cha<strong>in</strong>, <strong>and</strong> susceptibility to long distance transport. <strong>Mercury</strong> is very toxic to humans,<br />
<strong>and</strong> the recommended safe levels <strong>in</strong> dr<strong>in</strong>k<strong>in</strong>g water are lower than for any other metal<br />
(WHO, 1996).<br />
<strong>Mercury</strong> is found naturally <strong>in</strong> the environment <strong>in</strong> the metallic form <strong>and</strong> <strong>in</strong> different<br />
<strong>in</strong>organic <strong>and</strong> organic forms. Most of the mercury <strong>in</strong> the atmosphere is elemental mercury<br />
vapour <strong>and</strong> <strong>in</strong>organic mercury, while most of the mercury <strong>in</strong> water, soil, plants <strong>and</strong><br />
animals is <strong>in</strong>organic <strong>and</strong> organic forms of mercury (Public <strong>Health</strong> Guidance Note, 2002).<br />
In the ocean, <strong>in</strong>organic mercury is transformed by micro-organisms (<strong>in</strong> sediments <strong>and</strong> <strong>in</strong><br />
the deep ocean) to the methylmercury form, which is accumulated by aquatic organisms<br />
over their lifetime (termed bioaccumulation) <strong>and</strong> then passed up the aquatic food cha<strong>in</strong>.<br />
The progressive buildup of mercury <strong>and</strong> other substances up the food cha<strong>in</strong> is commonly<br />
termed biomagnification. Hence, predatory fish <strong>and</strong> mammals that are high up the food<br />
cha<strong>in</strong> (high trophic level) typically have the greatest levels of mercury. Such species<br />
<strong>in</strong>clude whales, dolph<strong>in</strong>s, swordfish, marl<strong>in</strong>, <strong>and</strong> sharks <strong>and</strong> these may bio-accumulate<br />
mercury to approximately 1 to 10 million times greater than dissolved mercury<br />
concentrations found <strong>in</strong> surround<strong>in</strong>g waters (USEPA, 2001). Most of the mercury <strong>in</strong> fish<br />
tissues exists <strong>in</strong> methylmercury (MeHg) form (Bloom 1992, >95% MeHg; Kim 1995,<br />
>96% MeHg; USEPA 2001, 90-100% MeHg). However, certa<strong>in</strong> non-fish species<br />
(mussels, copepods, shrimps) have been found to have less than 10% of the total mercury<br />
as methylmercury (Bloom 1992; Horvat et al. 1990). With<strong>in</strong> an <strong>in</strong>dividual species a<br />
number of factors such as age, size (length <strong>and</strong> weight) <strong>and</strong> location may <strong>in</strong>fluence<br />
mercury levels (ANZFA, 2001).
5<br />
When consumed <strong>in</strong> food, methylmercury compounds are readily absorbed by the gut <strong>and</strong><br />
effectively crosses biological membranes such as the blood-bra<strong>in</strong> barrier, sp<strong>in</strong>al cord,<br />
peripheral nerves, <strong>and</strong> placenta (JECFA 2003). Once <strong>in</strong> the body, methylmercury is<br />
found bound mostly to prote<strong>in</strong>s conta<strong>in</strong><strong>in</strong>g sulfur am<strong>in</strong>o acids (e.g. cyste<strong>in</strong>e).<br />
Methylmercury can <strong>in</strong>duce toxic effects <strong>in</strong> several organ systems (nervous system,<br />
kidney, liver, reproductive organs), with neurotoxicity considered the most sensitive<br />
endpo<strong>in</strong>t (JECFA, 2003). Fetal exposure to Hg is considered to create the highest risk for<br />
develop<strong>in</strong>g toxic effects as higher levels have been found <strong>in</strong> the fetal rather than the<br />
maternal bra<strong>in</strong> (JECFA, 2003). Hence pregnant women <strong>and</strong> women of childbear<strong>in</strong>g age<br />
are potentially the most sensitive sub-group of the population. An extreme case of<br />
mercury poison<strong>in</strong>g occurred <strong>in</strong> M<strong>in</strong>amata Bay, Japan where humans, fish consum<strong>in</strong>g<br />
domestic animals such as cats, <strong>and</strong> wildlife liv<strong>in</strong>g <strong>in</strong> the mercury polluted bay showed<br />
central nervous system dysfunction signs such as convulsions, highly erratic movements,<br />
<strong>and</strong> difficulties <strong>in</strong> walk<strong>in</strong>g. Even at naturally occurr<strong>in</strong>g levels, mercury has been<br />
recognized to potentially pose a significant health risk for populations that depend on fish<br />
for daily sustenance (e.g. Sechelles <strong>and</strong> Faroes Isl<strong>and</strong>s, JECFA 2003).<br />
There are guidel<strong>in</strong>es for the amount of mercury that can be safely consumed by humans<br />
on a weekly basis. Recently the Jo<strong>in</strong>t FAO/WHO Expert Committee on Food Additives<br />
(JECFA) revised the provisional tolerable weekly dietary <strong>in</strong>take (PTWI) of<br />
methylmercury recommend<strong>in</strong>g it be reduced from 3.3 µg Hg /kg body weight/week to 1.6<br />
µg/kg/week <strong>in</strong> order to sufficiently protect the develop<strong>in</strong>g fetus (JECFA, 2003).<br />
Pregnant women with mercury <strong>in</strong>takes higher than this level have a subsequent risk of<br />
<strong>in</strong>creased developmental abnormalities appear<strong>in</strong>g <strong>in</strong> their children (JECFA, 2003).<br />
There are also Food <strong>and</strong> Agriculture Organization (FAO)/World <strong>Health</strong> Organization<br />
(WHO) Codex Alimentarius Commission guidel<strong>in</strong>es for levels of methylmercury <strong>in</strong> fish<br />
of 0.5 mg/kg <strong>and</strong> 1 mg/kg <strong>in</strong> predatory fish such as shark, swordfish, tuna etc<br />
(FAO/WHO 1991). The Codex guidel<strong>in</strong>e levels are <strong>in</strong>tended for <strong>in</strong>dividual country<br />
governments to use to regulate fresh <strong>and</strong> processed fish <strong>and</strong> fish products mov<strong>in</strong>g <strong>in</strong><br />
<strong>in</strong>ternational trade. Large predatory fish are generally the most likely to exceed the Codex
6<br />
guidel<strong>in</strong>e levels. Bender <strong>and</strong> Williams (2000) reviewed US Food <strong>and</strong> Drug<br />
Adm<strong>in</strong>istration (USFDA) data <strong>and</strong> found that 36% of the swordfish, 33% of the shark<br />
<strong>and</strong> nearly 4% of large tuna sold commercially <strong>in</strong> US between 1992 <strong>and</strong> 1998 had a<br />
methylmercury content which exceeded 1 mg/kg. A separate US-based study showed that<br />
approximately three-quarters of the sharks <strong>and</strong> swordfish <strong>and</strong> one third of large tunas<br />
sampled exceeded 0.5 mg/kg Hg (Moore, 2000). Another previous long-term<br />
comprehensive survey <strong>in</strong> the United States exam<strong>in</strong>ed the occurrence of mercury (<strong>and</strong><br />
other trace elements) (<strong>in</strong>clud<strong>in</strong>g Hg) <strong>in</strong> 204 species of f<strong>in</strong>fish, molluscs <strong>and</strong> crustaceans<br />
from 198 coastal sites (USEPA, 1997). Several species had a mean Hg level of 0.4 to 0.5<br />
mg/kg or greater, such as barracuda, sharks, grouper, marl<strong>in</strong> <strong>and</strong> sailfish. These analyses<br />
were conducted <strong>in</strong> the 1970s but are still relevant as mercury levels <strong>in</strong> mar<strong>in</strong>e fish appear<br />
to have rema<strong>in</strong>ed relatively constant for over 20 years <strong>in</strong> various species (USEPA, 1997).<br />
Mar<strong>in</strong>e mammals, such as whales <strong>and</strong> dolph<strong>in</strong>s also have high levels of mercury (Endo et<br />
al. 2003) but the catch<strong>in</strong>g <strong>and</strong> consumption of these animals is not permitted <strong>in</strong> most<br />
Pacific Isl<strong>and</strong> countries. Contam<strong>in</strong>ation aris<strong>in</strong>g from urban areas may also result <strong>in</strong> higher<br />
mercury levels. Tissues from seven fish species from San Francisco Bay were analysed<br />
for Hg <strong>in</strong> 1994 <strong>and</strong> 1997 (Davis, 1997). More than half of the fish showed concentrations<br />
above 0.23 mg/kg. An overall average level of Hg for the seven species exam<strong>in</strong>ed was<br />
0.3 mg/kg with the highest level occurr<strong>in</strong>g <strong>in</strong> leopard sharks (>1 mg/kg) <strong>and</strong> <strong>in</strong> one<br />
striped bass sample (0.99 mg/kg).<br />
In the Pacific Isl<strong>and</strong>s, there have been only a few studies of mercury <strong>in</strong> shellfish<br />
(Morrison et al., 1997; 2001) from Fiji <strong>and</strong> some fish <strong>and</strong> canned tuna <strong>in</strong> Papua New<br />
Gu<strong>in</strong>ea (Kyle <strong>and</strong> Ghani, 1981; 1982a,b). This is of concern as fresh fish, shellfish,<br />
mussels <strong>and</strong> canned tuna <strong>and</strong> mackerel are major food sources for most Pacific Isl<strong>and</strong><br />
people. In addition there is currently no mercury data available for tuna which forms one<br />
of the largest <strong>in</strong>come earn<strong>in</strong>gs for Fiji <strong>and</strong> other Pacific Isl<strong>and</strong> countries.
Purpose of the Study<br />
7<br />
The aim of the present study was to measure total Hg content <strong>in</strong> several types of seafoods<br />
which are commonly consumed <strong>in</strong> the Fiji Isl<strong>and</strong>s, <strong>in</strong>clud<strong>in</strong>g various coastal <strong>and</strong> pelagic<br />
fish species, shellfish, <strong>and</strong> canned fish. The results of the study will be used to determ<strong>in</strong>e<br />
whether there is a significant health risk aris<strong>in</strong>g from fish consumption.<br />
Research Methodology<br />
Sampl<strong>in</strong>g Methods<br />
Two hundred samples of different seafoods (fish, canned fish, shellfish) were collected<br />
<strong>and</strong> analyzed for total mercury content. Table 1 shows both the scientific (genus-species)<br />
<strong>and</strong> local names of fish species analysed <strong>in</strong> this study. The samples were collected from<br />
various sources as outl<strong>in</strong>ed below:<br />
• Albacore <strong>and</strong> Yellowf<strong>in</strong> Tuna: Samples of albacore <strong>and</strong> yellowf<strong>in</strong> tuna were supplied<br />
by a commercial fish<strong>in</strong>g company, the Fijifish Market<strong>in</strong>g Group. They also supplied<br />
general location data for where the fish were caught, <strong>and</strong> length <strong>and</strong> weight data for<br />
the whole fish. Samples were analysed separately.<br />
• Freshwater mussels (local name: Kai) <strong>and</strong> estuar<strong>in</strong>e/seawater shellfish (local name:<br />
Kaikoso): Three heaps of each type were bought from the Suva market with location<br />
of catch for each noted. The estuar<strong>in</strong>e/seawater shellfish samples were soaked<br />
overnight <strong>in</strong> seawater (collected from the USP jetty) while the freshwater mussels<br />
were soaked <strong>in</strong> normal tap water. This allows the samples to expel most of the s<strong>and</strong><br />
<strong>and</strong> other materials <strong>in</strong>gested dur<strong>in</strong>g feed<strong>in</strong>g <strong>and</strong> is a normal practice carried out<br />
before consum<strong>in</strong>g these seafoods. Ten average sized shellfish were r<strong>and</strong>omly selected<br />
from each heap, forced open, contents removed <strong>and</strong> homogenized <strong>in</strong> a wet mill. The<br />
homogenized samples from different locations were transferred <strong>in</strong>to clean plastic bags<br />
<strong>and</strong> frozen for analysis. Each homogenate was subsequently analysed for mercury.
8<br />
• Fish steaks: Steaks of various fish species (marl<strong>in</strong>, swordfish, sailfish, sunfish, walu,<br />
shark, wahoo, mahi mahi, Skipjack <strong>and</strong> kalia-blacksnapper) were bought from the<br />
local fish shops. The steak diameter was measured across the vertebral column <strong>and</strong><br />
the samples were packed <strong>in</strong> clean plastic bags <strong>and</strong> frozen. Each steak was analysed<br />
separately.<br />
• Reef fish (kaikai): A large bundle of small-sized reef fish was purchased from the<br />
Suva market. Five fish were r<strong>and</strong>omly selected from the bundle, length <strong>and</strong> weight<br />
recorded, packed <strong>in</strong> clean plastic bags <strong>and</strong> frozen. Each fish was analysed separately.<br />
• Canned Tuna <strong>and</strong> Mackerel: Three br<strong>and</strong>s of canned albacore tuna, two br<strong>and</strong>s of<br />
canned skipjack tuna <strong>and</strong> four br<strong>and</strong>s of canned mackerel were bought from local<br />
supermarkets. Each can was opened, the contents emptied <strong>in</strong> a clean plastic bag,<br />
mashed <strong>and</strong> frozen until analysis. The contents of each can were analysed separately.<br />
Table 1: Scientific <strong>and</strong> local names (where available) of fish <strong>and</strong> shellfish species<br />
analysed <strong>in</strong> this study<br />
Species Scientific Name Local Name<br />
Albacore Tuna Thunnus alalunga<br />
Yellowf<strong>in</strong> Tuna Thunnus albacares<br />
Skipjack Tuna Katsuwanas pelamis<br />
Bigeye tuna Thunnus obesus<br />
Spanish Mackerel Scomberomorus commerson Walu<br />
Striped marl<strong>in</strong> 1<br />
Tetrapturus audax<br />
Blue marl<strong>in</strong> 1<br />
Makaira mazara<br />
Barracuda Sphyraena sp. Oqo<br />
Swordfish Xiphias gladius<br />
Sailfish Istiophorus platypterus<br />
Opah Lamprius regius<br />
Sunfish Mola mola<br />
Mahi Mahi Coryphaena sp. Maimai<br />
Black snapper Macolor niger<br />
Reef fish - Kaikai<br />
Goatfish Parupeneus barber<strong>in</strong>us Mataroko<br />
Parrot Fish Scarus sp. Ulavi<br />
Rabbit fish Siganus puntatus Nuqa<br />
Peacock cod Cephalopholis argus Kawakawa<br />
Unicornfish Naso unicornis Ta<br />
Shellfish Anadara antiquata Kaikoso<br />
Freshwater mussels Batissa violacea Kai<br />
1 The exact species of marl<strong>in</strong> supplied by the fish company was unknown so the two species they catch are listed <strong>in</strong> this<br />
table.
Analysis Methods<br />
9<br />
All analyses were performed as soon as possible after sampl<strong>in</strong>g (usually
Calculations<br />
10<br />
Hg (mg/kg) = Concentration measured (µg/L) x Extract Volume (0.1L) x DF<br />
Sample weight (g)<br />
Where DF = dilution factor (usually 1).<br />
Quality Control Results<br />
BLANKS: Blanks consist<strong>in</strong>g of the digestion acids were <strong>in</strong>cluded with each batch of<br />
determ<strong>in</strong>ations. The mercury levels measured for the samples were blank corrected but<br />
usually no significant blank value was detected <strong>in</strong>dicat<strong>in</strong>g that contam<strong>in</strong>ation from the<br />
laboratory was m<strong>in</strong>imal.<br />
PRECISION: The coefficient of variance (CV) of five fish replicates analysed for total<br />
mercury determ<strong>in</strong>ation us<strong>in</strong>g was 4.0%. [CV (%) = (SD ÷ Mean) x 100]. Several samples<br />
were analysed <strong>in</strong> duplicate <strong>and</strong> results typically agreed with<strong>in</strong> 10% of their average.<br />
ACCURACY: A certified reference material (Total <strong>and</strong> methylmercury <strong>in</strong> Tuna SRM<br />
#464) was analysed with every batch of samples to check the accuracy <strong>and</strong> the efficiency<br />
of the method. The concentration of total Hg measured was <strong>in</strong> the range of 5.07-5.38<br />
mg/kg (Certified value = 5.24 ± 0.10 mg/kg based on 0.2g dry weight of the SRM).<br />
SPIKE RECOVERY: Spike recovery measurements were performed on selected samples,<br />
to test if there were any components of particular seafood that were <strong>in</strong>terfer<strong>in</strong>g with the<br />
recovery of mercury dur<strong>in</strong>g the analyses. Spike recoveries should be with<strong>in</strong> 90-110%. In<br />
the present study, the average recovery of six separate fish portions spiked with 0.8µg of<br />
Hg (added from an acidified st<strong>and</strong>ard solution) were <strong>in</strong> the range of 91 – 103%<br />
DETECTION LIMIT: The detection limit for Hg was calculated as 0.020 mg/kg based on<br />
the analysis of 2 g of the fish sample.
Results<br />
11<br />
The summary of the results for the various seafood species analysed is shown <strong>in</strong> Tables<br />
2-4 for fresh fish/shellfish species, canned fish, <strong>and</strong> fish steaks respectively. The<br />
complete data set is conta<strong>in</strong>ed with<strong>in</strong> Appendix 1 of this document. All concentrations<br />
are reported on a wet weight basis. It should be noted that this study was an <strong>in</strong>itial survey<br />
of mercury levels, as little previous data were available. Due to the large number of<br />
seafood types analysed, the number of samples that were able to be analysed on certa<strong>in</strong><br />
seafood species was limited.<br />
<strong>Mercury</strong> <strong>in</strong> Fresh fish <strong>and</strong> shellfish<br />
The summary results for the fresh fish <strong>and</strong> shellfish species along with average length<br />
<strong>and</strong> weight data is shown <strong>in</strong> Table 2. The data is also showed graphically <strong>in</strong> Figure 1 <strong>in</strong><br />
comparison to the WHO/FAO Codex Alimentarius guidel<strong>in</strong>es for methylmercury <strong>in</strong> nonpredatory<br />
fish of 0.5 mg/kg <strong>and</strong> predatory fish of 1.0 mg/kg (FAO/WHO 1991). Marl<strong>in</strong><br />
<strong>and</strong> albacore tuna were the only species that had some samples which exceeded the<br />
guidel<strong>in</strong>es (>1.0 mg/kg). However, statistical tests showed that none of the average levels<br />
were statistically significantly above the Codex guidel<strong>in</strong>e level. The marl<strong>in</strong> had a very<br />
high st<strong>and</strong>ard deviation <strong>in</strong> mercury concentrations <strong>and</strong> more samples need to be analysed<br />
to obta<strong>in</strong> more representative data on mercury levels.<br />
The tuna data were also analysed to see if a significant correlation existed between total<br />
mercury levels <strong>and</strong> length <strong>and</strong> weight. Figure 2 shows the concentration of mercury <strong>in</strong> the<br />
two tuna species plotted aga<strong>in</strong>st length <strong>and</strong> weight. There was a significant positive<br />
correlation between mercury levels with the length of yellowf<strong>in</strong> tuna (p
12<br />
Table 2: Hg levels (range <strong>and</strong> average) <strong>in</strong> different fresh fish <strong>and</strong> shellfish from the<br />
Fiji Isl<strong>and</strong>s, with length <strong>and</strong> weight data where available. (note: n = number of<br />
samples, SD = st<strong>and</strong>ard deviation)<br />
Seafood Sample n Average<br />
Length (cm)<br />
Average<br />
Weight (kg)<br />
Range [Hg]<br />
(mg/kg)<br />
Average [Hg]<br />
(mg/kg) ± SD<br />
Albacore Tuna 31 72.7 21.3 0.03 – 1.01 0.34 ± 0.22<br />
Yellowf<strong>in</strong> Tuna 24 71.3 15.2
[Hg] (mg/kg)<br />
13<br />
Figure 2: <strong>Mercury</strong> levels <strong>in</strong> albacore <strong>and</strong> yellowf<strong>in</strong> tuna versus fish weight <strong>and</strong> length<br />
[Hg] (mg/kg)<br />
1.2<br />
1<br />
0.8<br />
0.6<br />
0.4<br />
0.2<br />
Total [Hg] Vs. the Length of Albacore Tuna<br />
y = -0.0054x + 0.7319<br />
R 2 = 0.1308<br />
0<br />
0 50 100 150<br />
Length (cm)<br />
0.45<br />
0.4<br />
0.35<br />
0.3<br />
0.25<br />
0.2<br />
0.15<br />
0.1<br />
0.05<br />
Canned fish<br />
Total [Hg] Vs. the Length of Yellowf<strong>in</strong> Tuna<br />
0<br />
0 50 100 150<br />
Length (cm)<br />
y = 0.0021x - 0.0474<br />
R 2 = 0.2563<br />
[Hg] (mg/kg)<br />
1.2<br />
1<br />
0.8<br />
0.6<br />
0.4<br />
0.2<br />
Total [Hg] Vs. Weight of Albacore Tuna<br />
y = -0.0038x + 0.4164<br />
R 2 = 0.034<br />
0<br />
0 10 20 30 40 50<br />
Weight (kg)<br />
[Hg] (mg/kg)<br />
Total [Hg] Vs. Weight of Yellowf<strong>in</strong> Tuna<br />
0.45<br />
0.4<br />
0.35<br />
0.3<br />
0.25<br />
0.2<br />
0.15<br />
0.1<br />
0.05<br />
y = 0.0034x + 0.0496<br />
R 2 = 0.0593<br />
0<br />
0 20 40 60<br />
Weight (kg)<br />
The summary of the results for the various canned fish is shown <strong>in</strong> Table 3 <strong>and</strong> Figure 3.<br />
Most of the canned fish had a reasonably similar mercury content of approximately 0.1-<br />
0.2 mg/kg. None of the concentrations measured exceeded any of the WHO/FAO Codex<br />
guidel<strong>in</strong>es.
14<br />
Table 3: Hg levels <strong>in</strong> canned fish sold <strong>in</strong> the Fiji Isl<strong>and</strong>s. (note: n = number of<br />
samples, SD = st<strong>and</strong>ard deviation)<br />
Canned Fish<br />
Type<br />
n [Hg] range<br />
(mg/kg)<br />
[Hg] average<br />
(mg/kg) ± SD<br />
Canned Albacore 6 0.16 – 0.27 0.20 ± 0.03<br />
Canned Skipjack 9 0.06 – 0.11 0.08 ± 0.02<br />
Canned Tuna <strong>in</strong> oil 3 0.05 – 0.16 0.09 ± 0.05<br />
Canned Mackerel 6 0.18 – 0.22 0.21 ± 0.01<br />
Canned Salmon Style<br />
Mackerel<br />
6 0.17 – 0.29 0.23 ± 0.05<br />
Figure 3: Average total mercury concentrations <strong>and</strong> st<strong>and</strong>ard deviation (error bars)<br />
for different canned fish <strong>in</strong> comparison to FAO/WHO Codex guidel<strong>in</strong>es<br />
Total [Hg] (mg/kg)<br />
1.0<br />
0.8<br />
0.6<br />
0.4<br />
0.2<br />
0.0<br />
Fish Steaks<br />
Canned Albacore<br />
Canned Skipjack<br />
Canned Tuna <strong>in</strong> Oil<br />
Species of Fish<br />
Canned Mackerel<br />
Canned Salmon<br />
Mackerel<br />
Codex<br />
guidel<strong>in</strong>e<br />
levels<br />
The summary of the results for the various fish steaks analysed is shown <strong>in</strong> Table 4 <strong>and</strong><br />
Figure 4. The highest average mercury concentration was noted <strong>in</strong> swordfish followed by<br />
shark, sunfish <strong>and</strong> marl<strong>in</strong> steaks. Only the swordfish had average mercury concentrations
15<br />
which exceeded the 1 mg/kg WHO/FAO Codex guidel<strong>in</strong>e for predatory fish but this was<br />
not a statistically significant difference due likely to the number of samples taken (n=5)<br />
be<strong>in</strong>g small.<br />
Table 4: Hg levels (range, average, st<strong>and</strong>ard deviation) <strong>in</strong> fish steaks purchased<br />
from fish shops <strong>in</strong> Suva, Fiji<br />
Steak type n Diameter of<br />
Steak (cm)<br />
Range [Hg]<br />
(mg/kg)<br />
Average [Hg]<br />
(mg/kg) ± SD<br />
Marl<strong>in</strong> 19 19.1
16<br />
The relationship between the total mercury levels with the size of the fish steaks was also<br />
analysed. Although limited analyses were conducted, a significant positive correlation <strong>in</strong><br />
total mercury with steak size was found for swordfish <strong>and</strong> marl<strong>in</strong> (p
17<br />
where they are caught is no sure <strong>in</strong>dication of where they have been feed<strong>in</strong>g <strong>in</strong> the past.<br />
Geographical variability <strong>in</strong> mercury levels <strong>in</strong> seawater <strong>and</strong> food sources is a possible<br />
factor contribut<strong>in</strong>g to differences <strong>in</strong> mercury levels for similar length <strong>and</strong> weight fish.<br />
<strong>Mercury</strong> levels maybe higher near geothermal or volcanic activity <strong>in</strong> the sea <strong>and</strong>/or l<strong>and</strong><br />
areas. Dist<strong>in</strong>ct variations <strong>in</strong> mercury levels were observed <strong>in</strong> ra<strong>in</strong>bow trout <strong>in</strong> lakes<br />
<strong>in</strong>fluenced by different levels of geothermal <strong>in</strong>put <strong>in</strong> New Zeal<strong>and</strong> (Kim, 1995). Closer<br />
exam<strong>in</strong>ation of the albacore tuna data showed that several samples taken from near Koro<br />
Isl<strong>and</strong> showed high mercury levels for smaller length fish, which contributed to mak<strong>in</strong>g<br />
the regression non-significant. This f<strong>in</strong>d<strong>in</strong>g requires further exam<strong>in</strong>ation but it could be<br />
due to higher levels of mercury <strong>in</strong> the water as Koro is a more recently formed isl<strong>and</strong> <strong>in</strong><br />
comparison to others <strong>in</strong> Fiji. The area also conta<strong>in</strong>s undersea hydrothermal vents so more<br />
mercury methylat<strong>in</strong>g bacteria might be present. Unfortunately there is currently no data<br />
available for Fiji on mercury levels <strong>in</strong> seawater, plankton or tuna prey species.<br />
There was a statistically significant difference between average mercury levels <strong>in</strong><br />
albacore <strong>and</strong> yellowf<strong>in</strong> tuna, with the albacore hav<strong>in</strong>g higher mercury levels. This may be<br />
due to the albacore tuna analysed hav<strong>in</strong>g a slightly longer average length. Perhaps it also<br />
could be due to a difference <strong>in</strong> their feed<strong>in</strong>g habits but this is unknown at present.<br />
A strong positive correlation also existed between mercury levels <strong>and</strong> the size of<br />
swordfish, marl<strong>in</strong> <strong>and</strong> walu steaks. It is recognised that for steaks cut from an <strong>in</strong>dividual<br />
fish, steaks of vary<strong>in</strong>g sizes can result depend<strong>in</strong>g on whether the steak is cut nearer the<br />
tail or head. On average, however, a steak with larger diameter is more likely to come<br />
from a larger fish <strong>and</strong> hence more accumulation of mercury is likely to have occurred as<br />
discussed earlier. The total mercury concentration <strong>in</strong> fresh marl<strong>in</strong> (table 2) was high<br />
compared to the frozen marl<strong>in</strong> steaks obta<strong>in</strong>ed from the fish retail shops. This is because<br />
the fresh samples analysed (n=5, table 2) came from much larger sized marl<strong>in</strong> (as per<br />
length <strong>and</strong> weight data <strong>in</strong> table 2).<br />
In the present study, small reef fish <strong>and</strong> the mussels <strong>and</strong> the shellfish had very low<br />
mercury levels. These organisms are very small <strong>and</strong> at the lower trophic levels <strong>and</strong> thus
18<br />
there is low degree of mercury bioaccumulation <strong>in</strong> them. The major source of mercury <strong>in</strong><br />
shellfish would be from particles <strong>and</strong> plankton <strong>in</strong> the water. It should be noted that<br />
several of these fish <strong>and</strong> shellfish samples were caught near to the major city of Suva,<br />
which has significant sewage <strong>and</strong> <strong>in</strong>dustrial discharges to the ocean. L<strong>and</strong>-based pollution<br />
could lead to elevated Hg levels but there does not appear to be a problem for the samples<br />
we exam<strong>in</strong>ed. Some shellfish from other locations have been found to have less than 10%<br />
of the total mercury as methylmercury (Bloom 1992; Horvat et al. 1990) but the<br />
speciation for <strong>Fijian</strong> shellfish is uncerta<strong>in</strong>.<br />
<strong>Mercury</strong> levels <strong>in</strong> canned tuna <strong>and</strong> mackerel <strong>in</strong> the current study were relatively low <strong>and</strong><br />
below the recommended Codex guidel<strong>in</strong>e level. The level of mercury <strong>in</strong> canned mackerel<br />
<strong>in</strong> the present study was lower than that found for Japanese mackerel but was similar to<br />
that <strong>in</strong> New Zeal<strong>and</strong> mackerel (Kyle <strong>and</strong> Ghani, 1981). In comparison with the canned<br />
albacore tuna, the canned skipjack tuna have quite low levels of mercury which may be<br />
due to it be<strong>in</strong>g a smaller sized fish on average. The canned tuna values found <strong>in</strong> the<br />
present study were at the lower range of what has been reported previously. Values<br />
rang<strong>in</strong>g from 0.1-1.0 mg/kg have been reported for canned tuna from various countries<br />
(Holden, 1973) <strong>and</strong> a US study <strong>in</strong> 1992 found nearly 20% of canned tuna conta<strong>in</strong>ed 0.3 –<br />
0.5 mg/kg mercury <strong>and</strong> 10 % exceeded 0.5 mg/kg Hg, while <strong>in</strong> 1995 15% conta<strong>in</strong>ed 0.3 –<br />
0.5 mg/kg mercury (Johnson, 1999). Canned tuna is the most commonly consumed fish<br />
<strong>in</strong> US, averag<strong>in</strong>g 10 cans per person per year (Johnson, 1999). Similar data from the<br />
Pacific are lack<strong>in</strong>g but canned fish does form a significant part of the diet <strong>and</strong><br />
consumption may also be <strong>in</strong>creas<strong>in</strong>g due to <strong>in</strong>creas<strong>in</strong>g urbanization <strong>and</strong> less reliance on<br />
subsistence liv<strong>in</strong>g.
19<br />
Table 5: <strong>Levels</strong> of mercury for seafoods found <strong>in</strong> previous studies compared to those<br />
found <strong>in</strong> present study (table cont<strong>in</strong>ued on next page)<br />
Species<br />
Tuna species<br />
Location [Hg] mg/kg Reference<br />
Yellowf<strong>in</strong> Fiji Isl<strong>and</strong>s
20<br />
Miscellaneous Fish<br />
Ra<strong>in</strong>bow Trout New Zeal<strong>and</strong> 0.18 – 1.84 Kim, 1995<br />
Freshwater anchovy Lake Murray,PNG 0.64 Kyle <strong>and</strong> Ghani, 1982a<br />
Dolph<strong>in</strong>s Japan 4.70 – 15.0 Endo et al., 2003<br />
Predatory Whales Japan 1.64 – 46.9 Endo et al., 2003<br />
Filter-feed<strong>in</strong>g Whales Japan 0.02 – 0.1 Endo et al., 2003<br />
Electric Ray Mediterranean Sea 1.65 – 3.59 Storelli et al., 2002<br />
Eagle Ray (M . aquila) Mediterranean Sea 0.67 – 1.01 Storelli et al., 2002<br />
Freshwater Eels New Zeal<strong>and</strong> 0.12 – 0.65 Redmayne et al., 2000<br />
Barramundi Papua New Gu<strong>in</strong>ea 0.32- 0.57 Kyle <strong>and</strong> Ghani,1982a<br />
Broad snouted catfish Papua New Gu<strong>in</strong>ea 0.12 - 0.31 Kyle <strong>and</strong> Ghani, 1982a,b<br />
Sapik gar pike Lake Murray, PNG 0.44 Kyle <strong>and</strong> Ghani, 1982a<br />
Mackerel Port Moresby, PNG 0.13 - 0.15 Sorent<strong>in</strong>o, 1969 <strong>in</strong> Kyle, 1981<br />
Atlantic Barracuda 2.0 – 3.0 USEPA, 1997<br />
Barracuda Fiji 0.18 – 0.38 This Study<br />
Sailfish unknown 0.5 – 0.6 USEPA, 1997<br />
Sailfish Fiji 0.32 – 0.34 This Study<br />
Note: nd = not detected
<strong>Health</strong> <strong>Implications</strong> of <strong>Mercury</strong> <strong>Levels</strong> <strong>in</strong> <strong>Fijian</strong> <strong>Seafoods</strong><br />
21<br />
An <strong>in</strong>dication of the amount of fish or shellfish that a person could safely consume <strong>in</strong> one<br />
week without exceed<strong>in</strong>g the Jo<strong>in</strong>t FAO/WHO Expert Committee on Food Additives<br />
(JECFA, 2003) Provisional Tolerable Weekly Intake (PTWI) of 1.6 µg methylmercury/<br />
kg of body weight/week is shown graphically <strong>in</strong> Figures 4a-d. The safe human<br />
consumption level (g/week) was calculated by average Hg values (see Tables 2-4) by the<br />
JECFA (2003) PTWI <strong>and</strong> then divid<strong>in</strong>g by the average level of mercury <strong>in</strong> a particular<br />
fish. The calculations were performed for a range (10-120 kg) of <strong>in</strong>dividual body weights<br />
with heavier <strong>in</strong>dividuals theoretically able to consume more mercury without adverse<br />
health effects than lighter <strong>in</strong>dividuals. The default average human body weight used by<br />
JECFA is 60 kg but it is unclear whether this would be the same <strong>in</strong> the Pacific Isl<strong>and</strong>s.<br />
The calculated PTWI’s are based on total mercury levels as methylmercury was not<br />
measured, but as described earlier methylmercury forms nearly 100% of the total<br />
mercury levels <strong>in</strong> fish although there is some question whether this is true for the<br />
shellfish.<br />
It should be noted that some samples had limited samples taken so values can be<br />
considered only as a general guidel<strong>in</strong>e until further analyses are performed. However, it<br />
is clear that health risks, particularly to children <strong>and</strong> pregnant women, exist from<br />
consum<strong>in</strong>g relatively small quantities (
22<br />
risk of consumption of these larger-sized species of fish by pregnant women is not<br />
publicized <strong>in</strong> Fiji so a def<strong>in</strong>ite health risk exists. Canned fish can be consumed <strong>in</strong><br />
moderate quantities (4-7 cans per week depend<strong>in</strong>g on body weight) without a risk of<br />
health effects (Fig. 4c) <strong>and</strong> shellfish <strong>and</strong> reef could be consumed <strong>in</strong> very large amounts<br />
(2-3 kg/week for an average sized person, Fig 4d).<br />
The analyses <strong>in</strong> the current study were performed on raw (uncooked) fish tissue but<br />
mercury is not significantly removed by normal cook<strong>in</strong>g processes (USEPA, 2001).<br />
Because moisture is lost dur<strong>in</strong>g cook<strong>in</strong>g, the concentration of mercury (on a weight for<br />
weight basis) after cook<strong>in</strong>g is actually higher than it is <strong>in</strong> fresh uncooked fish (USEPA,<br />
2001).<br />
Figure 5: Fish price list <strong>in</strong> Suva, Fiji show<strong>in</strong>g the low price for a number of<br />
species which conta<strong>in</strong> high mercury levels.
A<br />
Safe Consumption Level (g/week)<br />
B<br />
Safe Consumption Level (g/week)<br />
2750<br />
2500<br />
2250<br />
2000<br />
1750<br />
1500<br />
1250<br />
1000<br />
750<br />
500<br />
250<br />
2500<br />
2250<br />
2000<br />
1750<br />
1500<br />
1250<br />
1000<br />
750<br />
500<br />
250<br />
0<br />
0<br />
Shark steak<br />
Swordfish steak<br />
Sunfish steak<br />
Sail fish Steak<br />
Walu Steak<br />
Kalia steak<br />
Wahoo Steak<br />
Mahi Mahi steak<br />
23<br />
Fish Steaks<br />
0 10 20 30 40 50 60 70 80 90 100 110 120<br />
Body Weight (kg)<br />
Marl<strong>in</strong><br />
Bigeye Tuna<br />
Albacore Tuna<br />
Barracuda<br />
Yellowf<strong>in</strong> Tuna<br />
Skipjack Tuna<br />
Fresh Fish<br />
0 10 20 30 40 50 60 70 80 90 100 110 120<br />
Body Weight (kg)<br />
Figure 4: Provisional Tolerable Weekly Intake (PTWI) of: A. Fish Steaks <strong>and</strong> B.<br />
Fresh Fish based on different body weights (kg).
C<br />
Safe Consumption Level (g/week)<br />
D<br />
Safe Consumption Level (g/week)<br />
2750<br />
2500<br />
2250<br />
2000<br />
1750<br />
1500<br />
1250<br />
1000<br />
750<br />
500<br />
250<br />
7000<br />
6000<br />
5000<br />
4000<br />
3000<br />
2000<br />
1000<br />
0<br />
0<br />
24<br />
Canned Tuna <strong>and</strong> Mackerel<br />
Canned Albacore<br />
Canned Mackerel<br />
Canned Skipjack<br />
0 10 20 30 40 50 60 70 80 90 100 110 120<br />
Crab Meat<br />
Reef fish<br />
Body Weight (kg)<br />
Shellfish (Kai <strong>and</strong> Kai Koso)<br />
0 10 20 30 40 50 60 70 80 90 100 110 120<br />
Body Weight (kg)<br />
Figure 4 Cont’: Provisional Tolerable Weekly Intake (PTWI) of: C. Canned Tuna<br />
<strong>and</strong> D. Shellfish, Crabs <strong>and</strong> Reef fish based on different body weights (kg).
Recommendations<br />
25<br />
1. Further mercury analyses: Further mercury analyses should be performed<br />
because the number of samples that could be taken from <strong>in</strong>dividual species was<br />
limited due to the large number of fish types analysed <strong>in</strong> this study. More<br />
emphasis should be placed on the large predatory species <strong>in</strong> subsequent research.<br />
2. Issue <strong>Health</strong> advisories <strong>and</strong> Conduct Public Education (particularly targeted<br />
at pregnant women): We recommend that public education <strong>and</strong> health advisories<br />
warn that; adults should eat no more than two portions per week (about the weight<br />
of two small cans of tuna) of the follow<strong>in</strong>g species: Shark, Swordfish, Sunfish,<br />
Marl<strong>in</strong>, Sailfish, Albacore <strong>and</strong> Bigeye tuna with pregnant women <strong>and</strong> the women<br />
of childbear<strong>in</strong>g age only allowed 1 portion a week.<br />
3. Study fish consumption patterns: There is a need to identify the species of fish<br />
most commonly eaten with<strong>in</strong> Fiji <strong>and</strong> an <strong>in</strong>dication of the approximate amounts of<br />
fish consumed. More samples could be analysed on the fish consumed <strong>in</strong> the<br />
greatest amount. It would be useful to target specific groups with<strong>in</strong> the population<br />
such as: 1. persons buy<strong>in</strong>g from the fish shops where the tuna bycatch species are<br />
sold 2. Coastal villages where fish provides an important food source 3. Pregnant<br />
women <strong>and</strong> 4. Children<br />
4. Analysis of Human Body Burdens: It is recommended that a population study<br />
be <strong>in</strong>itiated measur<strong>in</strong>g human mercury levels be performed. Hair is one of the<br />
<strong>in</strong>dicators of long-term body load for Hg while blood, breast milk <strong>and</strong> ur<strong>in</strong>e are<br />
<strong>in</strong>dicators of short term exposure. Hair would be the least <strong>in</strong>trusive <strong>in</strong>dicator to<br />
measure <strong>and</strong> samples could be collected from the target groups noted <strong>in</strong> (3) above.<br />
Hair also allows you to reconstruct the <strong>in</strong>dividuals exposure to mercury by<br />
sequential measurement of hair segments (e.g. 1 cm <strong>in</strong>tervals). Body weight could<br />
also be measured at the time of the hair sampl<strong>in</strong>g. Measurement of both total <strong>and</strong><br />
methylmercury levels <strong>in</strong> the hair would also be useful to <strong>in</strong>vestigate the dom<strong>in</strong>ant<br />
form.<br />
5. Analyses <strong>in</strong> other Pacific Isl<strong>and</strong> locations: There is a need to measure mercury<br />
levels <strong>in</strong> seafoods from the various other Pacific Isl<strong>and</strong> countries as mercury
26<br />
levels may differ from location to location due to different levels of natural <strong>in</strong>puts<br />
<strong>and</strong> localized sources of contam<strong>in</strong>ation. A good idea would be the establishment<br />
of a long-term South Pacific mercury monitor<strong>in</strong>g program.
References<br />
27<br />
ANZFA, (2001). <strong>Mercury</strong> <strong>in</strong> Fish: Advisory Statement for Pregnant Women. Food<br />
St<strong>and</strong>ards Australia New Zeal<strong>and</strong>, Media Release, Fact Sheet 2001. (see website:<br />
www.anzfa.gov.au/mediareleasespub...tsheets2001/mercury<strong>in</strong>fishadvisor1415.cfm)<br />
Bender, M. <strong>and</strong> Williams, J. (2000). The One That Got Away: FDA Fails to Protect the<br />
Public from High <strong>Mercury</strong> <strong>Levels</strong> <strong>in</strong> Seafood. <strong>Mercury</strong> Policy Project Report by<br />
California Communities Aga<strong>in</strong>st Toxics. (see website:<br />
http://mercurypolicy.org/exposure/documents/one_that_got_away.pdf).<br />
Booz, Allen <strong>and</strong> Hamilton Inc. (1979) Description of Swordfish Fishery: for South<br />
Atlantic Fishery Management Council. Charleston, S.C.<br />
Morrison, R.J. <strong>and</strong> Brown, P.L. (2003). Trace Metals <strong>in</strong> Fanga’uta Lagoon, K<strong>in</strong>gdom of<br />
Tonga. Mar<strong>in</strong>e Pollution Bullet<strong>in</strong> 46: 139-152,<br />
Bloom, N.S. (1992). On the Chemical Form of <strong>Mercury</strong> <strong>in</strong> Edible Fish <strong>and</strong> mar<strong>in</strong>e<br />
Invertebrate Tissue. Canadian Journal of Fish <strong>and</strong> Aquatic Science, 49: 1010-1017.<br />
Davis, J.A. (1997). Contam<strong>in</strong>ant Concentrations <strong>in</strong> Fish from San Francisco Bay.<br />
Richmond California, San Francisco Estuar<strong>in</strong>e Institute. 99p.<br />
De P<strong>in</strong>ho, A.P., Guimar, J.R.D., <strong>and</strong> Mart<strong>in</strong>s, A.S. (2002). Total <strong>Mercury</strong> <strong>in</strong> Muscle<br />
Tissue of five Shark Species from Brazilian Offshore Waters: Effects of Feed<strong>in</strong>g Habit,<br />
Sex <strong>and</strong> Length. Environmental Research, 89: 250-258.<br />
Dignan, C.A., Burl<strong>in</strong>game, B.A., Arther, J.M., Quigley, R.J. <strong>and</strong> Millignan, G.C. (1994).<br />
The South Pacific Isl<strong>and</strong>s Food Composition Tables.
28<br />
Endo, T., Hotta, Y., Haraguchi, K <strong>and</strong> Sakata, M. (2003). <strong>Mercury</strong> Contam<strong>in</strong>ation <strong>in</strong> the<br />
Red Meat of Whales <strong>and</strong> Dolph<strong>in</strong>s Marketed for Human Consumption <strong>in</strong> Japan.<br />
Environmental Science <strong>and</strong> Technology, 37, 2681-2685.<br />
FAO/WHO (1991). Codex Alimentarius guidel<strong>in</strong>e levels for methylmercury <strong>in</strong> fish.<br />
CAC/GL 7-1991.<br />
JECFA (2003). Sixty-first Meet<strong>in</strong>g of the Jo<strong>in</strong>t FAO/WHO Expert Committee on Food<br />
Additives (JECFA). Summary <strong>and</strong> Conclusions. Annex 4. Rome, 10-19 th June 2003.<br />
Holden, A.V. (1973). <strong>Mercury</strong> <strong>in</strong> Fish <strong>and</strong> Shellfish. A Review. Journal of Food<br />
Technology, 8: 1-25.<br />
Horvat, M., Byrne, A.R., May, K. (1990). A modified method for the determ<strong>in</strong>ation of<br />
methylmercury by gas chromatography. Talanta 37: 207-212.<br />
Johnson, H.M. (1999). Annual Report on the U.S Seafood Industry. (7 th Edition) Bellevue<br />
(WA): H.M Johnson & Associates: 1999.<br />
Kim, J.P. (1995). Methyl <strong>Mercury</strong> <strong>in</strong> Ra<strong>in</strong>bow Trout (Oncorhynchus mykiss) from Lakes<br />
Okareka, Rotomahana, Rotorua <strong>and</strong> Tarawera, North Isl<strong>and</strong>, New Zeal<strong>and</strong>. The Science<br />
of the Total Environment, 164: 209-219.<br />
Kyle, J.H. <strong>and</strong> Ghani, N. (1982a) <strong>Mercury</strong> concentrations <strong>in</strong> Ten Species of Fish from<br />
Lake Murray, Western Prov<strong>in</strong>ce. Science <strong>in</strong> New Gu<strong>in</strong>ea, 9: 48-56.<br />
Kyle, J.H. <strong>and</strong> Ghani, N. (1982b) Methyl <strong>Mercury</strong> <strong>in</strong> Human Hair: A Study of a Papua<br />
New Gu<strong>in</strong>ean Population Exposed to Methyl <strong>Mercury</strong> through Fish Consumption.<br />
Archives of Environmental <strong>Health</strong>, 37: 266-270.
29<br />
Kyle, J.H. <strong>and</strong> Ghani, N. (1981). Methyl <strong>Mercury</strong> concentrations <strong>in</strong> Canned fish available<br />
In Port Moresby. Science <strong>in</strong> New Gu<strong>in</strong>ea, 8: 1-8.<br />
Kyle, J.H. (1981). <strong>Mercury</strong> <strong>in</strong> the People <strong>and</strong> the Fish of the Fly <strong>and</strong> Stickl<strong>and</strong> River<br />
Catchments. Ecological Surveys Report. The Office of Environment <strong>and</strong> Conservation,<br />
Waigani, Papua New Gu<strong>in</strong>ea. Pp 1-59.<br />
Lacerda, L.D., Paraquetti, H.H.M., Mar<strong>in</strong>s, R.V., Rezende, E.E., Zalmon, I.R., Gomes,<br />
M.P. <strong>and</strong> Farias, V. (2000). <strong>Mercury</strong> Content <strong>in</strong> Shark Species from the South-eastern<br />
Brazillian Coast. Revista Brasileira de Biologia, 60: 571-576.<br />
Louie, H.W. (1983). Determ<strong>in</strong>ation of Total <strong>Mercury</strong> <strong>in</strong> Fish: An Improved Method.<br />
Analyst, 108: 1313-1317.<br />
Magos, L. (1971). Selective Atomic-Absorption Determ<strong>in</strong>ation of Inorganic <strong>Mercury</strong> <strong>and</strong><br />
Methylmercury <strong>in</strong> Undigested Biological Samples. Analyst, 96: 847-853.<br />
Moore, C.J. (2000). A Review of <strong>Mercury</strong> <strong>in</strong> the Environment (Its Occurrence <strong>in</strong> Mar<strong>in</strong>e<br />
Fish). Office of Environmental Management. Mar<strong>in</strong>e Resources Division, South<br />
Carol<strong>in</strong>a. P 1-20.<br />
Morrison, R.J., Gangaiya, P., Naqasima, M. R. <strong>and</strong> Naidu, R. (1997). Trace Metal Studies<br />
<strong>in</strong> the Great Astrolabe Lagoon, Fiji, a Prist<strong>in</strong>e Environment. Mar<strong>in</strong>e Pollution Bullet<strong>in</strong>,<br />
34: 353-356.<br />
Morrison, R.J., Narayan, S.P. <strong>and</strong> Gangaiya, P. (2000). Trace Element Studies <strong>in</strong> Laucala<br />
Bay, Suva, Fiji. Mar<strong>in</strong>e Pollution Bullet<strong>in</strong> 42: 397-404.<br />
Public <strong>Health</strong> Guidance Note. (2002). <strong>Mercury</strong>. Public <strong>Health</strong> Services, Queensl<strong>and</strong><br />
<strong>Health</strong> pp 1-4.
30<br />
Redmayne, A.C., Kim, J.P. <strong>and</strong> Closs, G.P (2000). Methyl <strong>Mercury</strong> Bioaccumulation <strong>in</strong><br />
Long-f<strong>in</strong>ned Eels, Anguilla dieffenbachia, from three rivers <strong>in</strong> Otago, New Zeal<strong>and</strong>. The<br />
Science of the Total Environment, 262: 37-47.<br />
Storelli, M.M. <strong>and</strong> Marcotrigiano, G.O. (2001) Total <strong>Mercury</strong> <strong>Levels</strong> <strong>in</strong> Mussel Tissue of<br />
Swordfish (Xiphias gladius) <strong>and</strong> Bluef<strong>in</strong> Tuna (Thunnus Thynnus) from the<br />
Mediterranean Sea (Italy). Journal of Food Protection, 64: 1058-1061.<br />
Storelli, M.M., Giacom<strong>in</strong>elli-Stuffler, R. <strong>and</strong> Marcotrigiano, G.O (2002). Total <strong>Mercury</strong><br />
<strong>and</strong> Methylmercury Residues <strong>in</strong> Cartilag<strong>in</strong>ous Fish from Mediterranean Sea. Mar<strong>in</strong>e<br />
Pollution Bullet<strong>in</strong>, 44: 1354-1358.<br />
USEPA (1997). A <strong>Mercury</strong> Study Report to the Congress. Wash<strong>in</strong>gton, DC Volume 1:<br />
Executive Summary. EPA-452/R-97-003.<br />
USEPA (1999). Fact Sheet- <strong>Mercury</strong> Update: Impact on Fish Advisories. EPA-823-F-99-<br />
016. Office of Water Wash<strong>in</strong>gton, D.C. (see website:<br />
http://www.epa.gov/ost/fish/mercury.html)<br />
USEPA. (2001) <strong>Mercury</strong> Update: Impact on Fish Advisories. EPA-823-F-01-011. Office<br />
of Water, Wash<strong>in</strong>gton, DC.<br />
WHO (1996).Guidel<strong>in</strong>es for Dr<strong>in</strong>k<strong>in</strong>g Water Quality. 2 nd Edition. Vol. 2. Geneva, World<br />
<strong>Health</strong> Organization, p 293.
Appendix<br />
RESULT SUMMARY FOR TOTAL MERCURY IN FISH TISSUES<br />
31<br />
# Type of Fish Length Weight (kg) Location [Hg]<br />
(cm)<br />
mg/kg<br />
1 Albacore Tuna 55 13 Lau/Cikobia, Fiji 0.03<br />
2 Albacore Tuna 55 14 Lau/Cikobia, Fiji 0.18<br />
3 Albacore Tuna 65 14 Lau/Cikobia, Fiji 0.27<br />
4 Albacore Tuna 55 11 Lau/Cikobia, Fiji 0.19<br />
5 Albacore Tuna 70 17 Lau/Cikobia, Fiji 0.40<br />
6 Albacore Tuna 70 15 Lau/Cikobia, Fiji 0.27<br />
7 Albacore Tuna 41 10 Lau/Cikobia, Fiji 0.31<br />
8 Albacore Tuna 90 40 Lau Group, Fiji 0.18<br />
9 Albacore Tuna 90 40 Lau Group, Fiji 0.13<br />
10 Albacore Tuna 95 42 Lau Group, Fiji 0.14<br />
11 Albacore Tuna 100 42 Lau Group, Fiji 0.45<br />
12 Albacore Tuna 80 36 Lau Group, Fiji 0.21<br />
13 Albacore Tuna 85 38 Lau Group, Fiji 0.33<br />
14 Albacore Tuna 87.5 39 Lau Group, Fiji 0.40<br />
15 Albacore Tuna 75 30 Lau Group, Fiji 0.28<br />
16 Albacore Tuna 80 34 Lau Group, Fiji 0.22<br />
17 Albacore Tuna 70 17 Koro Isl<strong>and</strong>, Fiji 0.18<br />
18 Albacore Tuna 70 16 Koro Isl<strong>and</strong>, Fiji 0.39<br />
19 Albacore Tuna 60 17 Koro Isl<strong>and</strong>, Fiji 0.69<br />
20 Albacore Tuna 67.5 15 Koro Isl<strong>and</strong>, Fiji 0.79<br />
21 Albacore Tuna 60 16 Koro Isl<strong>and</strong>, Fiji 0.48<br />
22 Albacore Tuna 55 14 Koro Isl<strong>and</strong>, Fiji 0.59<br />
23 Albacore Tuna 60 16 Koro Isl<strong>and</strong>, Fiji 0.78<br />
24 Albacore Tuna 65 16 Koro Isl<strong>and</strong>, Fiji 0.34<br />
25 Albacore Tuna 55 13 Koro Isl<strong>and</strong>, Fiji 1.01<br />
26 Albacore Tuna 60 15 Koro Isl<strong>and</strong>, Fiji 0.25<br />
27 Albacore Tuna 87 15 North Lau Group, Fiji 0.07<br />
28 Albacore Tuna 85 12 North Lau Group, Fiji 0.19<br />
29 Albacore Tuna 91 15 North Lau Group, Fiji 0.20<br />
30 Albacore Tuna 85 14 North Lau Group, Fiji 0.28<br />
31 Albacore Tuna 89 15 North Lau Group, Fiji 0.18<br />
32 Yellowf<strong>in</strong> Tuna 37.5 13 Yasawa/Lau Grp, Fiji 0.05<br />
33 Yellowf<strong>in</strong> Tuna 37.5 12 Yasawa/Lau Grp, Fiji 0.03<br />
34 Yellowf<strong>in</strong> Tuna 45 15 Yasawa/Lau Grp, Fiji 0.04<br />
35 Yellowf<strong>in</strong> Tuna 37.5 14 Yasawa/Lau Grp, Fiji
32<br />
44 Yellowf<strong>in</strong> Tuna 98 20 Vanuatu
33<br />
92 Barracuda 45 0.41 Suva Market 0.18<br />
93 Mussels (Kai) Nas<strong>in</strong>u River
34<br />
Result Summary for Total <strong>Mercury</strong> <strong>in</strong> Different Fish<br />
Steaks<br />
# Type of Fish Steaks Diameter of Steak (cm) [Hg] ug/g<br />
129 Marl<strong>in</strong> Steaks 10
174 Shark Steaks 17 0.84<br />
175 Shark Steaks 7 0.85<br />
176 Shark Steaks 13 0.85<br />
177 Shark Steaks 15 0.84<br />
178 Shark Steaks 16 0.74<br />
179 Shark Steaks 12 0.76<br />
180 Shark Steaks 19 0.57<br />
181 Mahi Mahi Steaks 20 0.05<br />
182 Mahi Mahi Steaks 22 0.11<br />
183 Mahi Mahi Steaks 22 0.07<br />
184 Sail Fish Steaks 25 0.34<br />
185 Sail Fish Steaks 22 0.32<br />
186 Sun Fish Steaks 22 0.78<br />
187 Sun Fish Steaks 21 0.76<br />
188 Sun Fish Steaks 22 0.78<br />
189 Sun Fish Steaks 22 0.61<br />
190 Sun Fish Steaks 31 0.67<br />
191 Black snapper Steaks 27 0.34<br />
192 Black snapper Steaks 19 0.17<br />
193 Skipjack Tuna Steaks 15 0.16<br />
194 Skipjack Tuna Steaks 15 0.11<br />
195 Skipjack Tuna Steaks 12 0.17<br />
196 Skipjack Tuna Steaks 16 0.12<br />
197 Skipjack Tuna Steaks 15 0.19<br />
198 Crab Meat 15 0.06<br />
199 Crab Meat 14 0.03<br />
200 Crab Meat 11 0.07<br />
35