Quicklook Report 2001 - People Server at UNCW
Quicklook Report 2001 - People Server at UNCW
Quicklook Report 2001 - People Server at UNCW

Create successful ePaper yourself
Turn your PDF publications into a flip-book with our unique Google optimized e-Paper software.
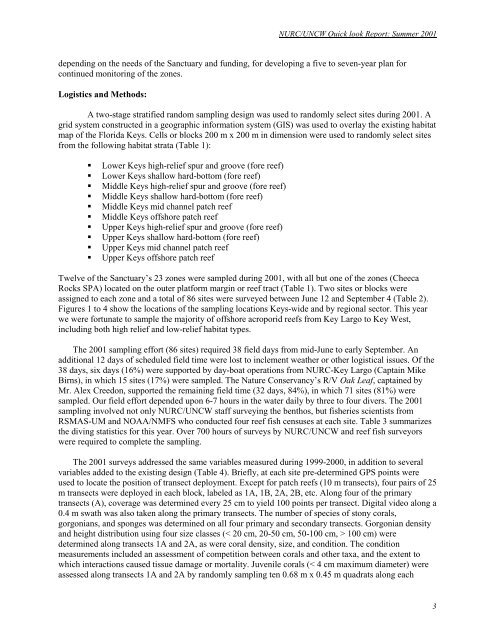
NURC/<strong>UNCW</strong> Quick look <strong>Report</strong>: Summer <strong>2001</strong><br />
depending on the needs of the Sanctuary and funding, for developing a five to seven-year plan for<br />
continued monitoring of the zones.<br />
Logistics and Methods:<br />
A two-stage str<strong>at</strong>ified random sampling design was used to randomly select sites during <strong>2001</strong>. A<br />
grid system constructed in a geographic inform<strong>at</strong>ion system (GIS) was used to overlay the existing habit<strong>at</strong><br />
map of the Florida Keys. Cells or blocks 200 m x 200 m in dimension were used to randomly select sites<br />
from the following habit<strong>at</strong> str<strong>at</strong>a (Table 1):<br />
Lower Keys high-relief spur and groove (fore reef)<br />
Lower Keys shallow hard-bottom (fore reef)<br />
Middle Keys high-relief spur and groove (fore reef)<br />
Middle Keys shallow hard-bottom (fore reef)<br />
Middle Keys mid channel p<strong>at</strong>ch reef<br />
Middle Keys offshore p<strong>at</strong>ch reef<br />
Upper Keys high-relief spur and groove (fore reef)<br />
Upper Keys shallow hard-bottom (fore reef)<br />
Upper Keys mid channel p<strong>at</strong>ch reef<br />
Upper Keys offshore p<strong>at</strong>ch reef<br />
Twelve of the Sanctuary’s 23 zones were sampled during <strong>2001</strong>, with all but one of the zones (Cheeca<br />
Rocks SPA) loc<strong>at</strong>ed on the outer pl<strong>at</strong>form margin or reef tract (Table 1). Two sites or blocks were<br />
assigned to each zone and a total of 86 sites were surveyed between June 12 and September 4 (Table 2).<br />
Figures 1 to 4 show the loc<strong>at</strong>ions of the sampling loc<strong>at</strong>ions Keys-wide and by regional sector. This year<br />
we were fortun<strong>at</strong>e to sample the majority of offshore acroporid reefs from Key Largo to Key West,<br />
including both high relief and low-relief habit<strong>at</strong> types.<br />
The <strong>2001</strong> sampling effort (86 sites) required 38 field days from mid-June to early September. An<br />
additional 12 days of scheduled field time were lost to inclement we<strong>at</strong>her or other logistical issues. Of the<br />
38 days, six days (16%) were supported by day-bo<strong>at</strong> oper<strong>at</strong>ions from NURC-Key Largo (Captain Mike<br />
Birns), in which 15 sites (17%) were sampled. The N<strong>at</strong>ure Conservancy’s R/V Oak Leaf, captained by<br />
Mr. Alex Creedon, supported the remaining field time (32 days, 84%), in which 71 sites (81%) were<br />
sampled. Our field effort depended upon 6-7 hours in the w<strong>at</strong>er daily by three to four divers. The <strong>2001</strong><br />
sampling involved not only NURC/<strong>UNCW</strong> staff surveying the benthos, but fisheries scientists from<br />
RSMAS-UM and NOAA/NMFS who conducted four reef fish censuses <strong>at</strong> each site. Table 3 summarizes<br />
the diving st<strong>at</strong>istics for this year. Over 700 hours of surveys by NURC/<strong>UNCW</strong> and reef fish surveyors<br />
were required to complete the sampling.<br />
The <strong>2001</strong> surveys addressed the same variables measured during 1999-2000, in addition to several<br />
variables added to the existing design (Table 4). Briefly, <strong>at</strong> each site pre-determined GPS points were<br />
used to loc<strong>at</strong>e the position of transect deployment. Except for p<strong>at</strong>ch reefs (10 m transects), four pairs of 25<br />
m transects were deployed in each block, labeled as 1A, 1B, 2A, 2B, etc. Along four of the primary<br />
transects (A), coverage was determined every 25 cm to yield 100 points per transect. Digital video along a<br />
0.4 m sw<strong>at</strong>h was also taken along the primary transects. The number of species of stony corals,<br />
gorgonians, and sponges was determined on all four primary and secondary transects. Gorgonian density<br />
and height distribution using four size classes (< 20 cm, 20-50 cm, 50-100 cm, > 100 cm) were<br />
determined along transects 1A and 2A, as were coral density, size, and condition. The condition<br />
measurements included an assessment of competition between corals and other taxa, and the extent to<br />
which interactions caused tissue damage or mortality. Juvenile corals (< 4 cm maximum diameter) were<br />
assessed along transects 1A and 2A by randomly sampling ten 0.68 m x 0.45 m quadr<strong>at</strong>s along each<br />
3