What is the research evidence on writing? - Department for Education
What is the research evidence on writing? - Department for Education
What is the research evidence on writing? - Department for Education
Create successful ePaper yourself
Turn your PDF publications into a flip-book with our unique Google optimized e-Paper software.
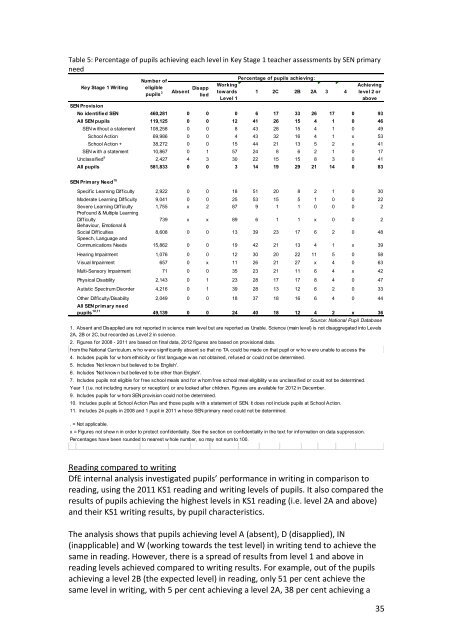
Table 5: Percentage of pupils achieving each level in Key Stage 1 teacher assessments by SEN primary<br />
need<br />
Key Stage 1 Writing<br />
SEN Prov<str<strong>on</strong>g>is</str<strong>on</strong>g>i<strong>on</strong><br />
Absent D<str<strong>on</strong>g>is</str<strong>on</strong>g>app<br />
lied<br />
Percentage of pupils achieving:<br />
Working<br />
tow ards<br />
Level 1<br />
1 2C 2B 2A 3 4<br />
Achieving<br />
level 2 or<br />
above<br />
No identified SEN 460,281 0 0 0 6 17 33 26 17 0 93<br />
All SEN pupils 119,125 0 0 12 41 26 15 4 1 0 46<br />
SEN w ithout a statement 108,258 0 0 8 43 28 15 4 1 0 49<br />
School Acti<strong>on</strong> 69,986 0 0 4 43 32 16 4 1 x 53<br />
School Acti<strong>on</strong> + 38,272 0 0 15 44 21 13 5 2 x 41<br />
SEN w ith a statement 10,867 0 1 57 24 8 6 2 1 0 17<br />
Unclassified 9<br />
2,427 4 3 30 22 15 15 8 3 0 41<br />
All pupils 581,833 0 0 3 14 19 29 21 14 0 83<br />
SEN Primary Need 10<br />
Specific Learning Difficulty 2,922 0 0 18 51 20 8 2 1 0 30<br />
Moderate Learning Difficulty 9,041 0 0 25 53 15 5 1 0 0 22<br />
Severe Learning Difficulty 1,755 x 2 87 9 1 1 0 0 0 2<br />
Profound & Multiple Learning<br />
Difficulty 739 x x 89 6 1 1 x 0 0 2<br />
Behaviour, Emoti<strong>on</strong>al &<br />
Social Difficulties 8,608 0 0 13 39 23 17 6 2 0 48<br />
Speech, Language and<br />
Communicati<strong>on</strong>s Needs 15,862 0 0 19 42 21 13 4 1 x 39<br />
Hearing Impairment 1,076 0 0 12 30 20 22 11 5 0 58<br />
V<str<strong>on</strong>g>is</str<strong>on</strong>g>ual Impairment 657 0 x 11 26 21 27 x 4 0 63<br />
Multi-Sensory Impairment 71 0 0 35 23 21 11 6 4 x 42<br />
Physical D<str<strong>on</strong>g>is</str<strong>on</strong>g>ability 2,143 0 1 23 28 17 17 8 4 0 47<br />
Aut<str<strong>on</strong>g>is</str<strong>on</strong>g>tic Spectrum D<str<strong>on</strong>g>is</str<strong>on</strong>g>order 4,216 0 1 39 28 13 12 6 2 0 33<br />
O<str<strong>on</strong>g>the</str<strong>on</strong>g>r Difficulty/D<str<strong>on</strong>g>is</str<strong>on</strong>g>ability 2,049 0 0 18 37 18 16 6 4 0 44<br />
All SEN primary need<br />
pupils 10,11<br />
49,139 0 0 24 40 18 12 4 2 x 36<br />
Source: Nati<strong>on</strong>al Pupil Database<br />
2. 3. Includes Figures <strong>for</strong> pupils 2008 achieving - 2011 are levels based 1, 2 <strong>on</strong> (including final data, levels 2012 2C, figures 2B and are 2A), based 3, 4, <strong>on</strong> those prov<str<strong>on</strong>g>is</str<strong>on</strong>g>i<strong>on</strong>al w ho wdata. ere w orking tow ards level 1, w ho w ere d<str<strong>on</strong>g>is</str<strong>on</strong>g>applied<br />
from <str<strong>on</strong>g>the</str<strong>on</strong>g> Nati<strong>on</strong>al Curriculum, w ho w ere significantly absent so that no TA could be made <strong>on</strong> that pupil or w ho w ere unable to access <str<strong>on</strong>g>the</str<strong>on</strong>g><br />
4. Includes pupils <strong>for</strong> w hom ethnicity or first language w as not obtained, refused or could not be determined.<br />
5. Includes 'Not know n but believed to be Engl<str<strong>on</strong>g>is</str<strong>on</strong>g>h'.<br />
6. Includes 'Not know n but believed to be o<str<strong>on</strong>g>the</str<strong>on</strong>g>r than Engl<str<strong>on</strong>g>is</str<strong>on</strong>g>h'.<br />
7. 8. Includes pupils not know eligible n to be <strong>for</strong> eligible free school <strong>for</strong> FSM meals in any and Spring <strong>for</strong> w hom Autumn, free Summer, school meal Alternative eligibility Prov<str<strong>on</strong>g>is</str<strong>on</strong>g>i<strong>on</strong> w as unclassified or Pupil Referral or could Unit not census be determined. going back to<br />
Year 1 (i.e. not including nursery or recepti<strong>on</strong>) or are looked after children. Figures are available <strong>for</strong> 2012 in December.<br />
9. Includes pupils <strong>for</strong> w hom SEN prov<str<strong>on</strong>g>is</str<strong>on</strong>g>i<strong>on</strong> could not be determined.<br />
10. Includes pupils at School Acti<strong>on</strong> Plus and those pupils w ith a statement of SEN. It does not include pupils at School Acti<strong>on</strong>.<br />
11. Includes 24 pupils in 2008 and 1 pupil in 2011 w hose SEN primary need could not be determined.<br />
. = Not applicable.<br />
Number of<br />
eligible<br />
pupils 3<br />
1. Absent and D<str<strong>on</strong>g>is</str<strong>on</strong>g>applied are not reported in science main level but are reported as Unable. Science (main level) <str<strong>on</strong>g>is</str<strong>on</strong>g> not d<str<strong>on</strong>g>is</str<strong>on</strong>g>aggregated into Levels<br />
2A, 2B or 2C, but recorded as Level 2 in science.<br />
x = Figures not show n in order to protect c<strong>on</strong>fidentiality. See <str<strong>on</strong>g>the</str<strong>on</strong>g> secti<strong>on</strong> <strong>on</strong> c<strong>on</strong>fidentiality in <str<strong>on</strong>g>the</str<strong>on</strong>g> text <strong>for</strong> in<strong>for</strong>mati<strong>on</strong> <strong>on</strong> data suppressi<strong>on</strong>.<br />
Percentages have been rounded to nearest w hole number, so may not sum to 100.<br />
Reading compared to <strong>writing</strong><br />
DfE internal analys<str<strong>on</strong>g>is</str<strong>on</strong>g> investigated pupils’ per<strong>for</strong>mance in <strong>writing</strong> in compar<str<strong>on</strong>g>is</str<strong>on</strong>g><strong>on</strong> to<br />
reading, using <str<strong>on</strong>g>the</str<strong>on</strong>g> 2011 KS1 reading and <strong>writing</strong> levels of pupils. It also compared <str<strong>on</strong>g>the</str<strong>on</strong>g><br />
results of pupils achieving <str<strong>on</strong>g>the</str<strong>on</strong>g> highest levels in KS1 reading (i.e. level 2A and above)<br />
and <str<strong>on</strong>g>the</str<strong>on</strong>g>ir KS1 <strong>writing</strong> results, by pupil character<str<strong>on</strong>g>is</str<strong>on</strong>g>tics.<br />
The analys<str<strong>on</strong>g>is</str<strong>on</strong>g> shows that pupils achieving level A (absent), D (d<str<strong>on</strong>g>is</str<strong>on</strong>g>applied), IN<br />
(inapplicable) and W (working towards <str<strong>on</strong>g>the</str<strong>on</strong>g> test level) in <strong>writing</strong> tend to achieve <str<strong>on</strong>g>the</str<strong>on</strong>g><br />
same in reading. However, <str<strong>on</strong>g>the</str<strong>on</strong>g>re <str<strong>on</strong>g>is</str<strong>on</strong>g> a spread of results from level 1 and above in<br />
reading levels achieved compared to <strong>writing</strong> results. For example, out of <str<strong>on</strong>g>the</str<strong>on</strong>g> pupils<br />
achieving a level 2B (<str<strong>on</strong>g>the</str<strong>on</strong>g> expected level) in reading, <strong>on</strong>ly 51 per cent achieve <str<strong>on</strong>g>the</str<strong>on</strong>g><br />
same level in <strong>writing</strong>, with 5 per cent achieving a level 2A, 38 per cent achieving a<br />
35


