MT-013: Evaluating High Speed DAC Performance - Analog Devices
MT-013: Evaluating High Speed DAC Performance - Analog Devices
MT-013: Evaluating High Speed DAC Performance - Analog Devices

Create successful ePaper yourself
Turn your PDF publications into a flip-book with our unique Google optimized e-Paper software.
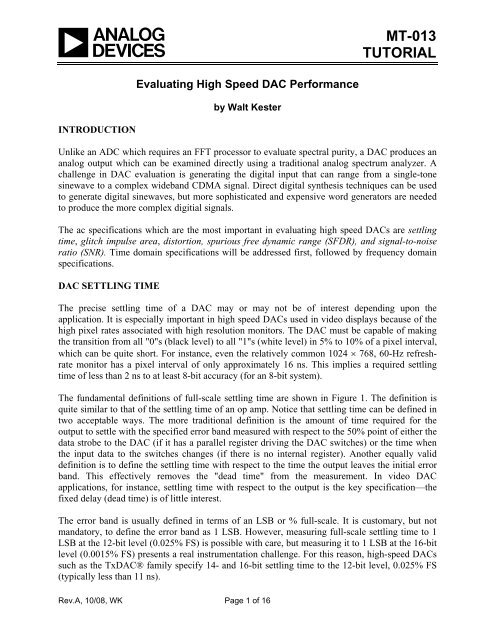
INTRODUCTION<br />
<strong>Evaluating</strong> <strong>High</strong> <strong>Speed</strong> <strong>DAC</strong> <strong>Performance</strong><br />
by Walt Kester<br />
Rev.A, 10/08, WK Page 1 of 16<br />
<strong>MT</strong>-<strong>013</strong><br />
TUTORIAL<br />
Unlike an ADC which requires an FFT processor to evaluate spectral purity, a <strong>DAC</strong> produces an<br />
analog output which can be examined directly using a traditional analog spectrum analyzer. A<br />
challenge in <strong>DAC</strong> evaluation is generating the digital input that can range from a single-tone<br />
sinewave to a complex wideband CDMA signal. Direct digital synthesis techniques can be used<br />
to generate digital sinewaves, but more sophisticated and expensive word generators are needed<br />
to produce the more complex digitial signals.<br />
The ac specifications which are the most important in evaluating high speed <strong>DAC</strong>s are settling<br />
time, glitch impulse area, distortion, spurious free dynamic range (SFDR), and signal-to-noise<br />
ratio (SNR). Time domain specifications will be addressed first, followed by frequency domain<br />
specifications.<br />
<strong>DAC</strong> SETTLING TIME<br />
The precise settling time of a <strong>DAC</strong> may or may not be of interest depending upon the<br />
application. It is especially important in high speed <strong>DAC</strong>s used in video displays because of the<br />
high pixel rates associated with high resolution monitors. The <strong>DAC</strong> must be capable of making<br />
the transition from all "0"s (black level) to all "1"s (white level) in 5% to 10% of a pixel interval,<br />
which can be quite short. For instance, even the relatively common 1024 × 768, 60-Hz refreshrate<br />
monitor has a pixel interval of only approximately 16 ns. This implies a required settling<br />
time of less than 2 ns to at least 8-bit accuracy (for an 8-bit system).<br />
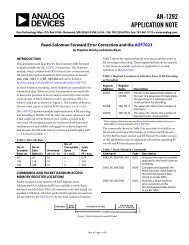
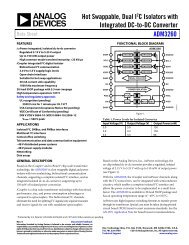
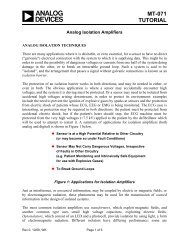
The fundamental definitions of full-scale settling time are shown in Figure 1. The definition is<br />
quite similar to that of the settling time of an op amp. Notice that settling time can be defined in<br />
two acceptable ways. The more traditional definition is the amount of time required for the<br />
output to settle with the specified error band measured with respect to the 50% point of either the<br />
data strobe to the <strong>DAC</strong> (if it has a parallel register driving the <strong>DAC</strong> switches) or the time when<br />
the input data to the switches changes (if there is no internal register). Another equally valid<br />
definition is to define the settling time with respect to the time the output leaves the initial error<br />
band. This effectively removes the "dead time" from the measurement. In video <strong>DAC</strong><br />
applications, for instance, settling time with respect to the output is the key specification—the<br />
fixed delay (dead time) is of little interest.<br />
The error band is usually defined in terms of an LSB or % full-scale. It is customary, but not<br />
mandatory, to define the error band as 1 LSB. However, measuring full-scale settling time to 1<br />
LSB at the 12-bit level (0.025% FS) is possible with care, but measuring it to 1 LSB at the 16-bit<br />
level (0.0015% FS) presents a real instrumentation challenge. For this reason, high-speed <strong>DAC</strong>s<br />
such as the Tx<strong>DAC</strong>® family specify 14- and 16-bit settling time to the 12-bit level, 0.025% FS<br />
(typically less than 11 ns).
t = 0<br />
ERROR BAND<br />
0000…0<br />
DEAD<br />
TIME<br />
SLEW<br />
TIME<br />
SETTLING TIME<br />
WITH RESPECT<br />
TO OUTPUT<br />
ERROR BAND<br />
RECOVERY<br />
TIME<br />
SETTLING TIME<br />
WITH RESPECT TO INPUT<br />
CLOCK OR DATA UPDATE<br />
LINEAR<br />
SETTLING<br />
Figure 1: <strong>DAC</strong> Full-Scale Settling Time<br />
<strong>MT</strong>-<strong>013</strong><br />
1111…1<br />
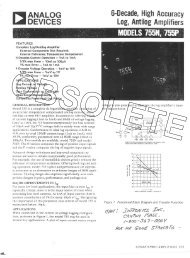
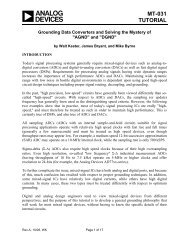
Mid-scale settling time is also of interest, because in a binary-weighted <strong>DAC</strong>, the transition<br />
between the 0111…1 code and the 1000…0 code produces the largest transient. In fact, if there<br />
is significant bit skew, the transient amplitude can approach full-scale. Figure 2 shows a<br />
waveform along with the two acceptable definitions of mid-scale settling time. As in the case of<br />
full-scale settling time, mid-scale settling time can either be referred to the output or to the latch<br />
strobe (or the bit transitions if there is no internal latch).<br />
t = 0<br />
0111…1<br />
ERROR<br />
BAND<br />
SETTLING TIME<br />
WITH RESPECT<br />
TO OUTPUT<br />
SETTLING TIME<br />
WITH RESPECT TO INPUT<br />
CLOCK OR DATA UPDATE<br />
Figure 2: <strong>DAC</strong> Mid-Scale Settling Time<br />
Page 2 of 16<br />
ERROR<br />
BAND<br />
1000…0<br />
t<br />
t
GLITCH IMPULSE AREA<br />
<strong>MT</strong>-<strong>013</strong><br />
Ideally, when a <strong>DAC</strong> output changes it should move from one value to its new one<br />
monotonically. In practice, the output is likely to overshoot, undershoot, or both. This<br />
uncontrolled movement of the <strong>DAC</strong> output during a transition is known as a glitch. It can arise<br />
from two mechanisms: capacitive coupling of digital transitions to the analog output, and the<br />
effects of some switches in the <strong>DAC</strong> operating more quickly than others and producing<br />
temporary spurious outputs.<br />
Capacitive coupling frequently produces roughly equal positive and negative spikes (sometimes<br />
called a doublet glitch) which more or less cancel in the longer term. The glitch produced by<br />
switch timing differences is generally unipolar, much larger, and of greater concern.<br />
Glitches can be characterized by measuring the glitch impulse area, sometimes inaccurately<br />
called glitch energy. The term glitch energy is a misnomer, since the unit for glitch impulse area<br />
is volt-seconds (or more probably µV-sec or pV-sec. The peak glitch area is the area of the<br />
largest of the positive or negative glitch areas.<br />
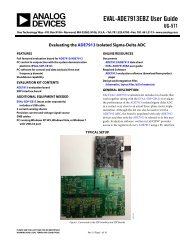
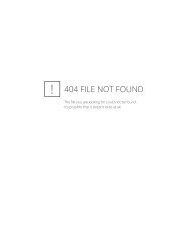
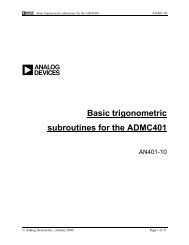
Glitch impulse area is easily estimated from the mid-scale settling time waveform as shown in<br />
Figure 3. The areas of the four triangles are used to calculate the net glitch area. Recall that the<br />
area of a triangle is one-half the base times the height. If the total positive area equals the total<br />
negative glitch area, then the net area is zero. The specification given on most data sheets is the<br />
net glitch area, although in some cases, the peak area may specified instead.<br />
AREA OF TRIANGLE = 1<br />
2<br />
AREA 1 (PEAK GLITCH AREA)<br />
AREA 3<br />
AREA 2<br />
AREA 4<br />
NET GLITCH IMPULSE AREA ≈ AREA 1 + AREA 2 – AREA 3 – AREA 4<br />
Figure 3: Glitch Impulse Area<br />
Page 3 of 16<br />
BASE × HEIGHT<br />
t
<strong>MT</strong>-<strong>013</strong><br />
OSCILLOSCOPE MEASUREMENT OF SETTLING TIME AND GLITCH IMPULSE<br />
AREA<br />
A wideband fast-settling oscilloscope is crucial to accurate settling time measurements. There<br />
are several considerations in selecting the proper scope. The required bandwidth can be<br />
calculated based on the rise/falltime of the <strong>DAC</strong> output, for instance, a 1-ns output risetime and<br />
falltime corresponds to a bandwidth of 0.35/tr = 350 MHz. A scope of at least 500-MHz<br />
bandwidth would be required. Preferably, the scope bandwidth should be at least three times the<br />
signal bandwidth to include the second and third harmonic components for a more accurate<br />
representation of the waveform.<br />
Modern digital storage scopes (DSOs) and digital phosphor scopes (DPOs) are popular and offer<br />
an excellent solution for performing settling time measurements as well as many other waveform<br />
analysis functions (see Reference 3). These scopes offer real-time sampling rates of several GHz<br />
and are much less sensitive to overdrive than older analog scopes or traditional sampling scopes.<br />
Overdrive is a serious consideration in measuring settling time, because the scope is generally set<br />
to maximum sensitivity when measuring a full-scale <strong>DAC</strong> output change. For instance,<br />
measuring 12-bit settling for a 1-V output (20 mA into 50 Ω) requires the resolution of a signal<br />
within a 0.25-mV error band riding on the top of a 1-V step function.<br />
From a historical perspective, older analog oscilloscopes were sensitive to overdrive and could<br />
not be used to make accurate step function settling time without adding additional circuitry.<br />
Quite a bit of work was done during the 1980s on circuits to cancel out portions of the step<br />
function using Schottky diodes, current sources, etc. References 4, 5, and 6 are good examples of<br />
various circuits which were used during that time to mitigate the oscilloscope overdrive<br />
problems.<br />
Even with modern DSOs and DPOs, overdrive should still be checked by changing the scope<br />
sensitivity by a known factor and making sure that all portions of the waveform change<br />
proportionally. Measuring the mid-scale settling time can also subject the scope to considerable<br />
overdrive if there is a large glitch. The sensitivity of the scope should be sufficient to measure<br />
the desired error band. A sensitivity of 1-mV/division allows the measurement of a 0.25-mV<br />
error band if care is taken (one major vertical division is usually divided into five smaller ones,<br />
corresponding to 0.2 mV/small division). If the <strong>DAC</strong> has an on-chip op amp, the fullscale output<br />
voltage may be larger, perhaps 10 V, and the sensitivity required in the scope is relaxed<br />
proportionally.<br />
Although there is a well-known relationship between the risetime and the settling time in a<br />
single-pole system, it is inadvisable to extrapolate <strong>DAC</strong> settling time using risetime alone. There<br />
are many higher order nonlinear effects involved in a <strong>DAC</strong> which dominate the actual settling<br />
time, especially for <strong>DAC</strong>s of 12-bits or higher resolution.<br />
Page 4 of 16
<strong>MT</strong>-<strong>013</strong><br />
When making settling time measurements, is generally better to make a direct connection<br />
between the <strong>DAC</strong> output and the 50-Ω scope input and avoid the use of probes. FET probes are<br />
notorious for giving misleading settling time results. If probes must be used, compensated<br />
passive ones are preferable, but they should be used with care. Skin effect associated with even<br />
short lengths of properly terminated coaxial cable can give erroneous settling time results. In<br />
making the connection between the <strong>DAC</strong> and the scope, it is mandatory that a good low<br />
impedance ground be maintained. This can be accomplished by soldering the ground of a BNC<br />
connector to the ground plane on the <strong>DAC</strong> test board and using this BNC to connect to the<br />
scope's 50-Ω input. A manufacturer's evaluation board can be of great assistance in interfacing to<br />
the <strong>DAC</strong> and should be used if available.<br />
Finally, if the <strong>DAC</strong> output is specifically designed to drive the virtual ground of an external<br />
current-to-voltage converter and does not have enough compliance to develop a measurable<br />
voltage across a load resistor, then an external op amp is required, and the test circuit measures<br />
the settling time of the <strong>DAC</strong>/op amp combination. In this case, select an op amp that has a<br />
settling time which is at least 3 to 5 times smaller than the <strong>DAC</strong> under test. If the settling time of<br />
the op amp is comparable to that of the <strong>DAC</strong>, the settling time of the <strong>DAC</strong> can be determined,<br />
because the total settling time of the combination is the root-sum-square of the <strong>DAC</strong> settling<br />
time and the op amp settling time. Solving the equation for the <strong>DAC</strong> settling time yields:<br />
<strong>DAC</strong> DISTORTION<br />
<strong>DAC</strong> Settling Time =<br />
2<br />
( Total Settling Time)<br />
− ( Op Amp Settling Time)<br />
. Eq. 1<br />
If we consider the spectrum of a waveform reconstructed by a <strong>DAC</strong> from digital data, we find<br />
that in addition to the expected spectrum (which will contain one or more frequencies, depending<br />
on the nature of the reconstructed waveform), there will also be noise and distortion products.<br />
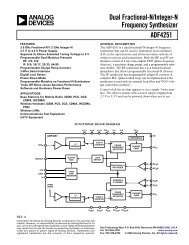
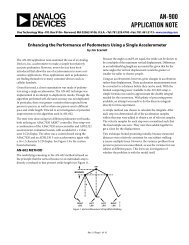
Code-dependent glitches will produce both out-of-band and in-band harmonics when the <strong>DAC</strong> is<br />
reconstructing a digitally generated sinewave as in a Direct Digital Synthesis (DDS) system. For<br />
instance, the mid-scale glitch occurs twice during a single cycle of a reconstructed sinewave (at<br />
each mid-scale crossing), and will therefore produce a second harmonic of the sinewave, as<br />
shown in Figure 4. Note that the higher order harmonics of the sinewave, which also alias back<br />
into the Nyquist bandwidth (dc to fc/2), cannot be filtered.<br />
Page 5 of 16<br />
2
f O = 3MHz<br />
AMPLITUDE<br />
f C = 10MSPS<br />
fO CANNOT<br />
BE FILTERED<br />
fC –fO f C –2f O<br />
+ FULL SCALE<br />
MIDSCALE<br />
– FULL SCALE<br />
0 1 2 3 4 5 6 7 8 9 10<br />
FREQUENCY (MHz)<br />
fc 2<br />
Figure 4: Effect of Code-Dependent Glitches on Spectral Output<br />
2f O<br />
<strong>MT</strong>-<strong>013</strong><br />
Although segmented <strong>DAC</strong> architectures can be used to greatly minimize the distortion caused by<br />
code-dependent glitches, the distortion can never be completely eliminated.<br />
It is difficult to predict the harmonic distortion or SFDR from the glitch area specification alone.<br />
Other factors, such as the overall linearity of the <strong>DAC</strong>, also contribute to distortion. In addition,<br />
integer ratios between the <strong>DAC</strong> sampling clock and the <strong>DAC</strong> output frequency and the cause the<br />
quantization noise to concentrate at harmonics of the fundamental thereby increasing the<br />
apparent distortion at these points.<br />
Because so many <strong>DAC</strong> applications are in communications and frequency analysis systems,<br />
practically all modern <strong>DAC</strong>s are now specified in the frequency domain. The basic ac<br />
specifications include harmonic distortion, total harmonic distortion (THD), signal-to-noise<br />
ratio (SNR), total harmonic distortion plus noise (THD + N), spurious free dynamic range<br />
(SFDR), etc. In order to test a <strong>DAC</strong> for these specifications, a proper digitally-synthesized signal<br />
must be generated to drive the <strong>DAC</strong> (for example, a single or multi-tone sinewave).<br />
In the early 1970s, when ADC and <strong>DAC</strong> frequency domain performance first became important,<br />
"back-to-back" testing was popular. An ADC and its companion <strong>DAC</strong> were connected together,<br />
and the appropriate analog signal source was selected to drive the ADC. An analog spectrum<br />
analyzer was then used to measure the distortion and noise of the <strong>DAC</strong> output. This approach<br />
was logical, because ADCs and <strong>DAC</strong>s were often used in conjunction with a digital signal<br />
processor placed between them to perform various functions. Obviously, it was impossible to<br />
Page 6 of 16<br />
f C
<strong>MT</strong>-<strong>013</strong><br />
determine exactly how the total ac errors were divided between the ADC and the <strong>DAC</strong>. Today,<br />
however, ADCs and <strong>DAC</strong>s are used quite independently of one another, so they must be<br />
completely tested on their own.<br />
Figure 5 shows a typical test setup for measuring the distortion and noise of a <strong>DAC</strong>. The first<br />
consideration, of course, is the generation of the digital signal to drive the <strong>DAC</strong>. To achieve this,<br />
modern arbitrary waveform generators (for example Tektronix AWG2021 with Option 4) or<br />
word generators (Tektronix DG2020) allow almost any waveform to be synthesized digitally in<br />
software, and are mandatory in serious frequency domain testing of <strong>DAC</strong>s (see Reference 3). In<br />
most cases, these generators have standard waveforms pre-programmed, such as sinewaves and<br />
triangle waves, for example. In many communications applications, however, more complex<br />
digital waveforms are required, such as two-tone or multi-tone sinewaves, QAM, GSM, and<br />
CDMA test signals, etc. In many cases, application-specific hardware and software exists for<br />
generating these types of signals and can greatly speed up the evaluation process.<br />
PROGRAMMABLE<br />
ARBITRARY<br />
WAVEFORM<br />
GENERATOR<br />
OR WORD<br />
GENERATOR<br />
CLOCK<br />
* MAY BE PART OF <strong>DAC</strong> EVALUATION BOARD<br />
DIGITAL<br />
OUTPUT<br />
LOGIC,<br />
REGISTERS,<br />
DRIVERS<br />
<strong>DAC</strong><br />
CLOCK<br />
* TIMING AND CONTROL<br />
PC<br />
BUS INTERFACE<br />
SPECTRUM<br />
ANALYZER<br />
Figure 5: Test Setup for Measuring <strong>DAC</strong> Distortion and Noise<br />
<strong>Analog</strong> <strong>Devices</strong> and other manufacturers of high performance <strong>DAC</strong>s furnish evaluation boards<br />
which greatly simplify interfacing to the test equipment. Because many communications <strong>DAC</strong>s<br />
(such as the Tx<strong>DAC</strong> ® -family) have quite a bit of on-chip control logic, their evaluation boards<br />
have interfaces to PCs via the SPI, USB, parallel, or serial ports, as well as Windows ® -<br />
compatible software to facilitate setting the various <strong>DAC</strong> options and modes of operation.<br />
Testing <strong>DAC</strong>s which are part of a direct-digital-synthesis (DDS) system is somewhat easier<br />
because the DDS portion of the IC acts as the digital signal generator for the <strong>DAC</strong>. Testing these<br />
<strong>DAC</strong>s often requires no more than the manufacturer's evaluation board, a PC, a stable clock<br />
source, and a high performance spectrum analyzer.<br />
Page 7 of 16
<strong>MT</strong>-<strong>013</strong><br />
The spectrum analyzer chosen to measure the distortion and noise performance of the <strong>DAC</strong><br />
should have at least 10-dB more dynamic range than the <strong>DAC</strong> being tested. The "maximum<br />
intermodulation-free range" specification of the spectrum analyzer is an excellent indicator of<br />
distortion performance (see Reference 7). However, spectrum analyzer manufacturers may<br />
specify distortion performance in other ways. Modern communications <strong>DAC</strong>s such as the<br />
Tx<strong>DAC</strong> ® -series require high performance spectrum analyzers such as the Rhode and Schwartz<br />
FSEA30 (Reference 7).<br />
As in the case of oscilloscopes, the spectrum analyzer must not be sensitive to overdrive. This<br />
can be easily verified by applying a signal corresponding to the full-scale <strong>DAC</strong> output,<br />
measuring the level of the harmonic distortion products, and then attenuating the signal by 6 dB<br />
or so and verifying that both the signal and the harmonics drop by the same amount. If the<br />
harmonics drop more than the fundamental signal drops, then the analyzer is distorting the<br />
signal.<br />
In some cases, an analyzer with less than optimum overdrive performance can still be used by<br />
placing a bandstop filter in series with the analyzer input to remove the frequency of the<br />
fundamental signal being measured. The analyzer looks only at the remaining distortion<br />
products. This technique will generally work satisfactorily, provided the attenuation of the<br />
bandstop filter is taken into account when making the distortion measurements. Obviously, a<br />
separate bandstop filter is required for each individual output frequency tested, and therefore<br />
multi-tone testing is cumbersome.<br />
Finally, there are a variety of application-specific analyzers for use in communications, video,<br />
and audio. In video, the Tektronix VM-700 and VM-5000 series are widely used (Reference 3).<br />
In measuring the performance of <strong>DAC</strong>s designed for audio applications, special signal analyzers<br />
designed specifically for audio are preferred. The industry standard for audio analyzers is the<br />
Audio Precision, System Two (see Reference 8). There are, of course, many other applicationspecific<br />
analyzers available which may be preferred over the general-purpose types. In addition,<br />
software is usually available for generating the various digital test signals required for the<br />
applications.<br />
Once the proper analyzer is selected, measuring the various distortion and noise-related<br />
specifications such as SFDR, THD, SNR, SINAD, etc., is relatively straightforward. The<br />
analyzer resolution bandwidth must be set low enough so that the harmonic products can be<br />
resolved above the noise floor. Figure 6 shows a typical spectral output where the SFDR is<br />
measured.<br />
Page 8 of 16
dB<br />
NOISE<br />
FLOOR<br />
FULL-SCALE (FS)<br />
SIGNAL (CARRIER)<br />
SFDR (dBc)<br />
SFDR (dBFS)<br />
WORST SPUR LEVEL<br />
Figure 6: Measuring <strong>DAC</strong> Spurious Free Dynamic Range (SFDR)<br />
fc 2<br />
<strong>MT</strong>-<strong>013</strong><br />
Figure 7 shows how to measure the various harmonic distortion components with a spectrum<br />
analyzer. The first nine harmonics are shown. Notice that aliasing causes the 6 th , 7 th , 8 th , 9 th , and<br />
10 th harmonic to fall back inside the fc/2 Nyquist bandwidth.<br />
NOISE<br />
FLOOR<br />
dB<br />
SIGNAL (CARRIER), S<br />
V2<br />
S/(NOISE FLOOR)<br />
BW = ANALYZER RESOLUTION BANDWIDTH<br />
SNR = S/(NOISE FLOOR) – 10 log 10<br />
2nd - 10th HARMONICS SHOWN<br />
SWEEP<br />
f c /2<br />
BW<br />
BW<br />
V3<br />
V10 V9 V4 V8 V5 V7 V6 V6 V7<br />
Figure 7: Measuring <strong>DAC</strong> Distortion and SNR with an <strong>Analog</strong> Spectrum Analyzer<br />
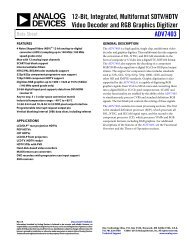
The harmonics of the input signal can be distinguished from other distortion products by their<br />
location in the frequency spectrum. Figure 8 shows a 7-MHz input signal sampled at 20 MSPS<br />
and the location of the first 9 harmonics. Aliased harmonics of fo fall at frequencies equal to<br />
|±Kfc ± nfo|, where n is the order of the harmonic, and K = 0, 1, 2, 3,.... The second and third<br />
Page 9 of 16<br />
f c<br />
2<br />
f<br />
f
<strong>MT</strong>-<strong>013</strong><br />
harmonics are generally the only ones specified on a data sheet because they tend to be the<br />
largest, although some data sheets may specify the value of the worst harmonic. An interactive<br />
Harmonic Image Calculator applet is available on the <strong>Analog</strong> <strong>Devices</strong>' Design Center website<br />
which shows the locations of the second and third harmonics as a function of output frequency<br />
and <strong>DAC</strong> update rate. In addition, the tool shows the attenuation effects of the sin x/x rolloff and<br />
the output anti-imaging filter.<br />
<strong>DAC</strong> NOISE<br />
RELATIVE<br />
AMPLITUDE<br />
HARMONICS AT: |±Kfc ±nfo |<br />
n = ORDER OF HARMONIC, K = 0, 1, 2, 3, . . .<br />
3 6 9 8 5 2 4 7<br />
1 2 3 4 5 6 7 8 9 10<br />
FREQUENCY (MHz)<br />
f o<br />
= 7MHz<br />
HARMONICS HARMONICS<br />
f c = 20MSPS<br />
Figure 8: Location of First 9 Harmonic Products: Output<br />
Signal = 7 MHz, <strong>DAC</strong> Update Rate = 20 MSPS<br />
The spectrum analyzer can also be used to measure SNR if the proper correction factors are<br />
taken into account. Figure 7 shows the analyzer sweep bandwidth, BW, which in most cases will<br />
be considerably less than fc/2. First, measure the noise floor level with respect to the signal level<br />
at a point in the frequency spectrum which is relatively free of harmonics. This corresponds to<br />
the value "S/(NOISE FLOOR)" in the diagram. The actual SNR over the dc to fc/2 bandwidth is<br />
obtained by subtracting the process gain, 10log10(fc/2·BW), from the S/(NOISE FLOOR).<br />
SNR = S/(NOISE FLOOR) – 10log10(fc /2·BW). Eq. 2<br />
In order for this SNR result to be accurate, one must precisely know the analyzer bandwidth. The<br />
bandwidth characteristics of the analyzer should be given out in the manufacturer's<br />
documentation. Also, if there is any signal averaging used in the analyzer, that may affect the net<br />
correction factor.<br />
In order to verify the process gain calculation, several LSBs can be disabled—under these<br />
conditions, the SNR performance of the <strong>DAC</strong> should approach ideal. For instance, measuring the<br />
8-bit SNR of a low distortion, low noise 12-, 14-, or 16-bit <strong>DAC</strong> should produce near theoretical<br />
Page 10 of 16
<strong>MT</strong>-<strong>013</strong><br />
results. The theoretical 8-bit SNR, calculated using the formula SNR = 6.02N + 1.76 dB, is 50<br />
dB. The process gain can then be calculated using the formula:<br />
PROCESS GAIN = S/(NOISE FLOOR) – SNR. Eq. 3<br />
The accuracy of this measurement should be verified by enabling the 9 th bit of the <strong>DAC</strong> and<br />
ensuring that the analyzer noise floor drops by 6 dB. If the noise floor does not drop by 6 dB, the<br />
measurement should be repeated using only the first 6 bits of the <strong>DAC</strong>. If near theoretical SNR is<br />
not achieved at the 6-bit level, the <strong>DAC</strong> under consideration is probably not suitable for ac<br />
applications where noise and distortion are important.<br />
The relationship between SINAD, SNR, and THD can be derived as follows. THD is defined as<br />
the ratio of the signal to the root-sum-square (rss) of a specified number harmonics of the<br />
fundamental signal. IEEE Std. 1241-2000 (Reference 9) suggests that the first 10 harmonics be<br />
included. Various manufacturers may choose to include fewer than 10 harmonics in the<br />
calculation. <strong>Analog</strong> <strong>Devices</strong> defines THD to be the root-sum-square of the first 6 harmonics (2 nd ,<br />
3 rd , 4 th , 5 th , and 6 th ) for example. In practice, the difference in dB between THD measured with<br />
10 versus 6 harmonics is less than a few tenths of a dB, unless there is an extreme amount of<br />
distortion. The various harmonics, V2 through V6, are measured with respect to the signal level,<br />
S, in dBc. They are then converted into a ratio, combined on an rss basis, and converted back<br />
into dB to obtain the THD.<br />
The signal-to-noise-and-distortion, SINAD, can then be calculated by combining SNR and THD<br />
as a root-sum-square:<br />
10<br />
( ) ( ) 2<br />
−SNR<br />
/ 20 2 −THD<br />
/ 20<br />
10 + 10<br />
SINAD = 20log<br />
. Eq. 4<br />
An SNR/THD/SINAD Calculator applet is available on the <strong>Analog</strong> <strong>Devices</strong>' Design Center<br />
website to assist in these conversions.<br />
One of the most important factors in obtaining accurate distortion measurements is to ensure that<br />
the <strong>DAC</strong> output frequency, fo is not a sub-harmonic of the update rate, fc. If fc/fo is an integer,<br />
then the quantization error is not random, but is correlated with the output frequency. This causes<br />
the quantization noise energy to be concentrated at harmonics of the fundamental output<br />
frequency, thereby producing distortion which is an artifact of the sampling process rather than<br />
nonlinearity in the <strong>DAC</strong>. It should be noted that these same artifacts can occur in evaluating<br />
ADCs.<br />
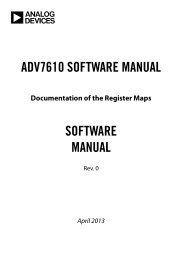
To illustrate this point, Figure 9 shows simulated results for an ideal 12-bit <strong>DAC</strong> where 9A<br />
shows the output frequency spectrum for the case of fc/fo = 40. Notice that the SFDR is<br />
approximately 77 dBc. The right-hand spectral output (9B) shows the case where the fc/fo ratio is<br />
a non-integer—the quantization noise is now random, and the SFDR is 93 dBc.<br />
Page 11 of 16
0<br />
−50<br />
−100<br />
−150<br />
(A) CORRELATED NOISE (B) UNCORRELATED NOISE<br />
f c = 80.000 MSPS, f o = 2.000 MHz f c = 80.000 MSPS, f o = 2.111 MHz<br />
SFDR = 77 dBc SFDR = 93 dBc<br />
−50<br />
SNR = 74 dBc SNR = 74 dBc<br />
−200<br />
0 5 10 15 20 25 30 35 40<br />
FREQUENCY - MHz<br />
0<br />
−100<br />
−150<br />
−200<br />
0 5 10 15 20 25 30 35 40<br />
FREQUENCY - MHz<br />
<strong>MT</strong>-<strong>013</strong><br />
Figure 9: Correlated (A) and Uncorrelated (B) Quantization Noise Spectrum of an<br />
Ideal 12-Bit <strong>DAC</strong><br />
Because of the wide range of possible clock and output frequencies, <strong>Analog</strong> <strong>Devices</strong> offers<br />
special fast-turnaround measurements on Tx<strong>DAC</strong>s for specific customer test vectors. This<br />
important service allows system designers to do advance frequency planning to ensure optimum<br />
distortion performance for their application.<br />
In lieu of specific frequency measurements, the SFDR performance of a <strong>DAC</strong> is often plotted as<br />
a function of the output frequency at fixed clock rates. This data is usually taken for sinewave<br />
outputs of various amplitudes as shown in Figure 10 for the AD9777 16-bit Tx<strong>DAC</strong>. Note that<br />
this plot does not include data points where there is strong correlation between the quantization<br />
noise and the signal (i.e., where the ratio of the clock frequency to the output frequency is an<br />
integer number).<br />
<strong>DAC</strong> OUTPUT FREQUENCY (MHz)<br />
Figure 10: AD9777 16-bit Tx<strong>DAC</strong> SFDR, Data Update Rate = 160 MSPS<br />
Page 12 of 16
<strong>MT</strong>-<strong>013</strong><br />
There is another useful test method that gives a good overall indicator of the <strong>DAC</strong> performance<br />
at various combinations of output and clock frequencies. Specifically, this involves testing<br />
distortion for output frequencies, fo, equal to fc/3 and fc/4. In practice, the output frequency is<br />
slightly offset by a small amount, Δf, where Δf is a non-integer fraction of fc, i.e., Δf = kfc, where<br />
k
<strong>MT</strong>-<strong>013</strong><br />
These measurements are relatively easy to make, since once the ratio of fo to fc is established by<br />
the DDS or digital waveform generator, it is preserved as the master clock frequency is changed.<br />
Figure 13 shows a typical plot of SFDR versus clock frequency for a low distortion <strong>DAC</strong> with<br />
two output frequencies fc/3 and fc/4. In most cases, the fc/3 distortion represents a worst case<br />
condition and is good for comparing various <strong>DAC</strong>s.<br />
SFDR<br />
(dBc)<br />
80<br />
70<br />
60<br />
50<br />
40<br />
f o = f c<br />
3<br />
– Δf<br />
f o = f c<br />
4<br />
0 25 50 75 100 125 150<br />
CLOCK FREQUENCY (MHz)<br />
– Δf<br />
Δf = kf c ,<br />
k
1<br />
A<br />
0<br />
–3.92dB<br />
SAMPLED<br />
SIGNAL<br />
RECONSTRUCTED<br />
SIGNAL<br />
IMAGES<br />
1<br />
fc IMAGES<br />
A =<br />
π f<br />
sin<br />
f c<br />
π f<br />
f c<br />
0.5f c f c 1.5f c 2f c 2.5f c 3f c<br />
t<br />
t<br />
IMAGES<br />
Figure 14: <strong>DAC</strong> sin(x)/x Roll Off (Amplitude Normalized)<br />
<strong>MT</strong>-<strong>013</strong><br />
If there is no compensation for the sin(x)/x rolloff, it must be considered when making<br />
bandwidth measurements on the <strong>DAC</strong> output. The effect of the rolloff on distortion and SNR<br />
measurements is negligible over the Nyquist bandwidth, dc to fc/2.<br />
An interactive Harmonic Image Calculator applet is available on the <strong>Analog</strong> <strong>Devices</strong>' Design<br />
Center website which shows the locations of the second and third harmonics as a function of<br />
output frequency and <strong>DAC</strong> update rate. In addition, the tool shows the attenuation effects of both<br />
the sin(x)/x rolloff and the output anti-imaging filter.<br />
Page 15 of 16<br />
f
REFERENCES<br />
Page 16 of 16<br />
<strong>MT</strong>-<strong>013</strong><br />
1. Jim R. Naylor, "Testing Digital/<strong>Analog</strong> and <strong>Analog</strong>/Digital Converters," IEEE Transactions on Circuits<br />
and Systems, Vol. CAS-25, July 1978, pp. 526-538.<br />
2. Dan Sheingold, <strong>Analog</strong>-Digital Conversion Handbook, 3 rd Edition, <strong>Analog</strong> <strong>Devices</strong> and Prentice-Hall,<br />
1986, ISBN-0-13-032848-0. (the defining and classic book on data conversion).<br />
3. Tektronix, Inc., 14200 SW Karl Braun Drive, P. O. Box 500, Beaverton, OR 97077, Phone: (800) 835-<br />
9433, http://www.tek.com. (the website contains a wealth of information on oscilloscopes, measurement<br />
techniques, probing, etc., as well as complete specifications on products).<br />
4. Howard K. Schoenwetter, "<strong>High</strong> Accuracy Settling Time Measurements," IEEE Transactions on<br />
Instrumentation and Measurement, Vol. IM-32, No. 1, March 1983, pp. 22-27.<br />
5. James R. Andrews, Barry A. Bell, Norris S. Nahman, and Eugene E. Baldwin, "Reference Waveform Flat<br />
Pulse Generator," IEEE Transactions on Instrumentation and Measurement, Vol. IM-32, No. 1, March<br />
1983, pp. 27-32.<br />
6. Barry Harvey, "Take the Guesswork out of Settling-Time Measurements," EDN, September 19 1985, pp.<br />
177-189.<br />
7. Rohde & Schwarz, Inc., 8661A Robert Fulton Dr., Columbia, MD 21046-2265, Phone: (410) 910-7800,<br />
http://www.rohde-schwarz.com. (a premier manufacturer of spectrum analyzers, the website contains<br />
tutorials on frequency analysis as well as product specifications).<br />
8. Audio Precision, 5750 S.W. Arctic Drive, Beaverton, Oregon 97005, http://www.audioprecision.com. (the<br />
recognized industry standard for professional audio measurement equipment).<br />
9. IEEE Std. 1241-2000, IEEE Standard for Terminology and Test Methods for <strong>Analog</strong>-to-Digital Converters,<br />
IEEE, 2001, ISBN 0-7381-2724-8.<br />
10. Walt Kester, <strong>Analog</strong>-Digital Conversion, <strong>Analog</strong> <strong>Devices</strong>, 2004, ISBN 0-916550-27-3, Chapter 2 and 5.<br />
Also available as The Data Conversion Handbook, Elsevier/Newnes, 2005, ISBN 0-7506-7841-0, Chapter<br />
2 and 5.<br />
Copyright 2009, <strong>Analog</strong> <strong>Devices</strong>, Inc. All rights reserved. <strong>Analog</strong> <strong>Devices</strong> assumes no responsibility for customer<br />
product design or the use or application of customers’ products or for any infringements of patents or rights of others<br />
which may result from <strong>Analog</strong> <strong>Devices</strong> assistance. All trademarks and logos are property of their respective holders.<br />
Information furnished by <strong>Analog</strong> <strong>Devices</strong> applications and development tools engineers is believed to be accurate<br />
and reliable, however no responsibility is assumed by <strong>Analog</strong> <strong>Devices</strong> regarding technical accuracy and topicality of<br />
the content provided in <strong>Analog</strong> <strong>Devices</strong> Tutorials.